INTRODUCTION
Lower extremity movement symmetry is often established as a goal of return to sport protocols when unilateral musculoskeletal injuries impair movement on one side. The single leg squat (SLS) can be utilized as both an examination tool and a therapeutic exercise due to its potential to identify movement asymmetries1 as well as rehabilitate lower extremity injury.2 Similarities in joint kinematics between the SLS and high-velocity sports maneuvers like jogging and jumping have been also been demonstrated.3,4 Improving biomechanics during the SLS may therefore facilitate rehabilitative goals for movements during athletic tasks. Various injuries have been found to disrupt SLS biomechanics, eliciting decreased measures in overall squat depth, knee flexion angle, and hip flexion angle.5,6 However, little is known about how patient reported symptoms that are often related to injury (i.e., pain, tightness, weakness) influence SLS mechanics and movement symmetry.
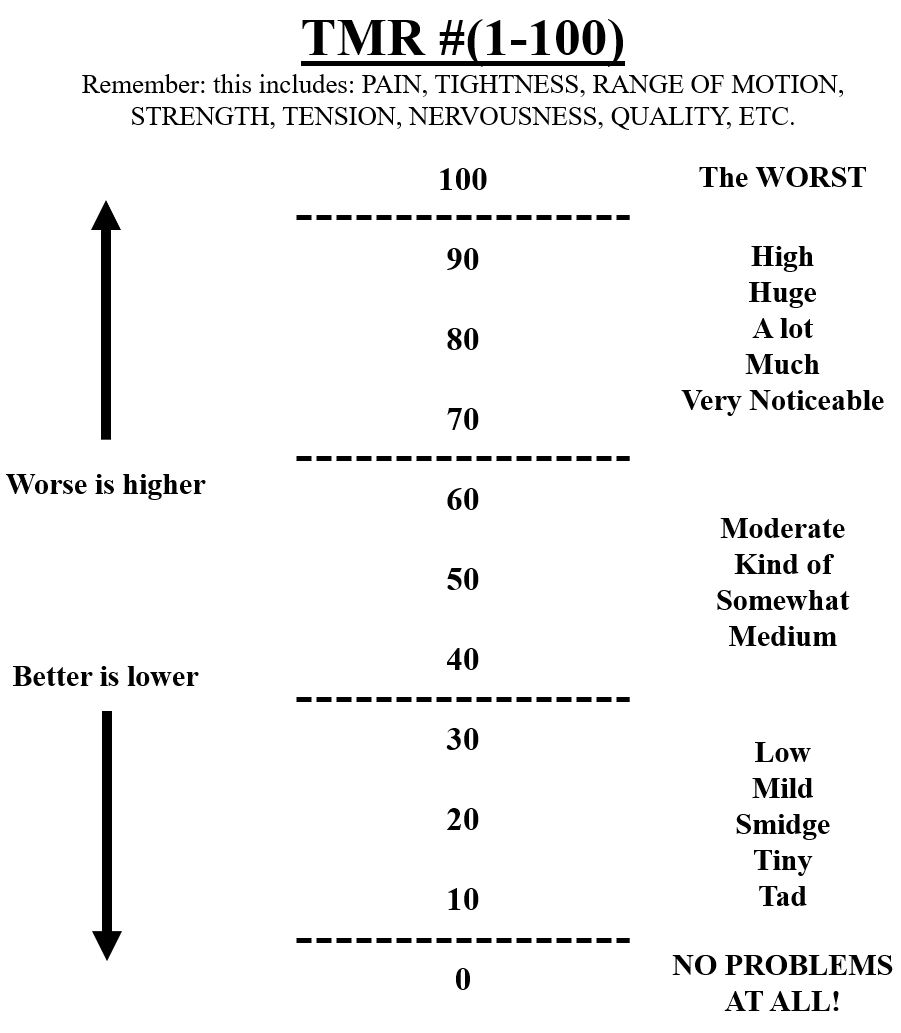
Total Motion Release® (TMR®) is a rehabilitation protocol theorized to reduce symptoms of dysfunction such as pain, tightness, and limited range of motion (ROM) by performing movements on the side contralateral to the symptomatic limb.7–9 When using TMR®, a baseline series of six upper (arm raise, trunk twist, arm press) and lower extremity motions (single leg squat, straight leg raise, single leg sit-to-stand), are first performed and each motion is then rated by the patient on both sides using a scale from 0-100.8,10 The higher the rating, the greater the patient’s symptoms, which may be related to subjective measures of stability, range of motion, pain, tightness, etc.7 As the protocol aims to identify imbalances based on patient-reported symptoms during the movements, it may have utility for identifying dysfunction related to a variety of underlying injury mechanisms. After an imbalance or imbalances are identified (i.e., a difference in scores between sides), the patient will self-treat by using the movement with the greatest imbalance and performing that motion on the side that scored lower (i.e., the preferred side).8,11 Performing the exercises on the preferred side is thought to improve symptoms on the non-preferred side (i.e., the side that scored higher); thus, practitioners can reduce the risk of exacerbating symptoms in the early phases return to sport protocols.
The TMR® protocol is theorized to work from a model of regional interdependence that infers a connectedness across body segments.7 This theory is supported by studies that have found increased internal and external shoulder ROM by performing movements such as the trunk twist and arm raise10,11; and a TMR® protocol9 using a trunk twist and straight leg raise has demonstrated the ability to increase hip internal rotation. In addition to TMR® protocols, researchers12 have found increased reach during a star excursion balance test (SEBT) on the unstable leg of participants with chronic ankle instability, as well as improvements in participant reported functional activities of daily living on the unstable leg after exclusive training on the stable leg. Prior studies provide evidence that both a mechanical and cognitive change related to the untrained side may occur following unilateral training protocols.
Of the six primary TMR® movements, the SLS requires the most strength and coordination to perform and may be most applicable when gauging readiness for return to sport. Therefore, the purpose of this study was to evaluate whether perceived asymmetries identified by a TMR® scoring protocol were related to biomechanical asymmetries during a SLS and whether improving perceived asymmetries influenced movement mechanics. The hypothesis for the study was that participants with perceived asymmetries would also present with biomechanical asymmetries. A secondary hypothesis was that participants would reduce their perceived asymmetries after performing the TMR® protocol and subsequently have greater biomechanical symmetry.
METHODS
Participants
Twenty-seven participants were recruited from a convenience sample for the current study. Individuals with a history of musculoskeletal conditions (e.g., anterior knee pain, hamstring strain, hip impingement) or prior orthopedic surgery were eligible for inclusion. Exclusion criteria included not having at least a 10-point difference between legs on the single leg squat (SLS) test, inability to perform the SLS within a self-selected pain tolerance on the non-preferred side, bilateral pain during SLS screening, or use of medications affecting proprioception. Although participants may have experienced symptoms potentially related to musculoskeletal issues, researchers did not clinically diagnose or confirm any specific injuries or pathologies. All participants provided informed consent approved by the University’s institutional review board prior to participation.
Instrumentation
Three-dimensional kinematic data were captured with an eight-camera motion capture system at 200 Hz (VICON, Oxford Metric Ltd., Oxford, UK). Forty-five retro-reflective markers were used to create a custom cluster-based model for the pelvis and lower extremities. Markers were attached to the participants using double sided and elastic tapes. The markers defined segments for the trunk and pelvis, as well as the thigh, shank, and foot bilaterally. All markers used to create joint centers (i.e., pelvis, knee joint, and ankle joint) were placed by a single member of the research team to maintain consistency across participants and between the participant’s legs. Kinetic data were captured at 1000 Hz by a force plate (ORG-6, AMTI Inc., Watertown, MA, USA) temporally synchronized with the motion capture system.
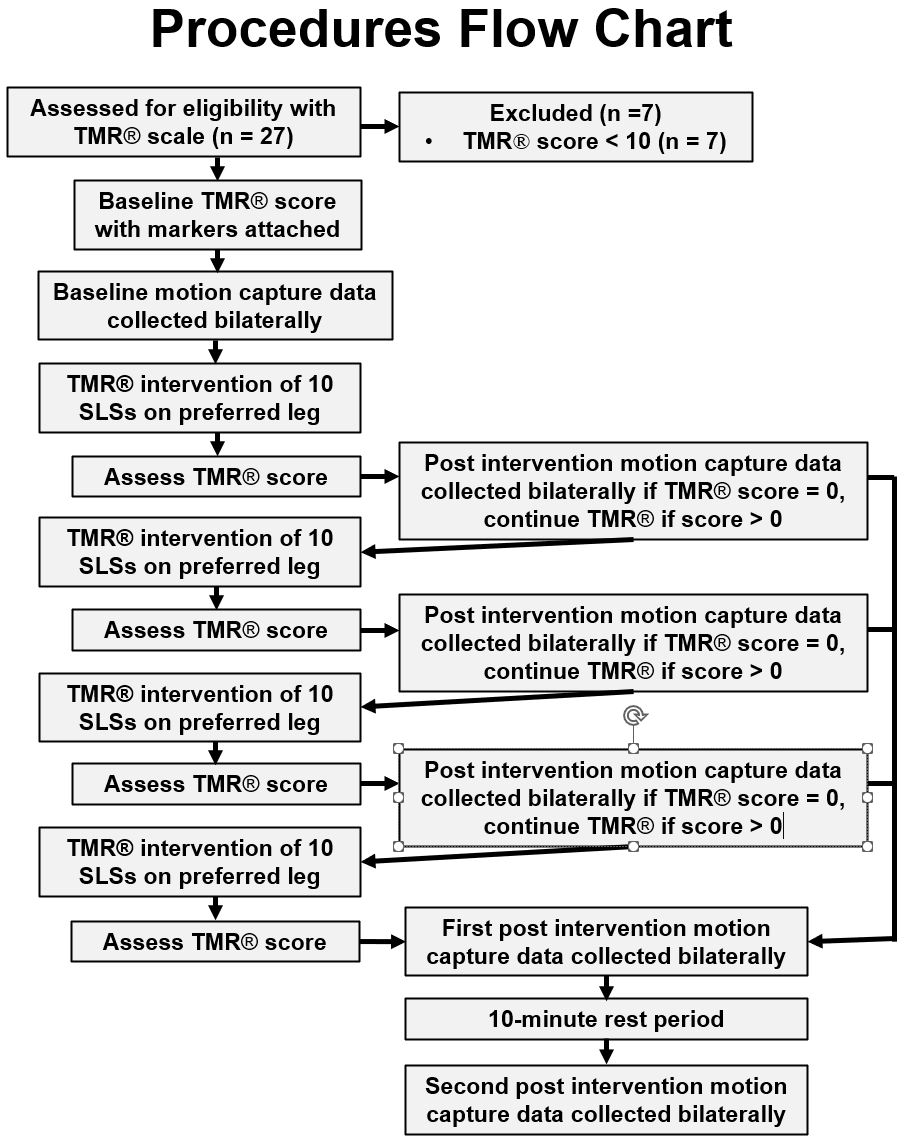
TMR® Pre-Post Procedures

The following procedures expand upon the flow chart (Figure 1). Prior to motion capture, participants performed the SLS, and identified preferred and non-preferred sides using the TMR® protocol. The participants were first shown the TMR® rating scale which considers pain, tightness, range of motion (ROM), strength, tension, nervousness, quality, etc. (Figure 2). Participants were asked to rate their SLS on the 0–100-point scale

using the above criteria. The SLS began in a position with hip of the non-stance limb in a partially flexed position and the knee extended, with their hands on their waists. Hand position was to be maintained for the duration of the squat. Participants were then asked to squat down as far as they could without pausing at the bottom of the squat and without allowing the heel of their non-stance limb to touch the ground. This was performed a maximum of three times on each leg to identify their scores on each leg as well as the location of their symptoms. The leg that scored higher was defined as the non-preferred leg and the leg that scored lower was defined as the preferred leg. A difference score was calculated between the two limbs by subtracting the lowest from the largest self-reported score. Participants who reported a bilateral difference score of 10 or greater were invited to continue through the remainder of the study. Participants with a reported difference of less than 10 were excluded from further study participation. To limit response bias, participants were not informed that either symmetry or asymmetry during the screen was part of the inclusion criteria for continued participation in the study.
Following marker placement, participants performed one SLS on each limb (starting with the non-preferred side) and rated each leg again on the 0-100 scale. This was performed to account for the potential of the attachments of the retro-reflective markers and clusters to affect the participants perception of the movement. This was the baseline score that was used for subsequent analyses. Participants then performed SLSs on the force plate in the 3D capture space. Motion capture data were collected on each leg (starting with the non-preferred) to achieve eight ‘good’ trials to be used as their baseline data prior to the intervention. Due to the TMR® protocol using the preferred leg to perform the treatment, the non-preferred side was collected first to remove the potential of a treatment effect by continuing to perform repetitions of the SLS on the preferred leg. A trial was deemed as ‘not good’ and recollected if the participant performed the trial in a non-continuous manner (i.e., pausing at the bottom), or lost balance as determined by the stance foot moving out of its original position, or their hands came off their waist. The number of trials was based on prior statistical models that determined a minimum of seven trials was necessary to reach a statistical power of 0.8 for kinematic data during a Statistical Parametric Mapping (SPM) analysis.13 Trials were performed at a participant selected rate to limit fatigue and squat velocity was not controlled for.
Following the collection of baseline data, participants performed the SLS TMR® intervention. This consisted of performing the SLS in sets of ten repetitions only on the preferred side. Participants were allowed to perform these squats at their own pace as long as they were able to complete them within 90 seconds. Symmetry of TMR® scores between the two legs was reassessed with one SLS on each leg (starting on the non-preferred side) after each set. Following the completion of the ten repetitions and reassessment of the TMR® scores, a rest period of 30 seconds was given between sets. If the self-reported score imbalances were resolved (i.e., the difference between sides was equal to zero) the intervention was completed, and participants moved on to perform the first post treatment assessment. The intervention was also stopped if the maximum number of four sets were performed without a symmetrical score being achieved. Participants were not informed that achieving a symmetrical score between legs was necessary to complete the intervention. After the TMR® intervention, the participants were reassessed bilaterally using the same motion capture procedures. Participants performed eight good trials on each leg, starting with eight on the non-preferred side. These SLSs were performed in the same manner as the baseline testing which allowed them to be performed at a self-selected rate. Following the first set of post-treatment SLSs, participants were asked to sit on a treatment table for 10-minutes to observe the potential of immediate treatment effects to dissipate. After 10-minutes had elapsed, participants reassessed their score by performing one SLS on each leg. Then, eight more single leg squats were collected bilaterally, starting on the non-preferred side, following the same instructions as the baseline and first post-treatment protocol.
Data Analysis
Angular kinematics and kinetics were computed using a Cardan (X-Y-Z) rotation sequence with Visual 3D software (v6, C-Motion Inc., Germantown, MD, USA). Marker trajectories were filtered using a low-pass, fourth-order Butterworth filter at 6 Hz.14,15 Ground reaction force data were filtered using a low-pass, fourth order Butterworth filter with a cutoff frequency of 10 Hz.16 Kinematic marker positions and ground reaction force data were used to calculate internal joint moments from an inverse dynamics model within the Visual 3D software. Moments were normalized to body mass and calculated so that internal flexion moments for the hip, knee, and ankle were represented by positive values.
The SPM analyses were used to assess joint angles and moments. The kinematic and kinetic time-series were interpolated to 101 data points (100% of cycle) using a custom MATLAB script (MathWorks, Natick, MA, USA). During the first second of each task, participants were asked to hold their position to achieve a quiet stance period. During this period, the standard deviation of hip flexion for the stance limb was calculated. The beginning of the task was identified when hip flexion of the stance limb exceeded a change at least 3 standard deviations from the waveform during the quiet stance period.16 The end of the task was defined as the point when hip flexion angle returned to that starting value. Center of mass (COM) vertical displacement was used to determine squat depth.17 This was calculated by normalizing each participants data to the highest vertical point of their COM within a given trial and resulted in a net vertical displacement in cm.
Statistical Analysis
A 2x3 repeated measures ANOVA was used to assess differences of TMR® scores between the preferred and non-preferred legs at Baseline, post-treatment (Post1), and 10-minutes post-treatment (Post2) in R (The R Foundation for Statistical Computing Platform, 2021). The significance level for statistical analyses of TMR® scores was set a priori to α ≤ 0.05. Significant main effects were followed up with post hoc t-tests and Bonferroni alpha corrections. Interactions were followed up with separate one-way ANOVAs for time on each leg and followed up with t-tests and Bonferroni corrections when the ANOVA indicated a difference. Additionally, the effect of leg at each time point was assessed with follow up paired t-tests and alpha corrections. Effect sizes were calculated for TMR® scores using partial eta squared values that were interpreted as small = 0.01), medium = 0.06), and large = 0.14), and Cohen’s d values were calculated for pairwise comparisons and interpreted as small (d = 0.2), medium (d = 0.5), and large (d = 0.8).18
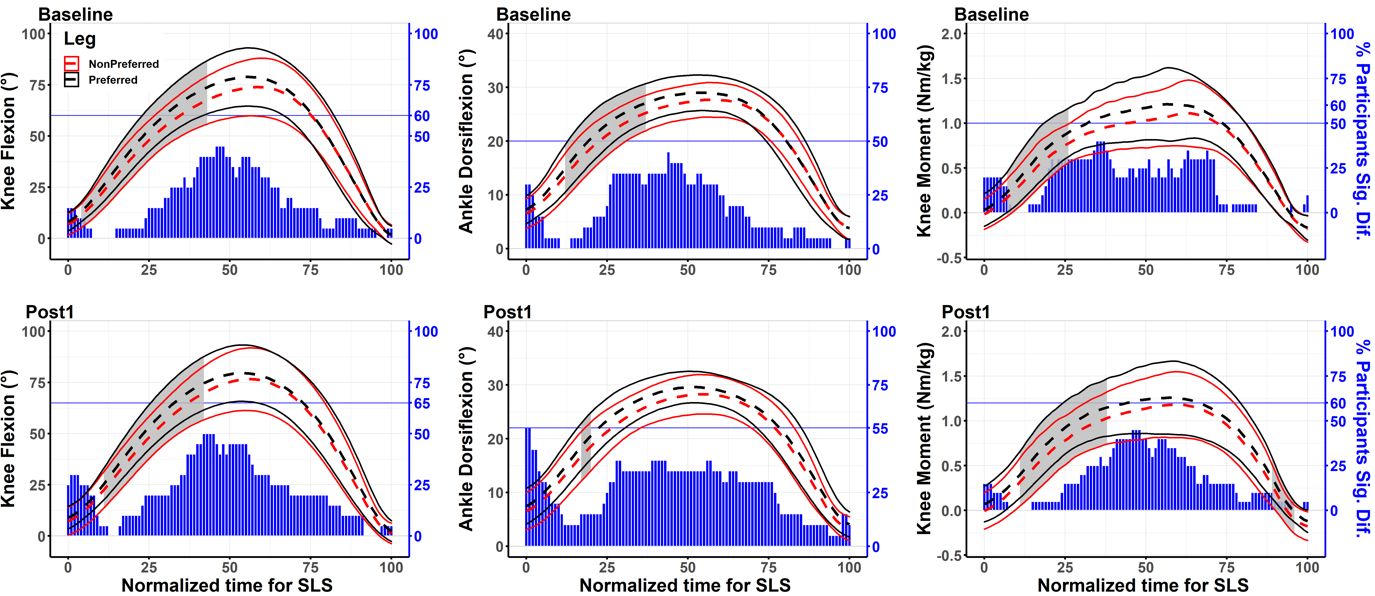
Separate 2x3 repeated measures ANOVAs were also used to compare kinetic and kinematic waveforms for the preferred and non-preferred limbs at each of the three time points using an open-source software package spm1D 0.4.19 Significant results from the repeated measures ANOVAs were followed up with post hoc t-tests as well as with single subject (SS) analyses. The significance level for all SPM tests was set a priori to α ≤ 0.05. For the SPM analyses, an alpha correction was not deemed appropriate because the procedure requires independence across the tests which is not the case with time-series data.20 Additionally, SPM analyses have been shown to reduce type I error associated with kinematic data.20,21 For group data, the participant’s mean values of the eight trials, for both the preferred and non-preferred legs, were calculated for each task and used for analysis. For the SS analyses, the eight trials were compared between the two legs for each task. When the participant’s statistical difference between legs crossed the critical threshold, the timing of this cross from 0-100% of the movement was recorded. If a cumulative 10% or more of the task reached statistical difference, the participant was classified as containing an asymmetry and reported as a percentage of the population. As some participants were found to have significant differences only during the first or last five percent of the trial, and these findings may lack clinical implications, the cutoff percentage of 10% was used to limit inflation for number of participants with significant differences between legs.
RESULTS
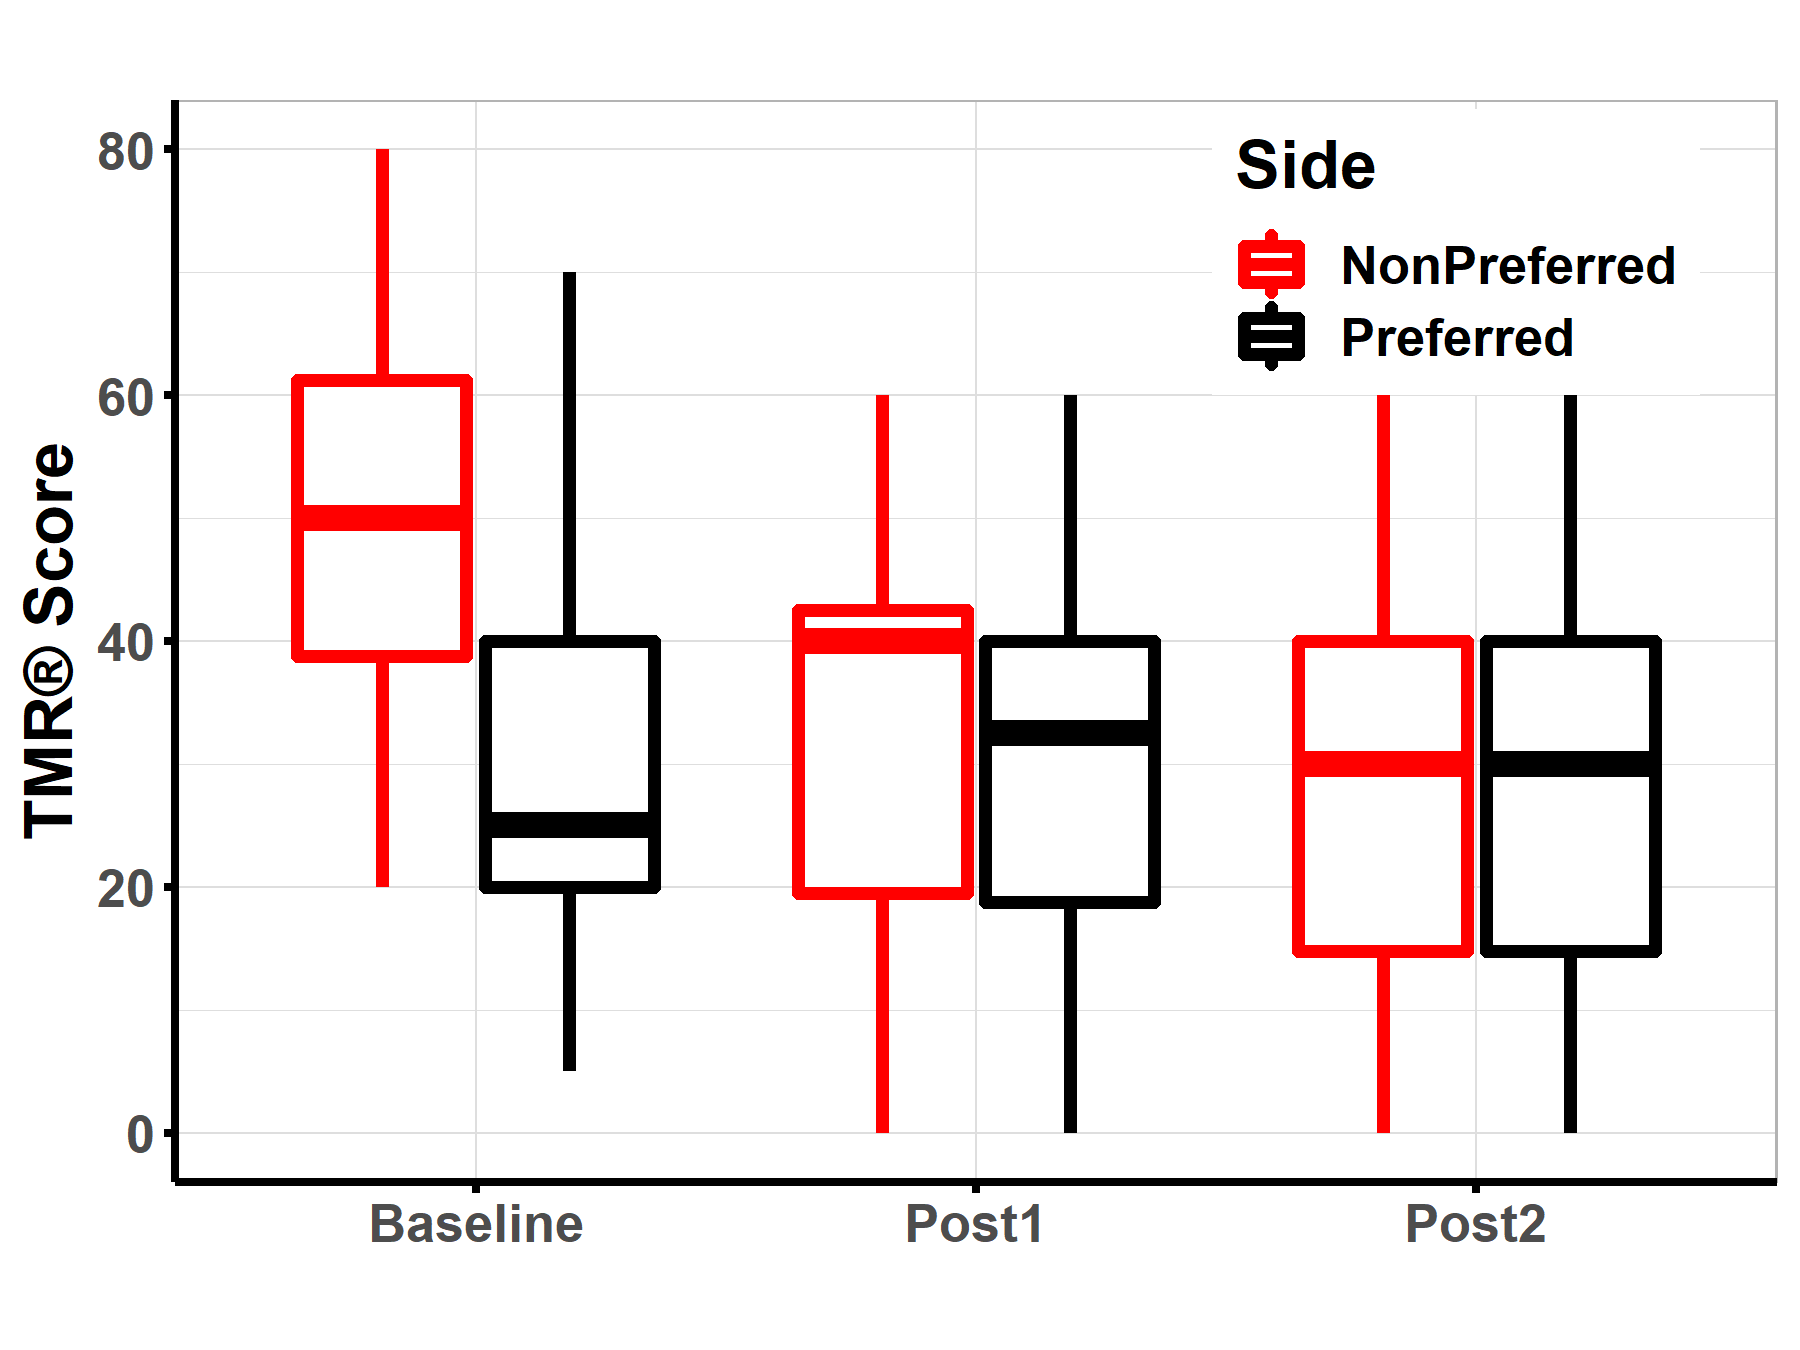
Of the 27 participants who were screened, 20 qualified for the study (10 female, 10 male; age = 24.1 ± 3.5 years; height = 173.8 ± 10.8 cm; mass = 72.0 ± 14.4 kg) with TMR® score imbalances ≥ 10 (non-preferred side scores = 50.2 ± 15.6, preferred side scores = 29.5 ± 17.2) during the SLS. When examining the frequency of self-reported symptoms and locations, 50% identified stability deficits, 40% of participants reported reduced ROM, 35% described tightness, 15% reported pain as an issue, and 10% noted weakness. In terms of location, the ankle was indicated as problematic by 45% of participants, the hip by 40%, the knee by 35%, and the thigh by 25%. Importantly, these percentages reflect the frequency of each symptom and region reported, but do not total 100% given that individual participants often reported multiple problematic symptoms across various regions (Table 1).
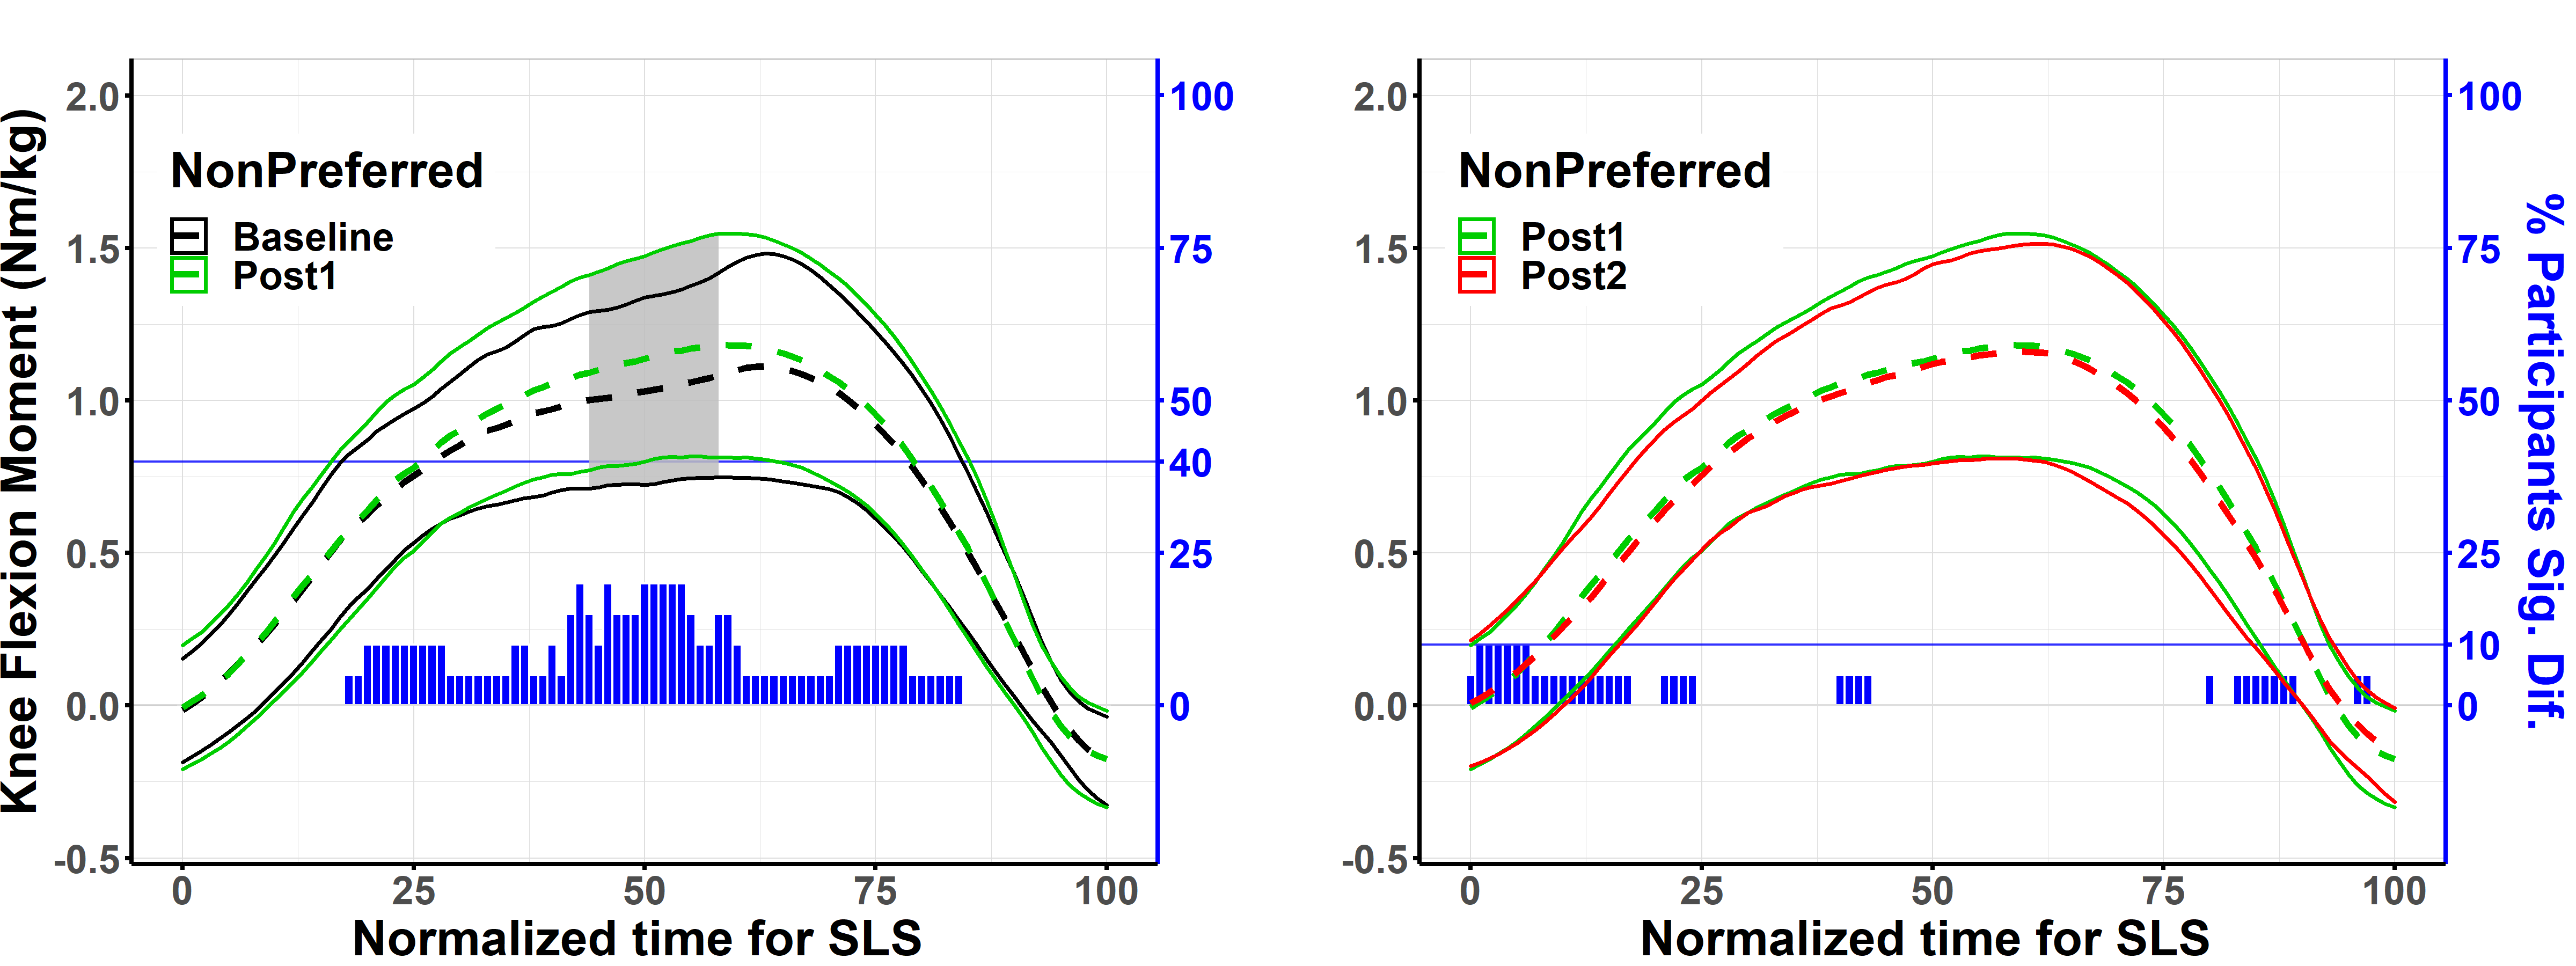
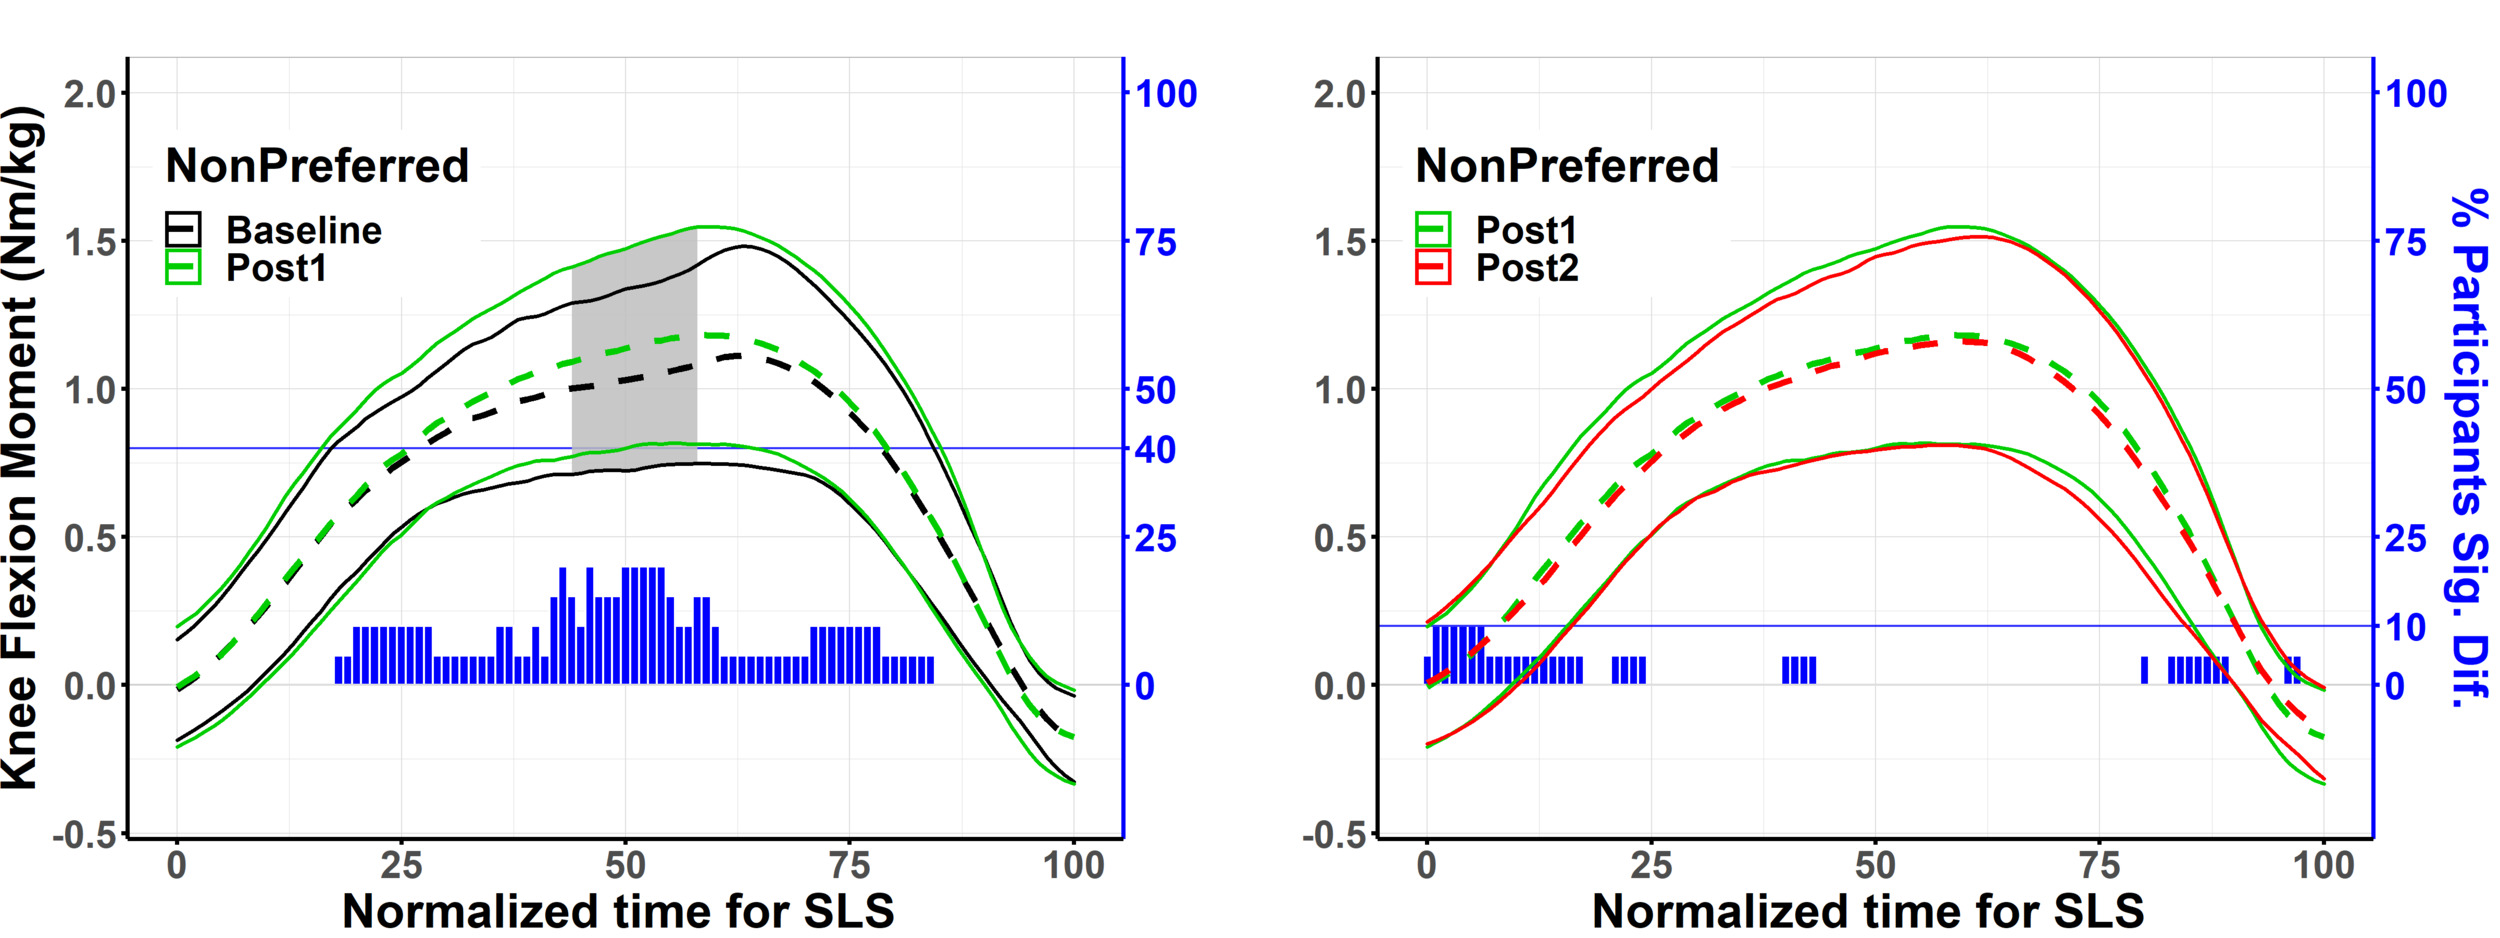
An interaction of leg and time (p < 0.01, = 0.05) was found for TMR® scores. The one-way ANOVA for the preferred leg found no effect of time on score (p = 0.91, = 0.00). A significant effect of time was found for the non-preferred leg (p < 0.01, = 0.19). Post hoc t-tests indicated that bilateral differences were present at baseline and Post1 for TMR® scores but not at Post2 (Table 2). Scores on the non-preferred leg were reduced after treatment and remained below baseline levels at Post2 (Table 2, Figure 3).

Significant main effects from the SPM analyses for kinematic and kinetic variables are reported in Table 3. Post hoc tests for time and leg are displayed in Table 4, and Table 5. The SPM statistical package does not report p-values that do not reach statistical significance. Increased knee flexion moments were found after the treatment at the group level as well as in 40% of individual participants (Figure 4). Bilateral differences were found for knee and ankle flexion, as well as knee flexion moments before and after the treatment at both the group and single subjects level (Figure 5).

DISCUSSION
This study included participants with bilateral TMR® score differences between preferred and non-preferred legs (Δ 20.7). Increased values were observed on the preferred leg for knee flexion, ankle flexion, and knee flexion moments (Figure 5) Overall, 75% of the sample had an asymmetry for at least one of the aforementioned variables. On the preferred leg, 83% percent of participants with a bilateral difference had increased knee flexion and 90% had increased ankle flexion and knee flexion moments. The current findings provide initial evidence that self-identified asymmetries with the TMR® scale for a SLS are related to deficits in knee flexion, ankle flexion, and knee flexion moments during a SLS. This is an important finding as bilateral differences can often be masked at the group level due to intraparticipant variability or defining limb dominance based on the leg used to kick a ball.22,23 Thus, the TMR® scale could be used as an effective instrument for identifying preferred and non-preferred legs during movement screen scenarios, or when assessing single leg weightbearing movement prior to developing return to sport protocols.
Following the intervention, the group analysis demonstrated statistically greater internal knee flexion moments on the non-preferred leg. However, this finding was largely driven by only 40% of participants who demonstrated increased knee flexion moments between Baseline and Post1 (Figure 4). Of those eight responders, seven also had reduced perceptions of dysfunction (average Δ Baseline-Post1 = 16.5), suggesting that improved TMR® scores are sensitive to changes in loading the knee during the SLS. Participants maintained this gain after the 10-minute rest period as there was no effect of time between Post1 and Post2 for internal knee flexion moments, and only 10% of participants were found to have a difference after the rest period (Figure 4). Clinicians should be cognizant of the potential for patients to not respond in this manner as less than half of the current sample demonstrated increased moments at the knee. However, as this protocol requires limited contribution from the non-preferred leg, mitigating the risk of exacerbating symptoms, TMR® could still be considered during rehabilitation protocols where patients are reluctant to perform SLSs on one side due to factors such as pain, tightness, limited ROM, etc.
The current findings are the first to indicate that performing one of the primary TMR® motions on the preferred leg can improve TMR® scores on the non-preferred leg (Figure 3). Prior studies8–11 have not reported these measures but have demonstrated the potential effectiveness of a TMR® intervention to increase ROM. The current study also found a statistically significant change in hip flexion following the SLS intervention (p = 0.03, 7-17% of SLS). However, this finding may not be clinically significant as there was only a 0.2° average increase in hip flexion. Additionally, of the six participants who had a bilateral difference (30% of the population), three increased hip flexion, and three had decreased hip flexion on the non-preferred leg immediately after the intervention. Although increased knee moments were observed and 55% of the participants had resolved TMR® scores following the intervention, squat depth did not increase, and bilateral differences were still present (Figure 4). Thus, improvements in TMR® scores may coincide with biomechanical changes at the knee but do not necessarily result in visually observable changes for clinical measures of movement.
The current findings are partially corroborated by a case-series24 that found a TMR® intervention resulted in clinically important differences in pain scores for patients experiencing AKP. The case-series24 also found that the functional measures of single leg weightbearing were unchanged after a TMR® intervention. A reduction in self-identified factors of dysfunction with no visually observable changes for SLS mechanics has not been limited to the TMR® paradigm. For example, investigations into different taping techniques25,26 intended to improve AKP have found that symptoms were reduced following the tape application but did not impact SLS kinematics. A reduction of pain during the SLS has been attributed to changes in quadriceps muscle activation25; however, pain effects beyond biomechanical explanations (i.e., placebos) should also be considered as an explanation. The potential of interventions such as TMR® or taping to improve symptoms during a SLS could be useful during rehabilitation but clinicians may want to supplement these interventions with longer-term training protocols that have been found to improve kinematic variables.12,27 For example Hale et al.12 found four weeks of balance training performed solely on the uninjured ankle improved motor control in the injured ankle of those with chronic ankle instability.
Although bilateral differences were identified by using the TMR® scale, the importance of the biomechanical bilateral differences during a SLS is disputed.25 A longitudinal study found that practitioner rated bilateral differences in the frontal plane at 90° of knee flexion did not predict future non-contact anterior cruciate ligament injury.28 However, by not including potential differences for sagittal plane asymmetries of the lower extremity, longitudinal studies may limit potential findings as it relates to injury risk. Longitudinal studies for bilateral differences have also neglected to include a SS approach for the identification of asymmetries25 or focused on the leg used to kick a ball.26 As leg dominance has been found to be task specific,26,27 and bilateral kinematic differences can be masked at the group level,27 the inclusion of a SS approach is necessary to fully understand the importance of injury risk as it relates to movement symmetry. Additionally, investigators should consider the potential of the bilateral movement imbalances found in the current study to coincide with more functional movements such as walking and running, subsequently identifying whether these potential imbalances elicit chronic lower extremity injuries due to a decreased ability to load the non-preferred leg. As the TMR® screen for the SLS can be performed in a few minutes, its use as an instrument to track injury risk from bilateral asymmetries may be warranted.
The current study has limitations. First, the current study assessed participants with a heterogeneous symptom profile (i.e., stability, tightness, pain, etc.) at various points of the lower extremity (i.e., ankle, knee, thigh, and hip) that could have produced distinct compensatory movement strategies during the SLS. However, the inclusion of a single subject analysis provides more detailed insight into individual responses that helps compensate for the lack of a homogeneous sample. Next, only one movement from the six primary TMR® motions for movement assessment was included. As TMR® is often thought to identify regional imbalances throughout the body that may be connected,7 only assessing one of these movements may have missed the root cause of the dysfunction and limited the effectiveness of the treatment. However, as the core foundation of the treatment is to use movement on one side of the body to improve movement on the other, it is essential to establish the efficacy of this fundamental concept for the paradigm. The current study’s protocol also differed from the TMR® protocol in the number of sets and repetitions (2x15-20) that are typically performed prior to reassessing the TMR® score.7,8 Per the TMR® protocol, if an observed improvement (score decreased by ≥ 10) is not found after the first reassessment, a change is made to the treatment that could increase the intensity (e.g., performing the repetitions faster).7 Thus, a lack of treatment dosage and omitting changes to the treatment protocol may have influenced the outcomes of this study, and is a factor that could be considered in future studies examining the effects of TMR®. Self-reported scores are also a potential source of bias that could have influenced the results for perceived asymmetry. Specifically, a response bias could have led participants to unconsciously minimize or downplay dysfunction in order to appear more symmetrical, which they may have believed was more desirable or expected by the researchers. The methods were designed to limit this bias by not informing participants about the proposed mechanism of the treatment until after the completion of the study. Lastly, the observed decrease in TMR® scores is less than what has been reported as a minimal detectable change (MDC) of 26.1 pints using the TMR® scale for the SLS.7 This may not directly translate to the current results though, as the reliability study that established the MDC did not assess scores before and after a TMR® treatment.
CONCLUSION
The results of this study indicate that participants with bilateral differences of 10 points or greater per the TMR® assessment for the SLS were also found to have biomechanical asymmetries at the knee and ankle. Performing sets of the SLS on the preferred leg was found to reduce perceptions of symptoms related to pain, tightness, and stability on the contralateral leg and enable small but statistically increased knee flexion moments. However, reducing the perception of symptoms did not resolve movement symmetry. Clinicians should be cautious about relying solely on improvements in patient perception when applying TMR® and consider supplementing this method with targeted interventions to address observable movement deficits.