INTRODUCTION
Hopping and jumping movements are frequently completed in cutting and pivoting sports and are commonly used to measure performance in clinical and field settings.1 Measuring multi-joint lower limb movements common in sports is considered an essential marker of rehabilitation and recovery following lower extremity injuries. For example, hop and jump tests are a common component of return-to-sport test batteries following anterior cruciate ligament (ACL) reconstruction. Such tests have been used as a screening assessment to determine those who may be at risk for reinjury.2–4 However, single-legged hop tests are not strongly associated with self-reported knee function and the ability to return to sport after ACL reconstruction.5 Thus, measuring the most basic characteristics of hop tests, such as hop distance, may be inadequate to detect underlying deficits in lower extremity function and performance. For example, patients that can hop at least 90% as far after ACL reconstruction, compared to the uninjured limb, still demonstrate significant kinematic and kinetic differences between limbs.6
Previous studies investigating more detailed characteristics of single-legged and vertical jumping have used force plates.6 Force plates, however, are expensive and typically housed within laboratory settings that require trained personnel to operate. Clinical measurements of single-legged hop tests for distance are typically measured using a tape measure,7,8 while hop testing for time, such as the 6m timed hop test, typically relies on the use of a stopwatch.8,9 Although common practice in many clinical settings, these hop test measurement tools do not allow for analysis of individual hop characteristics, such as time spent in flight compared to on the ground. In recent years, instrumented pressure mats have emerged as cost-effective and portable devices that can be used in a field or clinical setting to measure human movement. However, their use has been predominantly focused on measuring walking.10–12 The measurement of ST variables using an instrumented pressure walkway during performance-based measurements such as jumping and hopping have not been reported.
The first aim of this study was to determine the test-retest reliability of ST variables during hopping and jumping measured using an instrumented pressure walkway. Single-legged hop tests included the single and triple hop for distance and the 6m timed hop. The jump test measured was the bilateral drop vertical jump. The authors hypothesized that there would be excellent test-retest reliability of ST variables measured during these hop and jump tests. The second aim of this study was to determine the level of agreement between a) the time measured by the pressure walkway compared to infrared timing gates during the 6m timed hop and b) the jump height during the bilateral drop vertical jump measured by the pressure walkway compared to a three-dimensional motion capture system. The authors hypothesized that there would be a high level of agreement for a) 6m hop time between the pressure walkway and timing gates and b) jump height between the pressure walkway and motion capture system.
METHODS
Thirty-eight participants were recruited for this study and completed baseline testing (T1). Twenty-one of the 38 participants returned to repeat testing for the test-retest reliability portion of this study. Participants were included for participation if they were between 19-35 years old and participated in at least 50 hours per year of cutting or pivoting activities.13 Participants were excluded if they had hip, knee, or ankle pain or surgery within the prior six months, a history of balance or neurological disorders, or were currently pregnant. This study was approved by the University of Nebraska Medical Center’s Institutional Review Board, and all participants provided written informed consent prior to participation in the study.
Instrumentation
All hop and jump testing was performed on a portable, instrumented pressure walkway (Protokinetics Zeno Walkway System, Havertown, Pennsylvania, USA). The Zeno Walkway used in this study had a sensor resolution of 0.5 in2, a sensor area of 2 feet by 20 feet, and a sampling rate of 120 Hz. At 120 Hz, the fastest discernable hop time the walkway is capable of capturing is 0.017 seconds, which is much faster than expected hop times.14
Hop and Jump Measurements
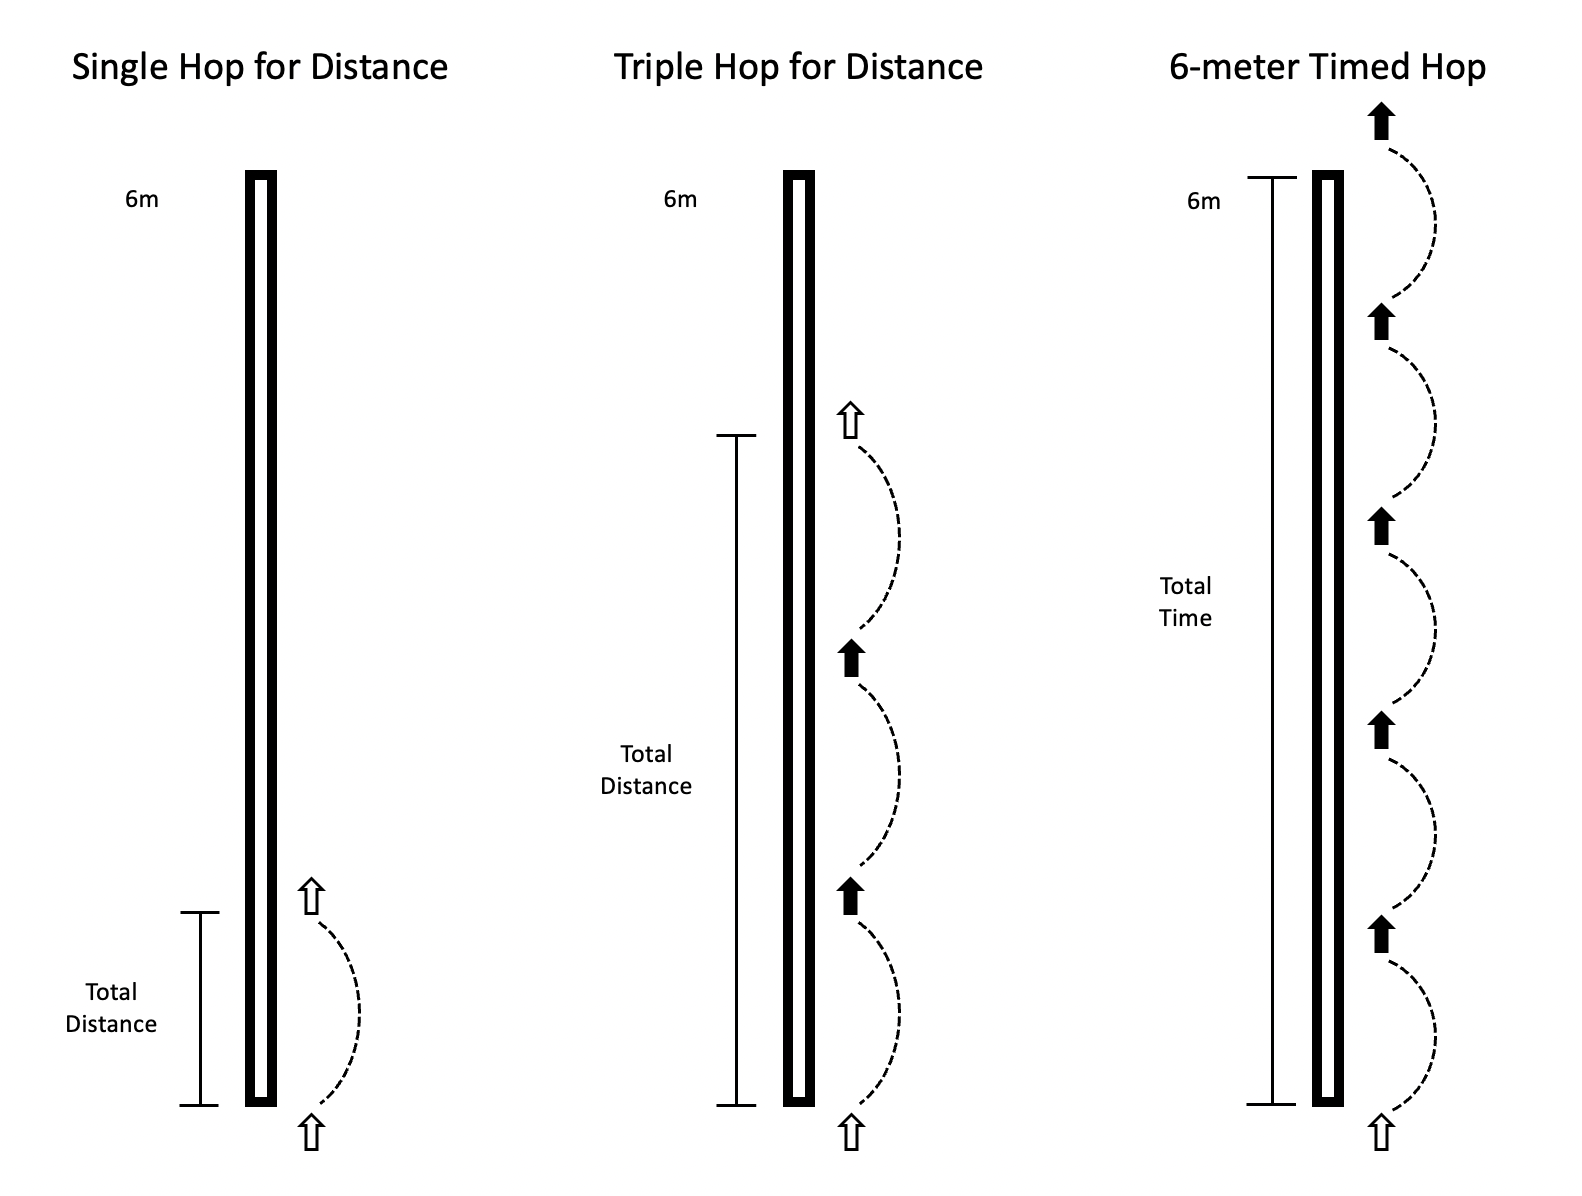
Participants completed the single hop for distance, triple hop for distance, and 6m timed hop on the instrumented pressure walkway, in this respective order (Figure 1). Participants completed up to two practice trials for each of the three hop tests and were allowed 30 seconds of rest in between all trials to reduce fatigue. All single-legged hop tests started with two valid trials on the right leg, followed by two valid trials on the left leg using the same procedure.

Single and Triple Hop for Distance
The single hop for distance began with the participant’s foot on the walkway and their toes behind a taped line at the beginning of the walkway. The participant finished the hop on the same foot, without placing the contralateral foot on the walkway. The participant was instructed to begin each trial by lifting the contralateral foot off the walkway and maintain their balance, followed by a forward hop to the furthest possible distance to which the participant was able to complete a stable landing for two seconds, before placing the contralateral foot on the walkway. Variables of interest for the single hop for distance included flight time and distance. Distance was measured in ProtoKinetics Movement Analysis Software (PKMAS) from the starting toe position of the foot to the ending heel position of the foot.
The triple hop for distance consisted of the participant beginning with their toes behind a taped line at the beginning of the walkway. The participant then performed three consecutive forward hops on the same limb. If at any time the contralateral foot touched the walkway, that trial became invalid. For the triple hop for distance, variables of interest included average flight time, average stance time, and total distance. Like single hop, distance was measured in PKMAS from the starting toe position of the foot to the ending heel position of the foot at the final landing.
6-Meter Timed Hop
The 6m timed hop consisted of the participant beginning with their toes behind a taped line at the beginning of the walkway. The participant then hopped forward as fast as possible for 6 meters, without placing the contralateral foot on the walkway. The pressure walkway and a 40-inch tall timing gate system (Brower Timing, TCi Timing System, Draper, Utah, USA) were used to collect 6m timed hop data. Total hop time was measured using the timing gate system integrated with a switch placed under the heel and a pair of timing gates placed 6 meters from the beginning taped line. Time started when the participant’s heel lifted off the switch and ended once the participant’s torso crossed the timing gates at the 6m line.
Walkway variables of interest included average flight time, average stance time, average hop distance, and total time required to complete each 6m hop trial. Total time to complete the 6m timed hop using the pressure walkway was calculated by extrapolating the average hop speed from the first to last footfall (Equation 1). Average hop speed was calculated using PKMAS-calculated 1) measured distance (MD) from the beginning toe position to the toe position of the final footfall before the 6m mark and 2) time from when the foot first departed the walkway until the time of the final footfall before the 6m mark. Because the distance to the last footfall was less than 6 meters, this equation allowed estimation of time over a full 6m length.
Equation 1. Total time (s) = MT / (MD/6 meters)
MT = Measured time from the beginning of the trial to final footfall (s)
MD = Measured distance from the start of the trial to final footfall (m)
Bilateral Drop Vertical Jumps
Prior to drop vertical jump trials, a single, 14 mm retroreflective marker was placed at the most anterior portion of each shoe (toe) and posteriorly on each shoe at the heel. Target marker data was measured using an 8-camera motion capture system (Qualisys AB, Gothenburg, Sweden) sampled at 240 Hz, during bilateral drop vertical jump testing.
Participants performed bilateral drop vertical jumps from a box with a height of 31 cm. The box was positioned such that the participant could drop straight down onto the walkway. Participants were instructed to step off the box with whichever foot they preferred, eyes open, and hands on their hips. They were further instructed to land with both feet simultaneously, followed immediately by a maximum vertical jump, ending with both feet landing back onto the walkway in accordance with previously recorded methods.15 Participants were allowed two practice trials to familiarize themselves with the movement, followed by five valid trials that were recorded. A valid trial required the participant to complete both landings without loss of balance.
Variable of interest for drop vertical jump included the flight time of the vertical jump as measured by the pressure walkway, which was used to calculate vertical jump height using Equation 2. Flight time (FT) was defined as the duration of time the pressure walkway detected no pressure – corresponding to the time the participant spent in the air between the first and second landing. The pressure walkway-derived vertical jump height was then compared to the height measured by the motion capture system. Target marker data were post-processed in Visual3D software (C-Motion, Inc., Bethesda, Maryland, USA). Target data were low-pass filtered using a second-order Butterworth filter with a cut-off frequency of 15 Hz. Maximum jump height was defined by the vertical distance between a heel marker at toe-off of the first landing and the maximum vertical height of the heel marker while the participant was in the air before the second landing. The heel marker on the foot that achieved the lowest maximum height was used for analysis.
Equation 2. Height (m) = 1/8 * g * (FT)2
g = Acceleration due to gravity (9.81 m/s2)
FT = Flight time (s)
Second Testing Session
For the 21 participants completing the second testing session (T2), all movements were completed in the same order using the same protocol and procedures as the first testing session. Participants completed the second testing session between 24 hours to 14 days after the first session.
Statistical Analysis
A random number generator was used to determine whether pressure walkway data from the right leg or left leg was used in the statistical analysis for each participant. Analyses were performed using SPSS 26 (IBM, Armonk, New York, USA). Intraclass correlation coefficients (ICC(3,k); two-way mixed, reliability) were used to determine test-retest reliability of ST variables during single-legged hop tests across the two separate testing sessions. Standard error (SE) was estimated as: SE = SD x where SD is the pooled standard deviation of the measurements for all the participants. Minimal detectable change (MDC) values were calculated at a 95% confidence level for each ST variable (MDC95 = SE x 1.96 x For each hop type, MDC95 was also normalized by the mean hop distance.16 This provides a more clinically useful MDC as a percentage of a patient’s hop distance. An ICC value greater than 0.90 is defined as excellent, 0.75-0.90 is defined as good, 0.50-0.75 is defined as moderate, and less than 0.50 is defined as poor reliability.17 The level of agreement for the ST variables of the hop tests were assessed using Bland-Altman plots (GraphPad Prism 8.2.0 San Diego, California, USA). Limits of agreement (LoA) were set at ±2 MDC values.18 Pearson correlations were used to assess the correlation between the 6m hop time (using the pressure walkway compared to the timing gates) and maximum vertical jump height during the bilateral drop vertical jump (using the pressure walkway compared to motion capture) from the first testing session. A p-value of <0.05 was set for all analyses a priori.
RESULTS
Descriptive data for participants is presented in Table 1. A greater proportion of females participated in the study (55.3%), and a greater proportion of right legs were randomly selected for statistical analysis (52.6%). On average, participants had a normal BMI, 24.3 kg/m2.
Single and Triple Hop for Distance
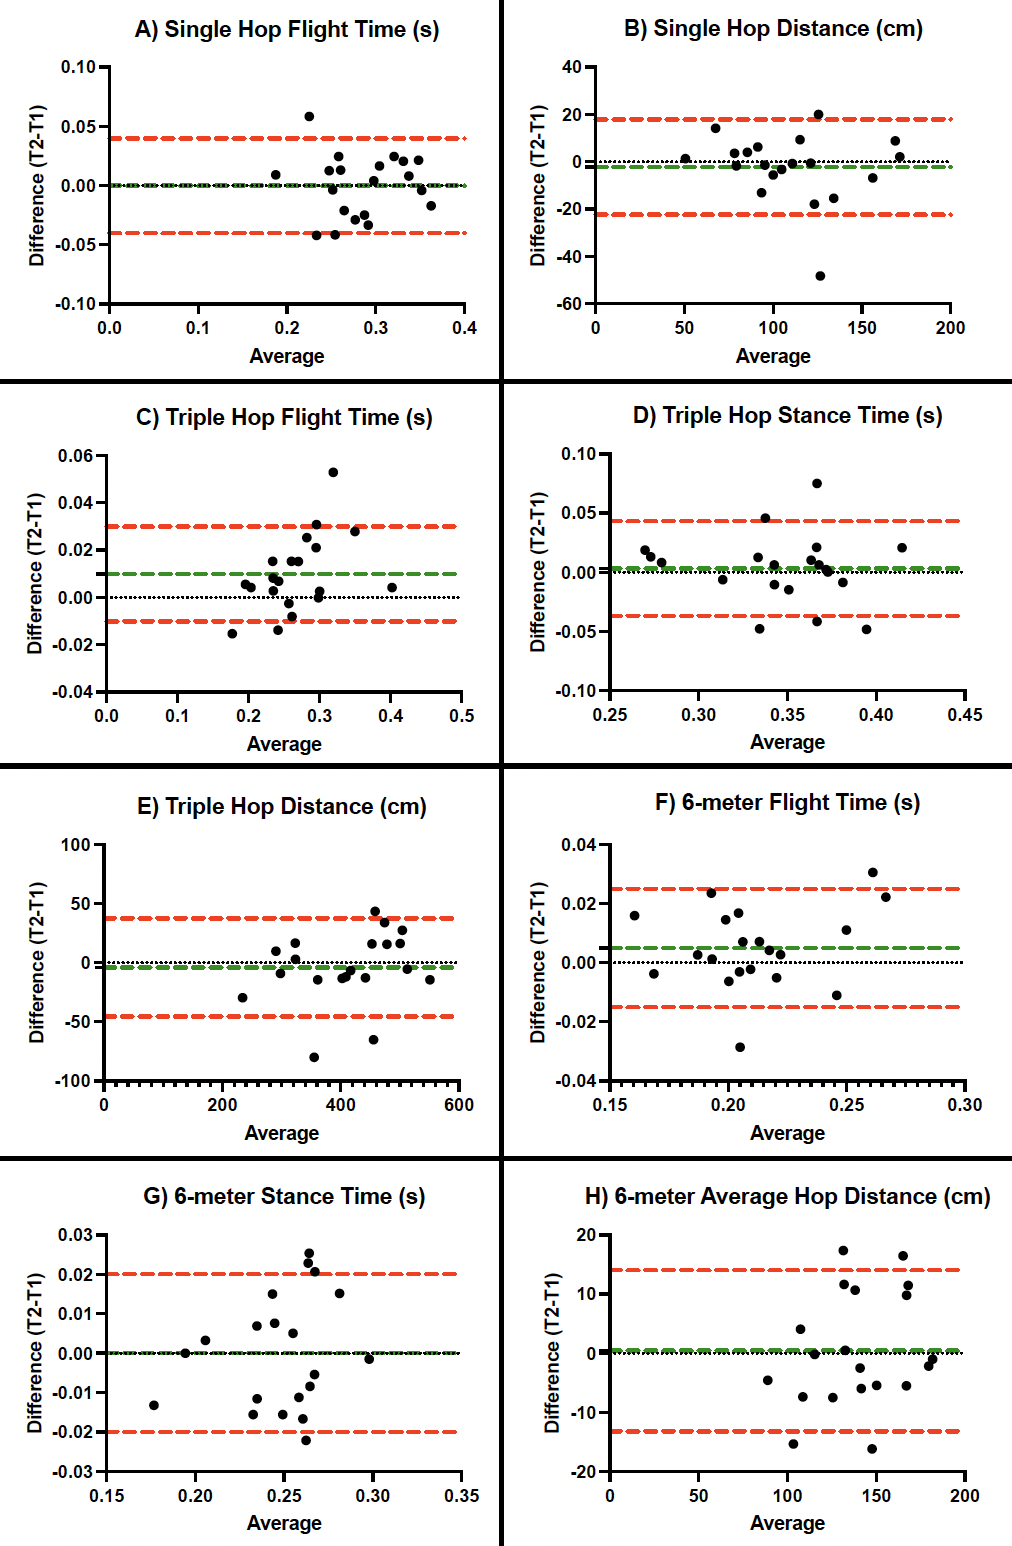
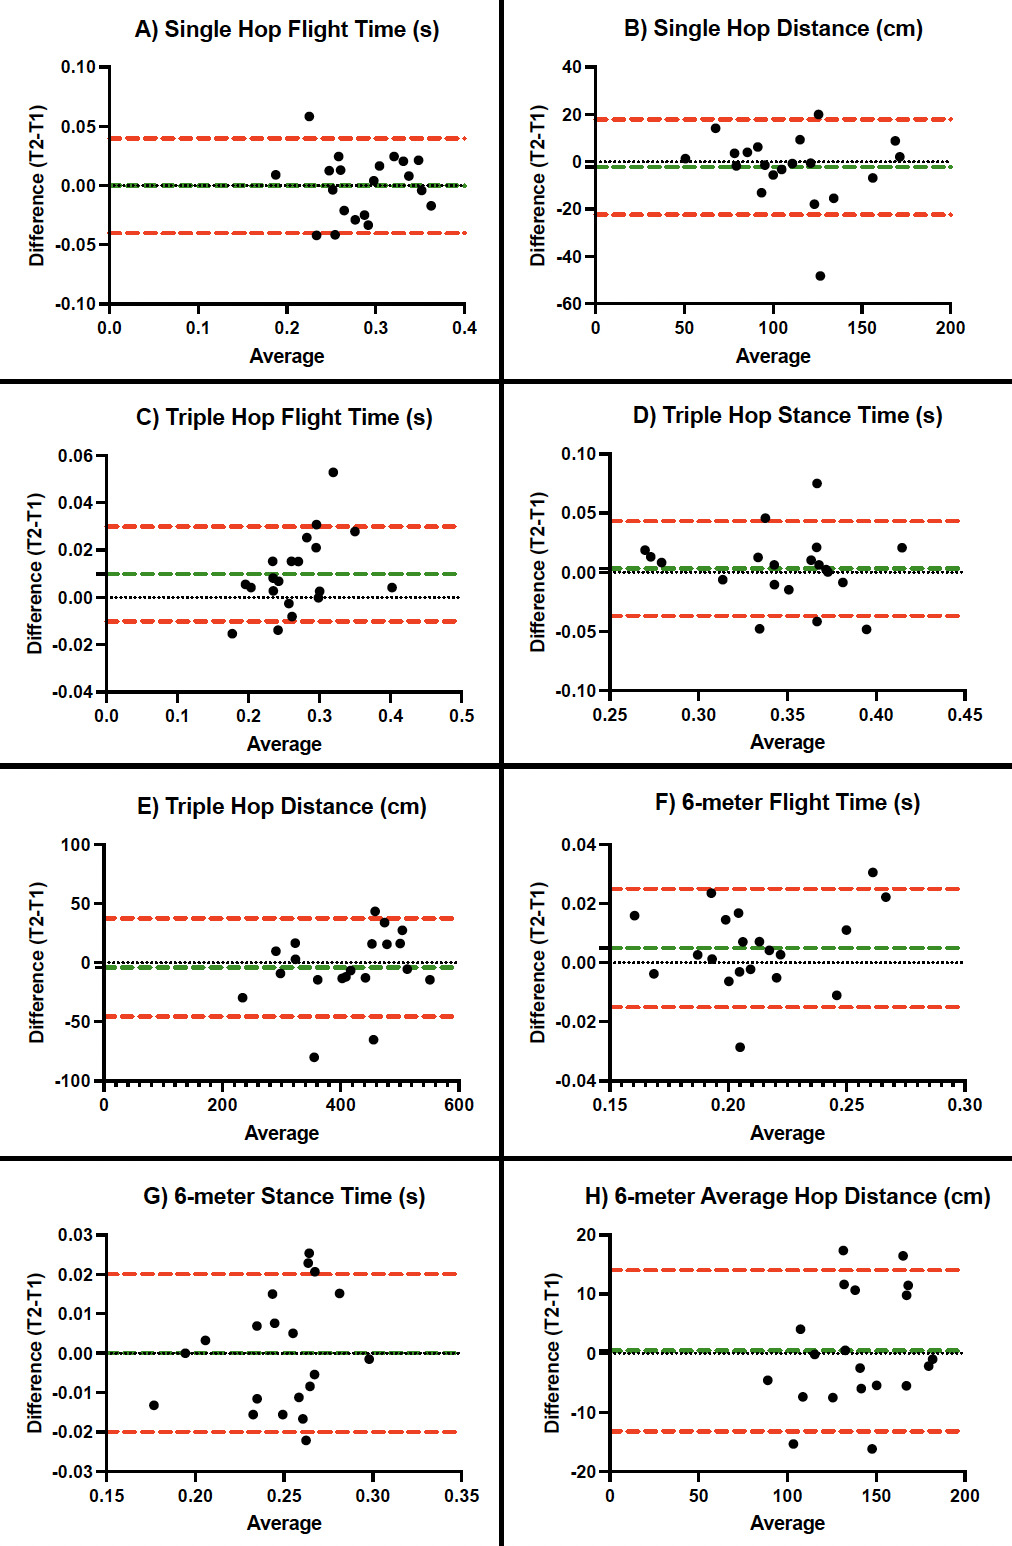
Descriptive statistics, reliability coefficients, and MDCs are reported in Table 2 for ST variables during single and triple hops for distance. The instrumented pressure walkway showed good to excellent test-retest reliability during single hops (ICCs 0.929-0.952) and triple hops (ICCs 0.860-0.958) for all ST variables. One participant was not included in triple hop analyses due to measurement error. Bland-Altman plots for ST variables of single and triple hop for distance tests are presented in Figure 2.

Six-Meter Timed Hop
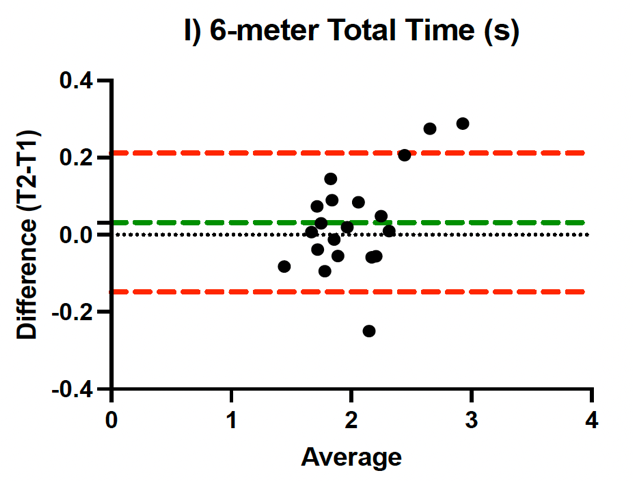
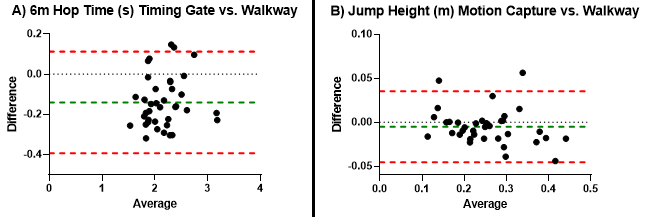
Descriptive statistics, reliability coefficients, and MDCs are reported in Table 3 for ST variables during 6m timed hop. The instrumented pressure walkway showed excellent test-retest reliability during 6m hops (ICCs 0.939-0.972) for all ST variables. The 6m hop time measured by the instrumented walkway during the first testing session =2.092, SD=0.380) was strongly correlated with the infrared timing gates =2.226, SD=0.369) (p<0.001, r=0.953) and differences between the measurement methods are demonstrated in a Bland-Altman plot in Figure 3. Bland-Altman plots for ST variables of 6m timed hop tests are also presented in Figure 2.

Bilateral Drop Jumps
Maximum vertical jump height, as calculated from flight time, during bilateral drop jumps on the instrumented pressure walkway during the first testing session =0.248, SD=0.081) was strongly correlated with the maximum vertical jump height as measured by the Qualisys motion capture system =0.256, SD=0.086) (p<0.001, r=0.907). A Bland-Altman plot depicting the differences between the measurement methods is presented in Figure 3.
DISCUSSION
The purpose of this study was to determine the test-retest reliability and MDC values of ST variables during single-legged hop tests using a Zeno instrumented pressure walkway. The authors also aimed to validate the time measured by the walkway during the 6m timed hop and jump height during a bilateral drop vertical jump. The findings supported the primary hypothesis, showing that test-retest reliability for all spatial and temporal variables for hop tests were good or excellent using the instrumented pressure walkway (ICCs≥0.86). Furthermore, the secondary hypothesis was supported, as the data showed a strong correlation (r=0.953) between the total time during the 6m timed hop measured by the walkway compared to the timing gates. Additionally, the tertiary hypothesis was supported, as the data indicated a strong correlation (r=0.907) between the maximum vertical jump height measured by the pressure walkway compared to the three-dimensional motion capture system. To the authors’ knowledge, this is the first study that has analyzed various ST variables during single-legged hop tests and bilateral drop vertical jumps in young, active individuals using an instrumented pressure walkway.
Recent research has highlighted the value of measuring other ST variables beyond that of total distance and time during single-legged hop tests. For example, Lloyd and colleagues measured reactive strength ratios, which is the ratio of stance time to flight time in a population of male professional soccer players at 36 weeks after ACL reconstruction.19 Even while 80% of athletes tested passed the 90% leg symmetry index (LSI) for total hop distance during triple hop, only 35% and 45% passed the LSI threshold for reactive strength ratios during their first and second hop, respectively. Such conclusions highlight the value of collecting alternative ST variables beyond traditional total hop distance and time.
Past research by Reid et al. published MDC values for LSIs of the single, triple, and 6m hops at the 90% confidence level for a population of similar age but after ACLR. Their results noted MDC values of 8.1%, 10.0%, and 13.0%, respectively.7 When converting the current data to a 90% confidence level, our MDC results were slightly higher compared to Reid et al. for single and triple hop at 14.9% and 13.0%, respectively, but lower for the 6m hop at 9.4%. Additionally, Dingenen et al. reported MDC values normalized to total hop distance of 10.4% and 7.2% for single and triple hop, respectively.16 The corresponding single and triple hop normalized MDC values from the current study were higher at 17.8% and 15.5%, respectively. The differences in normalized MDC values are likely due to differences in participant demographics.
Similarly, recent research by Ahmadian et al. analyzed the accuracy and precision of ST variables during the triple hop test using wearable inertial measurement units in a population of 11 to 19-year-old individuals who sustained a knee injury within the prior 15 months.19 Results found accurate and precise total hop distances when compared to the clinical standard tape measure. One limitation noted in this study was the validation of temporal variables, which did not use the gold standard force plates. The current study testing procedures overcomes this limitation with the use of the instrumented pressure walkway. Both inertial measurement units and instrumented pressure walkways provide an emerging alternative for a more in-depth analysis of ST variables during single-legged hop tests.
This study was limited by the width of the pressure walkway, which did not allow for the safe collection of the crossover hop test for distance. In addition, the walkway would occasionally slide forward ≤ 1 cm upon the participant landing, specifically during triple hop tests when forward momentum was greater.
CONCLUSION
The test-retest reliability was good to excellent (all ICCs>0.86), with small MDC values for all ST variables measured by an instrumented pressure walkway during single-legged hop tests. The walkway also accurately measured six-meter hop time and vertical jump height during a bilateral drop vertical jump. An instrumented pressure walkway is a novel tool able to reliably assess non-traditional, clinically relevant hop and jump test parameters such as flight time, stance time, and jump height in a young, uninjured population, and may be useful after lower extremity injury, surgery, and rehabilitation.
Conflicts of interest
The authors report no conflicts of interest.
Funding
This work was supported by the Nebraska Bankers Association and the University of Nebraska Medical Center. The funding sources were not involved in study design, data collection, analysis, interpretation, manuscript writing, or decision to submit the article for publication.