
INTRODUCTION
Dynamic postural control (DPC) describes an individual’s ability to maintain their balance within their base of support in both anticipatory and reactive balance situations.1 It can identify deficits, at-risk individuals, and inform prevention strategies. Position, velocity, and acceleration of the center of mass (COM) or center of pressure (COP) can be used as objective laboratory assessments of DPC. Yu and colleagues2 highlighted COM acceleration as a convenient measure of postural control, while Masani and colleagues3 demonstrated that COP velocity most accurately reflects the acceleration of COM. These studies collectively support the use of COP velocity to describe balance abilities during DPC assessments. COP velocity has successfully differentiated between static balance abilities of male non-athletes and similarly aged male soccer athletes who had lower COP velocities, suggesting greater balance control.4
Common standardized DPC assessments for healthy active adults include the modified Star Excursion Balance Test (MSEBT) and the Y-Balance Test of the Lower Quarter (YBT). Both tests have been used to measure dynamic balance in athletes and healthy active adults, but the outcomes of the tests are not equivalent.5–8 A modification of the YBT, the Modified Y-Balance Test (MYBT), has also been evaluated to determine if centralizing the location of input on the YBT reach indicator would create more consistent outcomes between the MSEBT and YBT.9 Findings from that study revealed similar reach distance outcomes between the YBT and MYBT, but not between the YBT/MYBT and the MSEBT. It was proposed this discrepancy may have been due to the MSEBT’s use of a feedforward motor control strategy due to the lack of a reach indicator, while the YBT and MYBT used a feedback strategy due to the sensory input received from the reach indicator during testing.6,9
It is clear that reach distances vary between the YBT/MYBT and MSEBT, yet there is still a need for further clarity regarding the reason for these differences. If there is merit to the supposition that continuous feedback from the reach indicator is responsible for the increase in reach distances during performance of the YBT/MYBT, it follows that the reach indicator enhances DPC, which may or may not be desired by the examiner. If DPC is enhanced, one would expect to see slower COP velocities during performance of the YBT/MYBT when compared to the MSEBT. Therefore, the purpose of this study was to explore DPC during performance of the MSEBT, the YBT, and a modified version of the YBT, the MYBT. The directional hypothesis stated that COP velocities recorded during the YBT and MYBT would be slower than those recorded during the MSEBT due to the presence of the reach indicator as a feedback mechanism.
This was a multivariate cross-sectional study that evaluated the differences between COP velocities in multiple planes between three tests (e.g., YBT, MYBT, and MSEBT) and in three reach directions (e.g., anterior [AN], posteromedial [PM], and posterolateral [PL]).
MATERIALS AND METHODS
Approval was obtained from the university’s Institutional Review Board (IRB) prior to participant recruitment. A convenience sample of 21 participants was recruited from a pool of healthy, young individuals from the university population. Participants were included if they were healthy adults aged 18-35 years with no history of lower extremity injuries in the previous six months or diagnosed neurological or balance disorders. Participants were excluded from the study if any of the following were present: lower extremity amputation, history of lower extremity fracture, vestibular disorders, undergoing current treatment for inner ear/sinus/upper respiratory infection, concussion within the prior three months, past medical history of surgery for a lower extremity injury within the prior six months, currently pregnant or think they may be pregnant, or medically prohibited from participating in physical activities. Before engaging in data collection, participants read a description of the study, were offered an opportunity to ask questions, and signed a consent form. YBT, MSEBT, and MYBT reach performance data from participants in this study have been published previously,9 but COP data have not been included in any other published manuscript.
Each participant was oriented to the balance tests, bilateral lower extremity leg lengths were measured for normalizing reach outcomes, three practice trials of each assessment were performed, and a two-minute rest period was taken before formal testing. The order of the three balance tests was randomized to minimize the impact of fatigue and learning effect. Each test was scored by the same researcher who was certified to administer the YBT through Functional Movement Systems™ (Danville, VA). Prior researchers have demonstrated good to excellent intra-rater reliability (0.85-0.91)10 when the YBT was performed by trained examiners.
Participants completed all three balance tests during a single testing session. Performances were normalized using leg length, and three trials of each reach direction – AN, PM, and PL – were recorded on each lower extremity. All testing was performed barefoot and with the YBT stance plate on a single force plate (AMTI, Inc., Watertown, MA. USA). COP velocities for frontal plane (medial-lateral) and sagittal plane (anterior-posterior) directions were sampled at 1200 Hz and filtered with a low pass Butterworth filter at 12 Hz.
Y-Balance Test
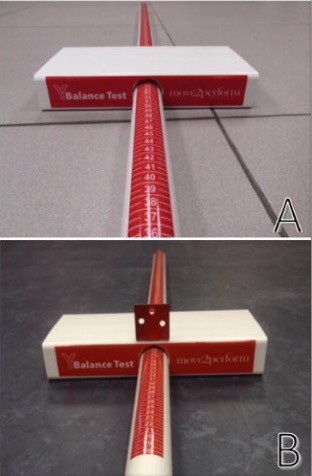
Per the YBT protocol, participants were instructed to begin by standing on the right leg with the foot centered on the stance plate and toes behind a pre-set line, and to push the reach indicator in the red target area toward the direction being tested (Figure 1a). Participants were instructed to place their hands on their hips and maintain the heel of the stance leg in contact with the stance plate while performing each reach. Reach distance was measured at the trailing edge of the reach indicator to the nearest centimeter. Trials were discarded and repeated if the participant’s reach foot touched the floor or kicked the reach indicator, if the stance heel was lifted from the stance plate, or the participant failed to return to the start position in a controlled manner.
_ybt_and_(b)_mybt.jpg)
Modified Y-Balance Test
In contrast to the YBT, during the MYBT, participants pushed the reach indicator by using an additional fabricated tab that was centered on the superior surface of the reach indicator and aligned with its trailing edge. The fabricated tab (Figure 1b) was attached to the top of the reach indicator such that the reach foot was centered over the reach indicator and was effectively reaching at the level of the stance foot and at the midline of each reach direction, which is spatially more similar to the MSEBT. Trials were considered invalid for the same reasons listed for the YBT.
Modified Star Excursion Balance Test
To perform the MSEBT, the participants stood on the YBT stance plate and followed the same protocol as the YBT but did not slide a reach indicator. Instead of pushing the reach indicator, participants reached out and lightly touched the YBT frame with the reach foot in each of the three testing directions. Performance of the MSEBT on the YBT frame was deemed necessary to minimize the effect of perceptual differences associated with standing on a raised surface versus the floor. The distances were recorded using the same measuring system as the YBT. Trials were deemed invalid for the same reasons as listed for the YBT.
Prior to conducting this study, an a priori power analysis was conducted to determine the necessary sample size using G*Power 3.1 (© 2010-2019 Heinrich Heine Universität Düsseldorf). Calculations indicated that a sample size of 21 was necessary to achieve 80% power. COP velocities were unsigned to appreciate magnitude from each axis as a positive number, regardless of direction. Average COP velocities were calculated for the frontal plane (COPx), the sagittal plane (COPy), and the resultant of these two planes (COPr). A 3-way analysis of variance (ANOVA) was used to determine differences between COP velocities across tests (YBT, MYBT, SEBT), reach directions (AN direction, PM direction, PL direction), and sides (left and right). Tukey’s HSD post hoc analyses were conducted to further identify differences. IBM SPSS Statistics 28.0.0.0 was used for all statistical analyses.
RESULTS
Twenty-one subjects participated (9 females, 11 males, mean age 24.5 ± 1.2 years) (Table 1).
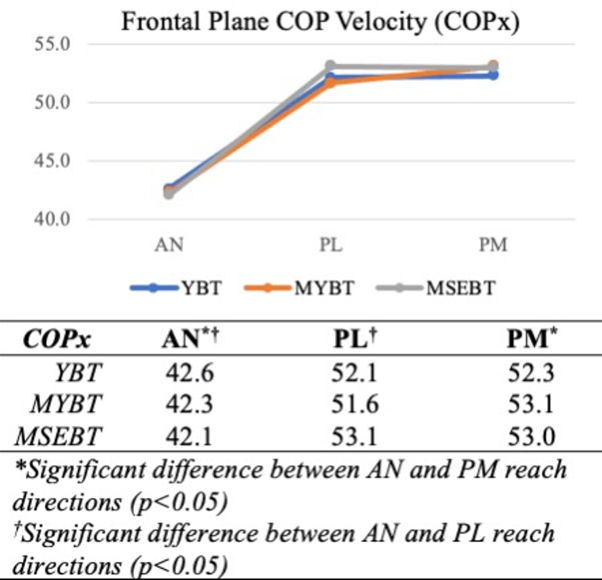
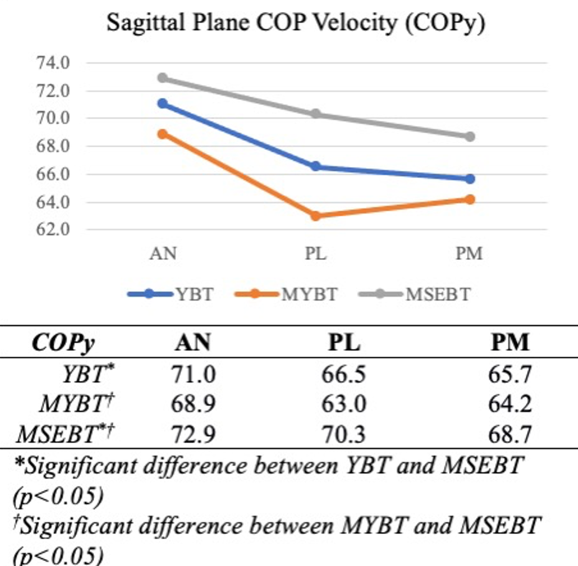
Analysis of variance results revealed a significant main effect for both test (F=4.485, p<0.001) and reach direction (F=61.594, p<0.001) but no significant finding for side (F=2.075, p=0.102). Post hoc analyses for test indicated significant differences in COPy (sagittal plane) between YBT and MSEBT (p=0.034) and between MYBT and MSEBT (p<0.001), as well as significant differences in COPr between MYBT and MSEBT (p=0.002). Post hoc analyses for reach direction revealed significant differences in COPx (frontal plane) between AN and both PM (p<0.001) and PL (p<0.001) directions, in COPy between AN and PM (p<0.001) and PL (p<0.001) directions, and COPr between AN and PL (p=0.043) directions only (Table 2).
Data specific to each test and reach direction are graphically summarized by frontal plane COP velocities (Figure 2), sagittal plane COP velocities (Figure 3), and the resultant COP velocities (Figure 4).


DISCUSSION
Frontal Plane (COPx)
There was no significant difference in frontal plane COP velocities between any of the three balance tests, but velocities were significantly slower across all tests during performance of the anterior reach (Figure 2). The lack of lower frontal plane COP velocities in the presence of an external feedback mechanism, regardless of foot contact location (YBT/MYBT), does not support the directional hypothesis that a feedback loop would improve DPC. The significantly slower frontal plane COP velocities during the performance of the anterior reach is consistent with the direct sagittal plane reaching motion, in which primary sagittal plane COP velocities are expected. This is also the only direction in which the participants could consistently visualize the reach foot throughout the motion, and visual input could have contributed to the enhanced frontal plane DPC seen in all three tests. Proprioceptive feedback does not alter frontal plane DPC during performance of the anterior reach.
Reaching in the posterior directions, regardless of the presence or absence of an external feedback mechanism, resulted in higher frontal plane COP velocities. The diagonal nature of this motion, blending frontal and sagittal planes, necessarily requires more frontal plane motion, yet the lack of differences in frontal plane COP velocities between tests is interesting. Prior research within the healthy active adult population has demonstrated PM and PL reach distance performance differences between the YBT/MYBT and the MSEBT, where participants reached farther in the presence of feedback (YBT/MYBT).9 When considering the frontal plane COP velocities recorded in this study, it appears that greater reach distance performance does not necessarily correlate with greater frontal plane DPC.
Sagittal Plane COP Velocities (COPy)
Sagittal plane COP velocities were significantly lower, regardless of reach direction, during performance of the YBT and MYBT than during performance of the MSEBT (Figure 3). These findings support the directional hypothesis and agree with the previously proposed effects of an external feedback mechanism.6,9 The presence of feedback from the reach indicator, whether centralized (MYBT) or lateral to midline (YBT), improved sagittal plane DPC in this group of participants.
The participants in this study were healthy active adults who did not engage in regular sporting activities. Prior research has demonstrated differences in reach distance performance between the YBT/MYBT and the MSEBT within both healthy active adults9 and those participating regularly in sports.6,10 Within the healthy active adult population, both PM and PL reach performances were superior on the YBT/MYBT when compared to the MSEBT, while the anterior reach was not statistically different.9 Jagger and colleagues9 attributed this difference to the benefits of a feedback mechanism when vision of the target was limited. They further suggested that contradictory findings in an athletic population – in which YBT/MSEBT reach differences were only demonstrated in the AN direction6 – may have resulted from specific sports participation or training that enhanced proprioceptive awareness within posterior reaches where the target was not directly visible.9 Current data suggest feedback is more important for sagittal plane DPC, regardless of visual input or direction of reach, within healthy active adults.
Resultant COP Velocities (COPr)
Due to its representation of both frontal and sagittal planes, the resultant COP velocities demonstrated mixed findings (Figure 4). The resultant velocities recorded during performance of the MYBT were significantly different from the MSEBT, and AN versus PL velocities were significantly different. The loss of distinct patterns noted previously within frontal and sagittal planes is due to the creation of a resultant value that blends the two planar directions. The resultant velocities were specifically calculated to better represent the pattern of motion seen during the PM and PL reach directions – an oblique, or resultant, direction – and better identify differences in those movements. While significant differences between the MYBT and MSEBT were not specific to the PL reach direction, a trend toward greater COPr velocity during performance of the MSEBT can be seen in Figure 4. During this motion, the reach foot and target are well out of the peripheral vision when participants reach their maximum, which would indicate that sagittal plane DPC and vision are more critical to performance of this task. Ultimately, the COPr velocity findings presented here blur the differences demonstrated by a more planar approach, even in movements that are more oblique in nature.
In summary, greater DPC was exhibited during performance of the YBT/MYBT when compared to the MSEBT, which agreed with the directional hypothesis. Slower sagittal plane COP velocities were recorded when the reach indicator was present and supports the suggested proprioceptive feedback mechanism. Having a constant proprioceptive feedback loop during the outward reaching motions allowed for greater DPC and resulted in the previously reported higher reach distances on the YBT/MYBT.9
Limitations
This study has several limitations. The sample size is small, which limits generalizability of the findings. Standing on the YBT stance plate did provide for a consistent position from which to record measurements for each test and reach direction, but it did not account for the non-standard elevated surface used for the MSEBT, which may have altered visual perceptions and testing outcomes.
CONCLUSION
A comprehensive assessment of COP velocity data from the YBT, MYBT, and MSEBT in this population of healthy active adults reveals the importance of external proprioceptive feedback on sagittal plane DPC. The presence of external proprioceptive feedback from the reach indicator had a greater effect on sagittal plane DPC than frontal plane DPC. Vision may have contributed to DPC when the reach foot was visible. Selection of a DPC assessment tool should be based upon the population of interest and the types of functional activities they engage in. Based on current results from healthy active adults, use of the MSEBT would provide a greater challenge to sagittal plane DPC due to its lack of a feedback mechanism.
Conflicts of interest
The authors report no conflicts of interest.
Acknowledgements
The authors would like to thank Anna Critz, Cara Delp Grubb, Amanda Frazier, and Maggie Phillips Vencille for their assistance with participant recruitment and data collection during their graduate studies.