INTRODUCTION
Athlete injury risk assessment and management is an important, yet challenging task for sport and exercise medicine professionals (herein referred to as sport medicine). Unfortunately, risk assessment and management efforts have been largely ineffective,1–5 due in part to the persistent focus on trying to identify ‘high-risk’ groups based on arbitrary cut-offs for different tests or measures,2,4 amongst many other issues that have been well discussed elsewhere.1,6–8
A cut-off is a numeric value of a continuous (or numeric) variable (e.g., knee valgus angle) that is used to classify people into mutually exclusive risk groups (i.e., high vs. low risk) based on the values’ position above or below the cut-off. Cut-offs have been proposed for almost every test or measure used for clinical decisions (e.g., strength limb symmetry index (LSI) ≥90%).9 Cut-offs are commonly used in research because they are perceived to be more clinically relevant (than a continuous variable),10 aid clinical decision making,9,10 or help simplify the interpretation of results.11–13 However, these are pseudo-benefits. The ‘simplicity’ of a cut-off comes at a considerable cost - a cost that could create more problems than solutions for clinicians.11–14 Sadly, awareness of this cost is often overlooked or unknown in sport medicine research, despite having been long established elsewhere in medicine.15 Using a cut-off (compared to a continuous variable in its natural form) will influence the analysis results, can increase the risk of a false positive finding, and inflate relationships (between predictors and outcomes) that are not present.11–15
How can the sport medicine community better assess and interpret clinical tests or measures to enable efficacious injury risk assessment in athletes? Examining the pros and cons of cut-offs is a sensible place to begin, with the potential for widespread benefits. Therefore, the purpose of this commentary is to 1) raise awareness of how common cut-offs are in sport medicine practice, 2) outline the conceptual issues related to the use of a cut-off, 3) discuss the issues of using cut-offs in research and how these can be resolved, 4) discuss the issues with making clinical decisions using cut-offs from the literature and introduce a few possible solutions. This commentary aims to encourage researchers to avoid using cut-offs in research (with a few exceptions) and build knowledge among clinicians on how to critically evaluate this type of research and increase their comfort using continuous variables to facilitate evidence-based practice. Throughout this commentary, examples from previously published works are used to highlight what has been done for illustrative purposes. The intention of this commentary is for the sport medicine community to reflect on these examples to progress the field forward.
THE COMMONALITY OF CUT-OFFS IN SPORT AND EXERCISE MEDICINE
Cut-offs are used daily and have led to important advances in clinical practice. A non-exhaustive list of examples is provided in Table 1 to highlight this commonality, but there are numerous others. This section discusses two widely used cut-offs in sport medicine, strength LSI and range of motion, and discuss how they are implemented in practice.
ACL Return to Sport Testing, using Limb Symmetry Index ≥90%
To combat high second ACL injury incidence, a set of discharge criteria have been proposed,2 one of which is knee extensor strength LSI with a cut-off of ≥90% to ‘pass’.2 These criteria have improved clinical care by reinforcing the need for routine objective testing. The use of a cut-off (in this context) has made clinical implementation of these criteria less daunting at a time when having clinicians objectively test strength was a challenge in and of itself. The cut-off (≥90% of the non-injured leg) provides an internal comparator at a percentage representative of an ‘A’ grade. This cut-off has guided informed conversations about the athlete’s physical readiness for sport and create easy-to-understand goals.
Canadian Cervical Spine Fracture Rule, Range of Motion ≥45o
The Canadian Cervical Spine Rule22 is a decision-making pathway that was developed to help clinicians promptly decide if there is a need for neck radiography. Multiple cut-offs are used, one of which is ≥45o active neck rotation.22 The advantages of this cut-off are numerous. The cut-off value (45o) is simple to remember and easy to gauge without measurement tools (e.g., a goniometer). When a decision is needed immediately and the condition is serious (i.e., cervical fracture), the simplicity of the cut-off outweighs any negatives. In this example, there is a critical need to not miss anyone with a fracture (i.e., minimize false negatives) and get radiographs for all people who might have a fracture. There is little (if any) additional benefit from knowing their actual range of motion in this context. This decision rule (using cut-offs) has helped sport medicine clinicians make quick decisions that have likely saved the lives of many athletes.
Summary
In some situations, a cut-off has simplified implementation of objective measurement and decision-making for clinicians. Clinicians often do not have full technical knowledge on all tests/measures available, such as the relationship shape (i.e., straight line or curvilinear) with the outcome. As highlighted briefly with these examples, a cut-off may help clinicians still apply a test/measure that follows best-available evidence and facilitate quick decision making in the moment (e.g., clearing an athlete for return to match play after ankle sprain). As discussed in the following sections, the use of a cut-off to indicate ‘high or low risk’ is a flawed piece of information that is commonly considered to facilitate decision making.
THE PROBLEMS WITH CUT-OFFS
The benefits and simplicity of using cut-offs in sport medicine practice have been briefly appreciated. However, in most instances, the associated costs may be too great and outweigh those benefits.11 This section will discuss the conceptual issues related to the use of a cut-off, the errors of statistically deriving a cut-off, the downsides of analyzing data based on that cut-off, and the challenges of translating cut-offs into clinical practice.
Cut-Offs Are Not Conceptually Plausible
There are strong conceptual arguments against applying a cut-off for a continuous measurement. First, a split of the data makes the strong assumption that there is a true biological dichotomy in the underlying construct (e.g., strength value associated with injury risk). Such dichotomies rarely exist as most constructs lie on a continuum.4,23,24
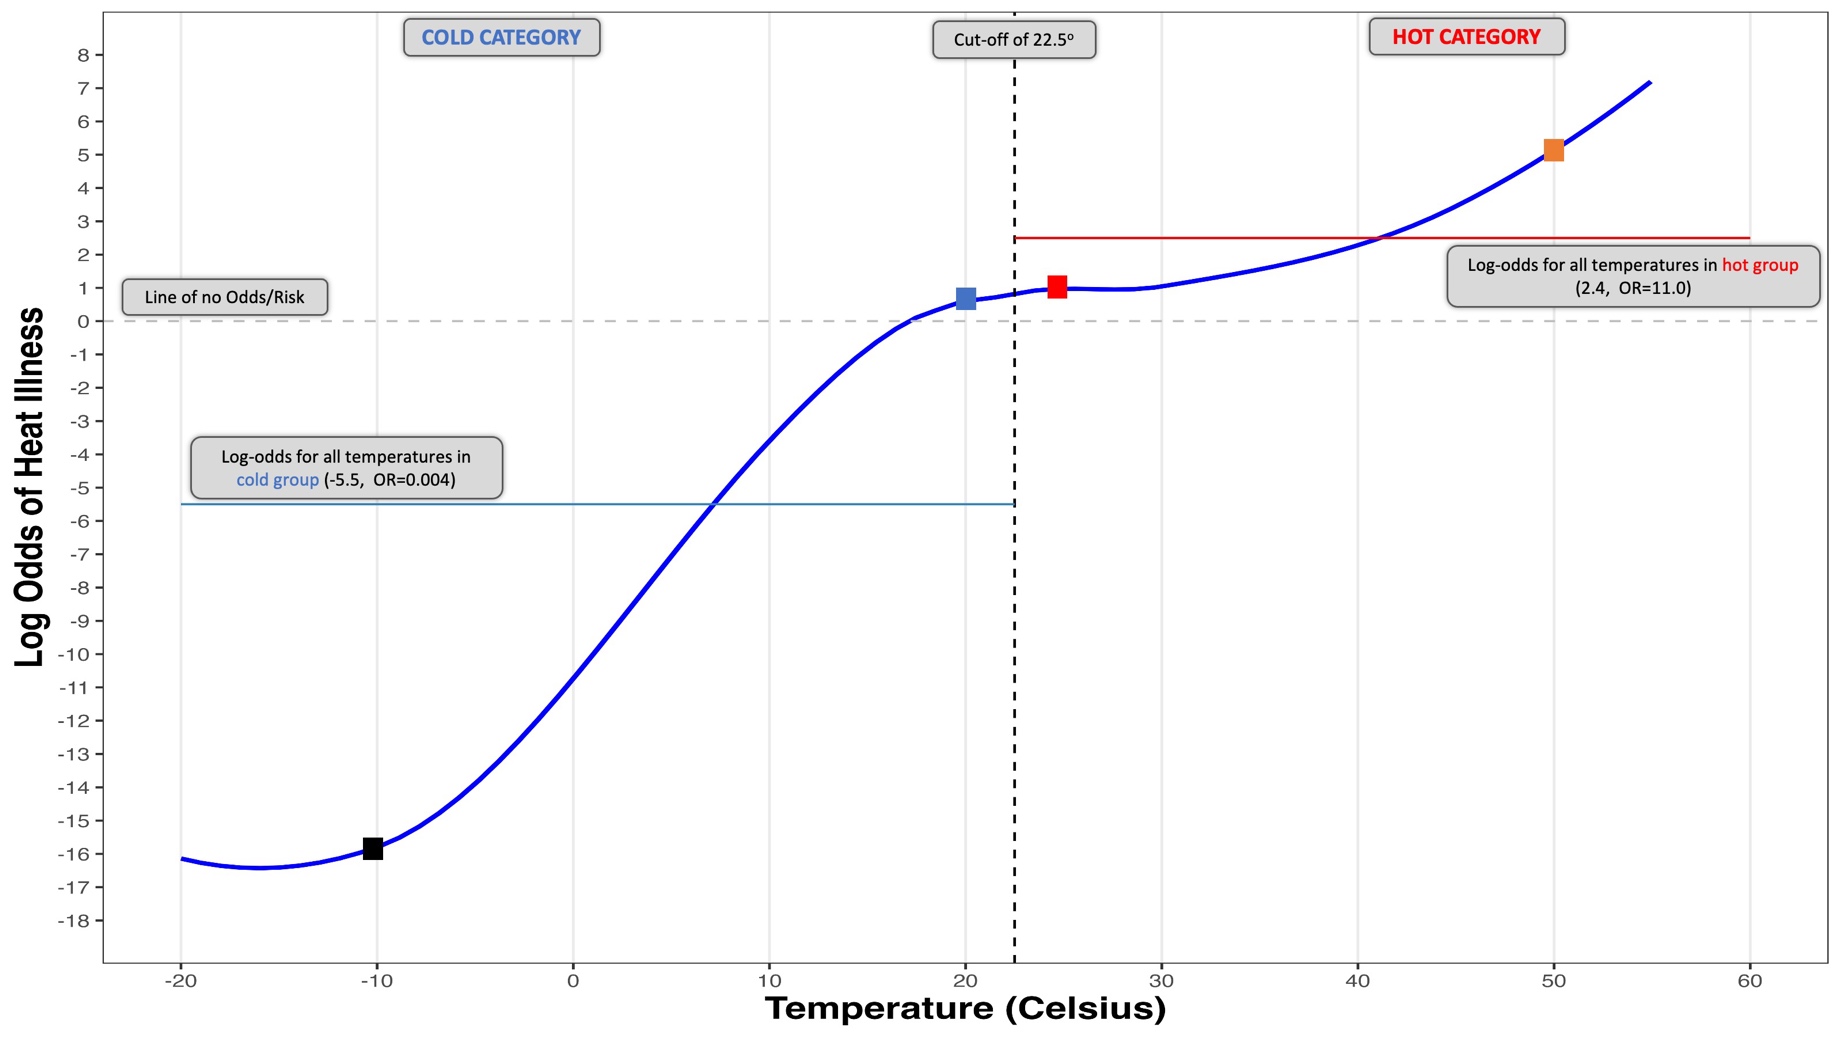
For example, classifying the weather as ‘hot’ or ‘cold’ based on a cut-off of 22.5o C (72.5o F for Americans) may be helpful for quick communication with friends. However, there is no temperature cut-off that can truly quantify exclusively ‘hot’ or exclusively ‘cold’. The same argument holds when using strength LSI ≥90% to define exclusively ‘high-risk’ and ‘low-risk’ groups. There will always be overlap and blurring of the cut-off lines.4
The dichotomy also assumes there is a distinct biologic or clinically relevant difference between groups defined by a cut-off, and similarities within groups that are paradoxical.13,14,25 Using the weather example, temperatures that are directly on either side of the cut-off (i.e., 22.4oC and 22.6oC) are assumed to be distinctly different (with different heat illness inducing thermal radiation), while temperatures within the same group but on opposite ends of the distribution are identical (e.g., 0oC and 20oC). It is not recommended to plan your vacation packing list based on your friend saying, “The weather will be below 22.5oC”. Packing for 0oC won’t be helpful when the temperature will be 15oC (Figure 1). The same issues arise with arbitrary cut-offs in clinical practice (e.g., ≥90% LSI), where a patient with 50% LSI is assumed to have the same biological injury risk and is ultimately treated the same as a patient with 87% LSI. If you do not use a cut-off to decide what clothes to bring on vacation, why should a cut-off be used to make critical medical decisions?
A cut-off does not allow visualization of the relationship shape (linear or nonlinear) because it assumes a constant relationship within each group and an unrealistic step-change between groups (Figure 1). The relationship shape is informed by the data, and it is critical to examine it. For example, body mass index has a ‘J’ shaped relationship with all-cause mortality risk.23 The risk (of all-cause mortality) is increased at low and high values of body mass index, while those in the middle (~25 kg/m2) are at decreased risk.23 Theoretically, strength LSI may follow a similar nonlinear pattern with injury risk, as large asymmetry on both ends (e.g., below 80% and above 120%) could be associated with higher injury risk, but this has yet to be empirically tested.
As a real-life example of these issues, American football teams were adjusting their concussion injury prevention programs through different equipment purchases such as a jugular vein compression collar because research found lower concussion rates when playing at stadiums in the ‘high altitude’ group, with a cut off of 644 ft (196 m) of elevation used in the analysis.17,26 This finding means that the multiple stadiums under 100 ft of elevation should take the same action as the lone stadium near the cut-off (640 ft), which seems physiologically implausible if the mechanism is related to cerebral pressure and partial oxygen pressure.14,27 However, a recent study (using elevation as a continuous variable in its native form) confirmed this was nothing more than a spurious association (due to the use of an arbitrary cut-off),14,24 and compressing the jugular vein is not necessary to prevent concussions, and would be potentially dangerous.

CUT-OFFS IN RESEARCH AND DATA ANALYSIS: ISSUES AND SOLUTIONS
The Drawbacks of Creating an ‘Optimal’ Cut-off
One of the first issues for researchers (and clinicians) to understand is how any cut-off was created. Many sport medicine studies seek to find a so-called ‘optimal’ cut-off that clinicians can use to facilitate their decisions (see Table 1 for examples) – ‘optimal’ (sic) in a perceived data-driven sense. A few techniques have been used to accomplish this task, including the minimum p-value approach (or maximum association), quantile splitting (i.e., median), and receiver operator characteristic (ROC) curves. This section reviews the technical issues with each, with relevant examples provided where able to allow clinicians to reflect on their own practice and help them become more comfortable critiquing these types of research studies.
Minimum p-value or Maximum Association Approach
The minimum p-value approach involves testing a variety of cut-offs in a univariable analysis and choosing the one that gives the lowest p-value or highest measure of association with the outcome such as an injury (e.g., odds ratio).13,15 The minimum p-value approach is fraught with issues.13,15 p-values are influenced by the sample size,28 analytical decisions,28 and tests against the null hypothesis.28 As with any study, researchers should determine what sample size is needed prior to undertaking any analysis.29 Further, testing different cut-offs (in the same dataset) by performing multiple, non-independent statistical tests (i.e., the subsequent test is based on what was found previously) violates statistical assumptions and results in severe inflation of the error rate (up to 10-fold increase)15,30 and p-values that are too small.15 Researchers would then be at risk of selecting a spurious cut-off that likely wouldn’t be observed in a repeat analysis in a new sample of similar participants.15 Null-hypothesis testing of a cut-off is not informative (i.e., testing if cut-off at value “x” is better than nothing at all), as opposed to testing against another plausible cut-off of a test that has clinical value. Most critically, this approach can lead to regrettable research practices such as ‘p-hacking’ and HARKing (i.e., hypothesis after results are known),31 or vague purpose statements such as ‘identify value of this test’ without a pre-specified analytic plan.32
Median Splitting
Median splitting is when two groups are made using one of the quantiles of the data (i.e., the median). This technique results in one group including all those with values below the median and the other with values above it. This data-driven method lacks any biologic plausibility to support its use.33 If there is a magic cut-off that creates mutually exclusive groups, why would it be at the median? The most prominent example of this technique in sport medicine is altitude and concussion risk (highlighted above),14,24 but has been seen when classifying ACL injury risk based on ‘strong vs. weak’ back squat at both the median and the 75th vs. 25th quartiles (in the same study),34 and many other examples in arm injury risk screening of overhead athletes using range of motion.35 To highlight the issue of plausibility, in the back squat example, the ‘weak group’ (below the median) also includes people who were stronger than 49% of their peers, which does not seem ‘weak’. When used, these cut-offs are specific only to the sample they came from and lack generalizability to any other sample or to the athlete in front of you (the clinician) because the median value of a clinician’s group of athletes is likely going to be different than the one used within the study.11,33 Furthermore, a cut-off based on a median (or any quartile) split is not a meaningful addition to the literature because this impedes the ability to perform a meta-analysis since different median values are identified across studies.
Receiver Operating Characteristic (ROC) Curves
Researchers often use ROC curves to identify the ‘optimal’ cut-off using either the position that is closest to perfect discrimination (between injured and uninjured) or through the Youden index.36 When trying to identify a cut-off of a potential injury predictor, this approach falls apart.37 First, the two criteria to define ‘optimal’ typically will not agree in the same dataset.36 While the actual curve picture is of little value,37,38 the area under the ROC curve (AUC) represents the cut-offs ability to discriminate between those with and without the outcome (ranges from 0.5 to 1.0, with 0.5 being no better than a random guess and 1 being perfect).39 Having a higher AUC is advantageous but does not guarantee better clinical utility or reliability of individual risk predictions.38–40 The ‘optimal’ cut-off selected may not even have good discriminate ability and common “labels” (e.g., poor or strong discriminate ability) based on a cut-off of the AUC values are not justified or recommended.39 For instance, the AUCs for generalized joint hypermobility (based on Beighton score of ≥5) and second ACL injury (AUC: 0.69; 95%CI: 0.54, 0.84) or ipsilateral second ACL injury (AUC: 0.65, 95%CI: 0.47, 0.84) had quite wide confidence intervals, and one even extended below the lower range of 0.5 indicating suspect discriminant ability.41 When an AUC (and confidence interval) is not reported, clinicians should be extremely weary of that cut-off because they have not been provided with one key piece of information to evaluate its performance. Additionally, ROC curve analyses are strongly affected by sample size.37 Unfortunately, sample sizes are generally not calculated to support this type of analysis, and ROC curves are routinely created using very small samples.6,10,42 Additionally, ROC curves are rarely reported with their associated confidence intervals (i.e., imprecision). This prevents readers from appreciating how accurate (or inaccurate) the cut-off might be when making a broader inference to the intended population.
The Use of Cut-Offs from Previous Research
Commonly, researchers consult the existing evidence and choose a cut-off value for their new study that has been previously published (e.g., RTS testing using 90% LSI cut-offs). This approach may seem scientifically justified. Unfortunately, the derivation and clinical context of the cut-off (from previous research) must be considered before adoption. Rarely is cut-off use justified beyond, “previously established cut-off” with a citation. For example, the 644 ft of elevation cut off (see above) was carried forward into future studies17,26,43 or used as justification for exploring the same relationship in the same way43,44 despite challenges to its validity,45–47 and a similar study finding the opposite relationship direction.48 As another example, 3.0 Nm/kg is commonly referred to as the cut-off for ‘sufficient’ quadriceps strength after ACLR.49 This cut-off was derived from ROC curves from two different studies which dichotomized a continuous self-reported outcome measure of knee function to serve as the outcome (although one identified 3.1 Nm/kg as the cut-off).10,50 Both studies did not indicate a sample size calculation, with only 22 total participants in one,10 and the other using a subset of participants from a larger multisite study, but did not account for any clustering this causes.50 Recent literature has found knee extensor torque to be unrelated to self-reported measures of knee function in multivariable analyses,51,52 suggesting these outcomes may not be the best choice to anchor ‘sufficient’ strength against.
The Issues of Analyzing Continuous Data Using a Cut-off
So far, this commentary has discussed the conceptual shortcomings of cut-offs, as well as the technical issues of generating a so-called ‘optimal’ cut-off for use in data analysis (or clinical practice). Next, this commentary focuses on the issues that arise when a cut-off is used in data analysis (as opposed to the continuous variable in its native form).
First, using a cut-off can result in spurious research findings, as shown with the concussion example (above).14,24 In that example, the incorrect implications (from results using a cut-off) had the potential to change equipment manufacturing or sporting policies that would have been of no benefit, and potentially harmful, to the athlete.27 Second, the results of analyses are less accurate and less clinically useful when using a cut-off. This point has been shown in epidemiology25 and in sport medicine.8 When predicting injuries in military servicemembers, one study directly compared prediction models that kept continuous variables in their natural form (with/without nonlinear shapes) to the same model that used cut-offs.8 The prediction model’s ability to discriminate between injured and uninjured participants (i.e., discrimination, area under the ROC curve), and the accuracy of predictions (via calibration slope and calibration in the large) were much worse when using cut-offs instead of continuous variables in their natural form.8 In the end, this means that the well-developed model (compared to the model with cut-offs) could improve injury risk screening by correctly identifying 47 more individuals who likely will experience an injury (per every 100 screened).8 As another example, a recent study showed that there was a nonlinear relationship between peak quadriceps strength and hop test performance after knee joint injury (adjusted R2: 0.66).52 When a median split was applied to the data and re-analyzed (not published), the adjusted R2 was much lower (0.20). While R2 is a data-set-specific metric of model fit, it is clear that there is much less variance accounted for when using the median cut-off.
There are a few reasons why poor accuracy accompanies dichotomization with a cut-off. First, there is a loss of statistical power.11–13,15 If the split was at the median, it can be equivalent to discarding as little as 36% of the data and would require a 1.57 times larger sample to overcome this.53 Discarding information is arguably a questionable research practice when study participants have consented32 to the use of their data and invested time and energy to help researchers address these questions. When a cut-off is made at differing ends of the distribution (e.g., the 25th or 75th percentile), there is a risk of sparse data bias because one group might be much too small and likely will have too few events (i.e., injuries).41,54 Sparse data bias results in critical imprecision, rendering the results difficult to be confident in or interpret.54 When a variable with too few observations and events in one group is used in a multivariable analysis, sparse data bias is exacerbated with point estimates and confidence intervals that can extend to infinity.54 Within the sport medicine field, odds ratios with a confidence interval width substantially larger (over 100x larger)34,41,42,55–58 than what is considered as a ‘large effect’ in meta-analyses (i.e. odds ratio of 5)59 have been reported. Sparse data bias is avoidable in this case and is the duty of the researcher to ensure they are not making this error that renders the data borderline illogical. When confidence interval width (of an odds or risk ratio) is greater than 50, clinicians should be quite hesitant to use that cut-off in practice.
On certain occasions, four groups could be created based on quartiles instead of two. This approach is certainly preferred (over dichotomization) because power loss is reduced.11,13 However, the concerns for sparse data bias persist since there is no guarantee that groups have a sufficient number of observations or events,54 and the assumptions of creating the multiple cut-points must still be met (See Binney and Mansournia for a detailed review).24 This approach also requires more analytic degrees of freedom due to the increased number of parameters to estimate. The analytic ‘simplicity’ the researcher was hoping for (by using a cut-off) is now lost when comparing four groups instead of two. Using a flexible approach with a continuous variable, such as a spline, fractional polynomial, or generalized additive models maximizes efficiency and avoids these issues. However, care must be taken to not overfit the data and consultation from a statistician should be sought. For more complete discussions on handling nonlinear relationships, the curious reader is referred elsewhere.60–64
Another detrimental issue occurs when the same data set used to create an ‘optimal’ cut-off is then used to assess the factor-outcome association using that cut-off. These results will be drastically inflated because the data used to ‘test’ how strong the factor-outcome association is (e.g., multivariable analysis), was also used to ‘determine’ the best cut-off to maximize that very same relationship.13,15 This sort of circular analysis happens frequently50,65–67 and is of the utmost importance for clinicians to understand when interpreting research because it makes the cut-off value seem more believable, meaningful and important to implement in practice. As a hypothetical example, ROC analysis of preseason ankle dorsiflexion range of motion data is used to create a cut-off that best classifies athletes based on if they experienced an ankle sprain over the past season. The new cut-off (e.g., 5o) has created two groups (high- and low-risk), which are then compared to determine the association between group membership (above or below the cut-off) and risk of having had the same ankle sprain injuries over the past season. This error is almost identical to splitting a sample of athletes into ‘high’ and ‘low’ quadriceps strength groups based on the median value and then comparing the two groups (above or below the median), to see which one has greater quadriceps strength.
The Solution for Researchers: Using Continuous Variables in Their Native Form
On the surface, keeping continuous variables as such may seem like increasing analytical complexity and hindering interpretation- an argument often touted in favor of dichotomization. However, keeping a continuous variable in its natural form decreases data complexity, improves outcome prediction, and can facilitate personalized medicine in ways a cut-off cannot.8 These points have been alluded to throughout this commentary with both hypothetical and empirical examples from the sport medicine literature. Collectively, injury risk assessment would be substantially improved by maximizing the data and keeping continuous variables as such. Table 2 provides some common; but not exhaustive, scenarios that show these benefits.
CUT-OFFS IN CLINICAL PRACTICE: ISSUES, NUANCES, AND POSSIBLE SOLUTIONS
Thus far, this commentary has highlighted the commonality of cut-offs in sport medicine and focused on technical details and pitfalls related to the derivation and use of cut-offs in research. In this section, the issues that clinicians face when using cut-offs in clinical practice, some important nuances where cut-offs may be useful, and potential solutions are discussed.
The Issues Translating Cut-offs into Clinical Practice
The most important issue with using cut-offs in clinical practice is the decreased ability to facilitate individualized care or personalized medicine.70 When clinicians group patients based on a cut-off (e.g., <90% LSI), and are labeled ‘high-risk’, any subsequent decision using this information is driven by group membership. The decision will be the same for all patients in that group (e.g., ‘not allowed to RTS’) and does not factor in the possibility of misclassification due to measurement error.71 However, this approach is not reflective of best practice for the RTS process,72 as it ignores the athlete’s role in shared decision making, their own risk assessment, any time or financial considerations, benefits and harms of corresponding treatments, and omits consideration of other relevant factors, such as individual characteristics (e.g., age, sex, sport type/level), rehabilitation goals, and current recovery trajectory. Even if a cut-off is still used, it should be just one piece of information that is considered alongside many others to make a personalized decision for that athlete.
Cut-offs may also struggle to apply to multiple geographic locations and contexts. In the fictitious temperature example, the cut-off for ‘hot’ is likely quite different for individuals in Phoenix (Arizona) compared to Seattle (Washington). When thinking of common cut-offs in your own context, would or should there be an expectation that they (the cut-offs) would be the same for different sports, positions or even age-groups or competition levels? There are additional issues translating cut-offs into the clinic that were already highlighted in this commentary, including a lack of generalizability (see median splitting section) and a lack of any sound biologic rationale (see Cut-Offs Are Not Conceptually Plausible section).
Often during rehabilitation or injury risk screening, a common cut-off is used as a goal. This can be a nice overarching target. What can occur is that once the goal is met, tracking of that test/measure stops even though it is an important construct. This is a problematic practice because sport and rehabilitation are dynamic environments and constructs like strength or movement performance (two common injury risk screening tests) may change quickly for many reasons. Additionally, once the cut-off is met (e.g., >90 LSI), it does not necessarily mean the athlete has returned to prior level of performance and additional intervention may be necessary.
Important Clinical Nuances Related to Cut-off Use
While there are many upsides to not using a cut-off in clinical practice, in certain circumstances they may be preferred and beneficial.24 These situations are commonly when decisions need to be made quickly for emergent medical situations such as in the presence of a possible cervical fracture or an ankle sprain to gauge the need for radiographs. These situations are when the consequences of a false negative (i.e., they have a fracture, and it was missed) greatly outweighs the harms of a false positive (radiation exposure, cost, and loss of game time). In these situations, the value of the continuous variable in the decision rules is irrelevant for any future decision making (e.g., how many steps taken after ankle sprain, Ottawa Ankle Rules). The use of a cut-off allowed the diagnostic utility of these rules to be modulated so the test could ‘catch all’.
Policy making to cover a large number of athletes is another nuance where a cut-off is likely necessary. For example, a sport club may implement that all athletes under age 16 must perform an ACL injury prevention program since peak incidence is in adolescents,73 the club has mostly under 16-year old athletes, and/or the medical providers leading the program are only available when the younger athletes are practicing, while it is optional for all other athletes if they can make the listed times. These policies can help prioritize resource deployment at the larger scale. The benefits of these (hypothetical) policies should then be formally evaluated and updated based on their performance and any other contextual nuance (e.g., spike in ACL incidence in 18-year-olds).
Possible Solutions for Clinicians
Continuous variables are not widely used in sport medicine practice and many clinicians may be hesitant to attempt interpreting them with patients. There are a few potential solutions that have been identified in this commentary, however a more robust decision framework is likely necessary to fully guide clinical practice, which is beyond the scope of this work. This commentary proceeds with a few options that hopefully are the start of this conversation amongst the community.
Since clinicians are not expected to have full technical knowledge of different test/measures (e.g., relationship shape), there is the potential to use risk calculators or web-based apps in clinical settings. These tools are growing in popularity and are starting to accompany many research studies developing risk prediction scores. For example, Rhon et al.8 published a link (within their supplemental file) to an interactive nomogram where clinicians directly input the values (continuous variables) of each test and measure and the predicted probability (0-1) of the outcome (time loss injury) is calculated directly for the clinician based on the published prediction model. Once an injury risk probability is known, this can be directly communicated to the athlete and facilitate an informed discussion. In the end, the clinician and patient team (along with other relevant parties) may still need to establish a ‘cut-off’ or risk threshold of when they will intervene or not. However, this is a clinical decision and not a statistical one, where other pieces of information (see The Issues Translating Cut-offs into Clinical Practice Section for examples) are absolutely necessary to consider and each risk threshold cut-off will be different from athlete to athlete. A similar approach has been well discussed in medical research38,40 and in a recent commentary on this topic.24
While decision aids are being created over time, clinicians are encouraged to identify the key details from these types of research studies. These details include the relationship shape (i.e., straight line or curvilinear), and the relationship magnitude (and precision via confidence intervals) for a 1-unit change in the test/measure on the continuous scale. Table 2 provides a simple example clinicians can refer to.
To overcome issues of using a cut-off as a goal, clinicians are encouraged to track the actual value of the test/measure over time and focus on understanding its trends. This tracking allows them to understand how quickly (or slowly) that test/measure is changing, how common it is for the athlete to fluctuate above/below the cut-off, and the actual value could be used to compare to any available normative data (e.g., The Dashboard for ACL Reconstruction Testing, https://acldashboard.com). By focusing on the continuous value, and incorporating other information, this may decrease the chance that once the target is hit, it and other information are disregarded.
SUMMARY AND RECOMMEDNATIONS TO IMPROVE SPORT AND EXERCISE MEDICINE INJURY RISK ASSESSMENT RESEARCH AND PRACTICE
Two core themes were highlighted throughout this commentary. First, dichotomizing continuous variables using any cut-off comes at considerable costs. Second, there is improved accuracy and clinical utility of research and clinical test or measures data when continuous variables are analyzed and interpreted when retained in their natural form. To move the field forward, a set of recommendations for both researchers and clinicians are outlined in Table 3.
This commentary has made recommendations that are not widely used in sport medicine research. However, the recommendations for data analysis are in line with the CHAMP Statement (A Checklist for statistical Assessment of Medical Papers)29 and have been well established in other medical research fields. By presenting a detailed review and providing both challenges and potential solutions, clinicians can become more cognizant of important details when reading injury risk assessment research and start to increase their familiarity and comfort when interpreting and using continuous values to make decisions with athletes.
CONCLUSION
Current practices of injury risk assessment and management can be more effective by reducing the use of and reliance on cut-offs to identify those ‘at-risk’ vs. ‘not at-risk’. By embracing continuous variables in their natural form in data analysis, researchers can provide more accurate information to clinicians. By understanding the limitations of research deriving and using cut-offs, clinicians can better critique research and reduce the implementation of low-quality evidence into practice. Collectively, using continuous variables in their natural form can make injury risk assessment more accurate, facilitate personalized medicine, and ultimately improve the care of the athlete’s being served.
Corresponding Author
Dr. Justin Losciale
2177 Wesbrook Mall, Vancouver, British Columbia, V6T 1Z3, Canada
jlosciale8@outlook.com
Funding
JML is funded by the Arthritis Society PhD Salary Award (TGP-0000000086) and the University of British Columbia Four-Year Fellowship. LKT is funded by the Canadian Institutes of Health Research Fellowship (FRN: 176591).
Conflicts of Interest
None