INTRODUCTION
The pitching motion in baseball involves not only the upper limbs but also coordinated energy generation from the trunk.1 Therefore, during pitching, various tension and compression loads are applied to the shoulder and elbow joints.2 In baseball, particularly for pitchers, ball velocity serves as an indicator of pitching performance, and enhancing ball velocity is crucial for coaching.
However, ball velocity is influenced not only by physical factors, such as muscle strength, but also by various other factors, including the pitching form.3 Although ball velocity is affected by various factors, it can be improved by efficiently transmitting energy from the lower limbs to the trunk and upper limbs. Therefore, when an injured player returns to competition, it is necessary not only to address symptoms such as joint pain and anxiety, but also to focus on pitching form, considering the aspects of pitching performance such as ball velocity.
The throwing motion generally comprises 1) wind-up, 2) stride, 3) cocking, 4) acceleration, 5) deceleration, and 6) follow-through.4 When teaching the pitching motion, it is easy to confirm the movement of the pelvis and trunk that occurs from the stride to the cocking period. The relationship between ball velocity and trunk motion during pitching has been widely reported; Manzi et al.5 and Solomito et al.6 reported that an increase in the angle of forward trunk tilt during ball release increases ball velocity. Oyama et al.7 also reported that ball velocity increases as the lateral flexion angle to the body increases during maximum external rotation of the shoulder joint. Thus, the authors believe that the trunk motion during pitching is closely related to ball velocity. However, prior studies have usee a three-dimensional motion analysis device, which is difficult to use in clinical practice. A method that uses artificial intelligence (AI) for motion analysis and measures the knee joint angle during gait without using a 3-dimentional motion analyzer has been reported.8 With the development of AI, pitching motion analysis can now be performed without using infrared reflective markers (marker-less). The disadvantage of marker-less motion analysis is that the joint positions are estimated based on videos and images and the joint angles can be calculated. However, the advantage of this analysis is that it only uses videos and eliminates complex equipment operations. In addition, the measurement space is no longer restricted, making using use in clinical and instructional settings easier.
Focusing on trunk rotation to the non-throwing side (observed during stride foot contact) is one of the key points when evaluating pitching form. Davis et al. previously reported that throwing efficiency (normalized shoulder joint internal rotation torque or normalized elbow valgus torque/ball velocity) was poor in athletes who had elbow drop and trunk rotation to the non-throwing side that occurred early during the throwing motion.9 Sgroi et al.10 reported that the hip-shoulder separation (H/S) is a factor that influences ball velocity. Furthermore, because the trunk rotation angular velocity is also related to ball velocity,11 the rotation angle of the thorax at stride foot contact (SFC) is often a necessary factor for analysis. Therefore, elucidating the factors related to early trunk rotational movements is crucial to effectively guide pitching mechanics.
H/S and thoracic rotation angles require spinal mobility, particularly of the thoracic spine. There have been various reports on methods for measuring thoracic spine rotation range of motion in the past,12,13 including the use of the lumbar locked rotation test (LLR-t).14 Regarding the relationship between LLR-t and baseball, Okamura et al.15 reported that an increase in the angle of LLR-t to the throwing side decreases maximal elbow valgus torque. Thus, LLR-t throwing side angle may correlate with H/S and SFC thoracic rotation angle during the throwing motion, which is the approximate limb position during LLR-t. Therefore, The purpose of this study was to investigate the relationship between the range of thoracic spine rotation measured using the lumbar locked rotation test (LLR-t), hip-shoulder separation (H/S) and thoracic rotation angle at stride foot contact (SFC), and ball velocity. The hypothesis was that players with higher throwing side angles measures in the LLR-t would exhibit smaller trunk rotation angles at SFC, larger H/S, and higher ball velocity.
METHODS
Participants
Fifteen healthy male students (twelve right-handed and three left-handed, who belonged to a high school baseball team were included in this study The exclusion criteria included individuals who had experienced shoulder or elbow pain during pitching in the past year and those who had a sidearm or underhand pitching motion. This study was approved by the Ethics Review Committee for Health and Medical Sciences Research at the Bunkyo Gakuin University (Approval Number 2022-009). The participants were provided with an explanation of the research objectives and measurements were taken after obtaining their consent.
Thoracic Spine Rotation Range of Motion
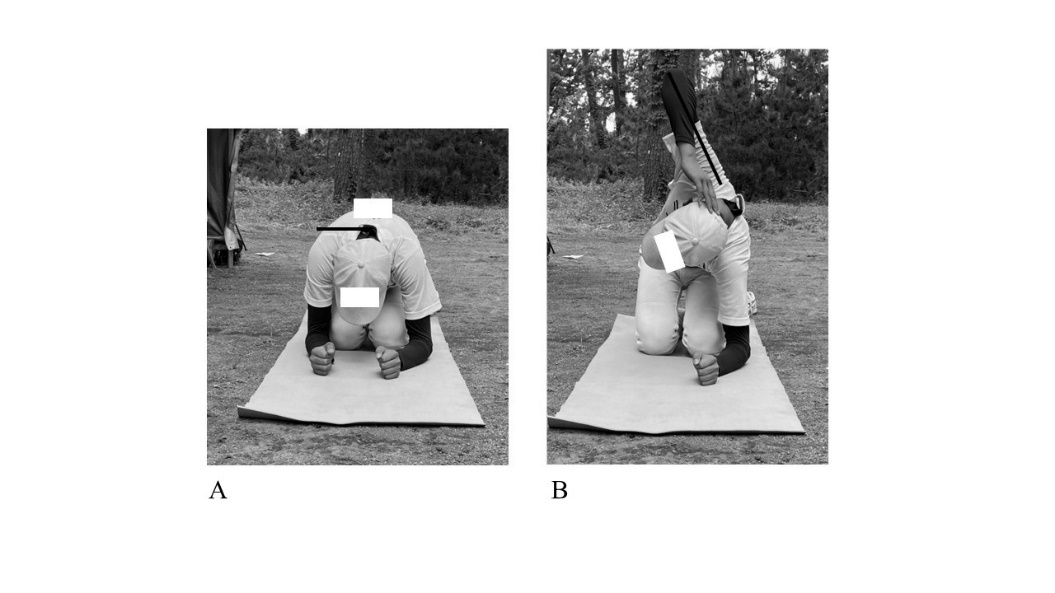
The thoracic spine rotation range of motion was measured using the method described by Johnson et al.,16 following their approach for the LLR-t. The measurement posture involved adopting a quadruped position with the buttocks resting on the heels and forearms in contact with the floor. The upper limb on the side being measured was placed behind the head, and trunk rotation was performed through voluntary movement (Figure 1A, B). The thoracic spine rotation angle was measured using an inclinometer (Shinwa Rules Co., Ltd., Japan). The inclinometer was positioned between the first and second thoracic vertebrae, and measurements were taken in one-degree increments. If compensatory movements due to lateral spinal flexion were observed, re-measurements were performed. Measurements were taken three times on both the left and right sides, and the average value was considered the representative measurement. The throwing and non-throwing sides were defined as the dominant and nondominant sides, respectively. Furthermore, Feijen et al reported the intra-rater reliability of this measurement method to be 0.91 for right rotation and 0.96 for left rotation, while the inter-rater reliability was 0.89 for right rotation and 0.86 for left rotation.17 All LLR-t angles were measured by a physical therapist with 15 years of experience (S.O.).
_measurement_start_position_(a)_and_maximum_rotation_po.jpeg)
Motion Analysis
Pitch motion analysis was conducted using a tablet device (iPad Pro, Apple Inc, Cupertino, CA, USA) and a single camera marker-less motion capture solution (Pitch AI, 3MotionAI Inc. Oakville, ON, Canada). The measurement environment was an outdoor field with a pitching mound. The tablet device was positioned in the direction of the third base from the pitching plate on the mound. The distance from the pitching plate to the tablet device was set to align with the height of the pitcher’s belt, following the recommendation of the Pitch AI application, where a line appears on the screen.
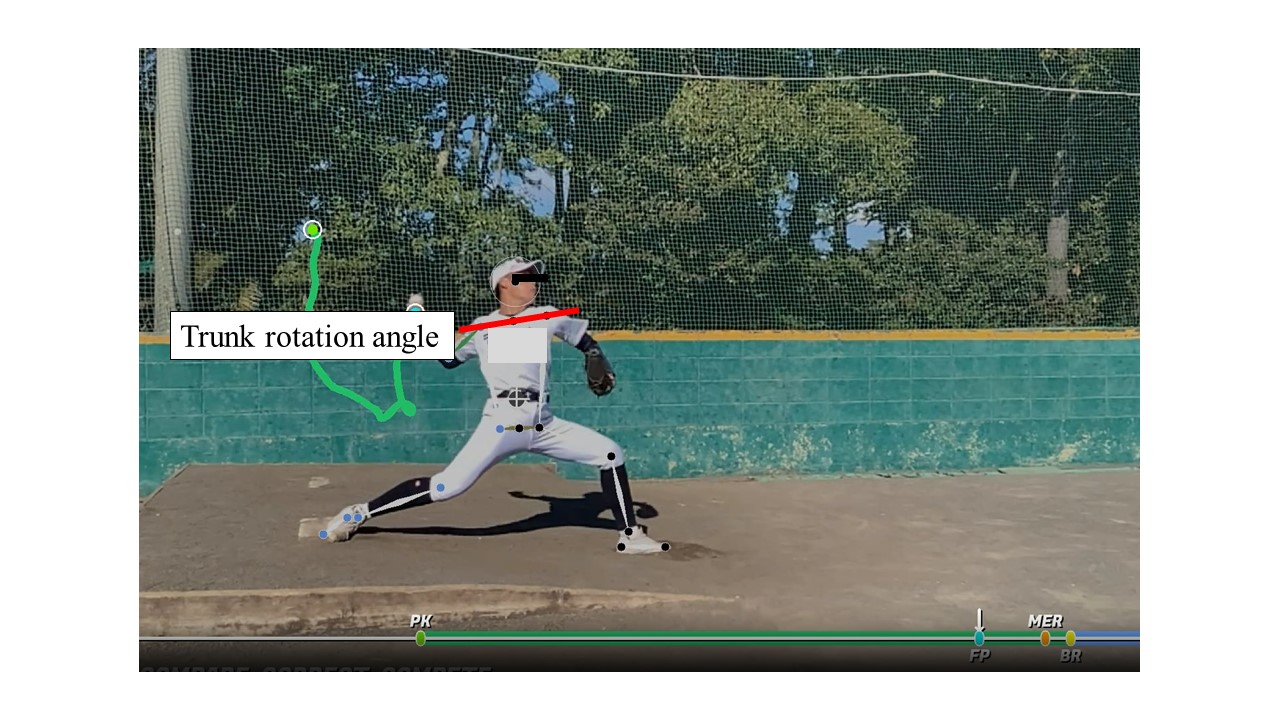
First, the players were instructed to warm up before the measurement in the way that each player normally did. A total of 30 minutes was allotted for warming up: 15 min for stretching and 15 min for playing catch. After warming up, the players were asked to throw a pitch to a catcher sitting 18.44 m away as a measurement task. The throwing motion was started from the set position. The instructions for pitching were “Please pitch as you would normally do in a game”. The trial with the highest ball velocity among the five ball pitches measured was included in the analysis. The analysis utilized Pitch AI to calculate the H/S and thoracic rotation angle at SFC (Figure 3). This pitching motion analysis app estimates joint positions using AI by capturing videos from the front plane with a tablet device, enabling the measurement of joint angles. Of note, Dobos et al.18 assessed the measurement error of this app, by comparing it with three dimensional motion capture, and reported an r² of 0.92 and a root mean squared error of 6.04°for the trunk segment.
For right-handed pitchers, the calculation of H/S and trunk angle was defined using the third base direction as 0° and the home plate direction as 90°, with positive values indicating rotation towards the non-throwing side and negative values indicating rotation towards the throwing side. Calculation of thoracic rotation angle during H/S and SFC using the Pitch AI was performed by a physical therapist with 11 years of experience (K.I.). To assess pitching performance, ball velocity was measured using a pitching tracking device Pitching2.0 (Rapsodo LLC, Kanagawa, Japan). The pitching tracking device was positioned 4.75 m from the front edge of the home plate, as recommended by the usage instructions. The reliability of this pitch tracking device has not determined.

Statistical Analyses
All statistical analyses were performed using SPSS version 25 (IBM Corporation, Chicago, IL, USA). After confirming normality using the Shapiro–Wilk test, correlations between LLR angle, H/S, trunk rotation angles at SFC, and ball velocity were examined using Pearson’s correlation coefficient. Based on the report by Alveiero et al.,19 correlations were assessed as weak (0.1< r < 0.3), moderate (0.3 < r < 0.5), or strong (r.>0.5). Correlations were deemed significant at p<0.05.
RESULTS
Characteristics of the participant are shown in Table1.The average values of each measurement are presented in Table 2. The throwing side LLR, non-throwing side LLR, H/S, and trunk rotation (at SFC) angles were 53.7±8.3°, 51.2±8.5°, 31.2±19.4°, and 9.1±8°, respectively, and the ball velocity was 123.5±4.6 km/h.
Table 3 presents the correlation coefficients for each measurement. There was a positive correlation between the LLR angles and H/S (r=0.52, p=0.04). The LLR angle on the throwing side and the thoracic rotation angle exhibited a negative correlation (r=-0.62, p=0.01). There was a positive correlation between the ball velocity and H/S (r=0.54, p=0.04). Ball velocity and thoracic rotation angle at SFC showed anegative correlation (r=-0.56, p=0.03). No other significant correlations were observed.
DISCUSSION
In this study, the authors utilized LLR-t and Pitch AI to elucidate the correlation between the thoracic spine rotational range and trunk rotational movement during pitching. Regarding the interplay between LLR and pitching mechanics, the results revealed that a greater throwing side angle in LLR-t was associated with an increased H/S and decreased trunk rotation angle. In terms of ball velocity, no correlation was observed with the LLR angle. However, ball velocity increased as H/S increased and thoracic rotation angle decreased during pitching.
First, regarding the angle of gyration during pitching, Nissen et al.20 reported pelvic and thoracic rotation angles to be -64±12° and -92±11°, respectively at the time of SFC. These angle differences were approximately 30°. In the current study using the Pitch AI, the H/S was approximately 31.2±19.4°, yielding a result that closely approximated those reported by Nissen. However, considering the measurement accuracy of the trunk rotation angle of Pitch AI used in this study, considering the possibility of an error from the actual angle is necessary.
A positive correlation was observed between LLR on the throwing side and H/S, whereas a negative correlation was found with the thoracic rotation angle at SFC. In other words, players with higher LLR angles on the throwing side tended to exhibit higher H/S values at SFC, allowing them to maintain a position with the trunk directed towards third base. Motion between the trunk and H/S can be characterized as “opening up” or not “opening up” when providing instruction. The necessary H/S angle is approximately 30° and considering that the average LLR angle on the throwing side in this study was 53.7±8.3°, it can be inferred that players had a sufficient thoracic rotation range relative to the pelvis. Bullock et al.21 reported a lack of correlation between the seated thoracic rotation angle and H/S. However, the authors attribute the observed relationship to differences in the measurement positions for the thoracic rotation angles in the current study. This study involved fixing the pelvis and lumbar spine while elevating the upper limb of the measured side. This differs from seated thoracic rotation, and the authors believe that the increased influence of the extensibility of the pectoralis major and minor muscles plays a significant role in contributing to the discrepancies observed in previous reports.
Aguinaldo et al.22 reported that the initiation timing of trunk rotation during pitching, which is related to the thoracic rotation angle at SFC, tends to be delayed in professional players compared to college-level players and younger age groups. Therefore, in the high school age group, the initiation timing of trunk rotation may occur earlier, potentially leading to an increase in the thoracic rotation angle towards the non-throwing side. However, the participants in this study, although high school students, had an average athletic experience of 8.9±1.5 years. Hence, we speculate that the observed relationship was present because the participants could effectively utilize their own LLR angles in thoracic rotation during pitching.
The observed relationship between H/S, thoracic rotation angle, and ball velocity may be attributed to the significant torsional difference between the pelvis and thorax driven by the stretch-shortening cycle (SSC) in the core muscle groups, particularly the external oblique on the throwing side and the internal oblique on the non-throwing side. The increase in H/S may have been related to the non-throwing side rotation movement that occurs after SFC because the SSC works by stretching the external oblique muscles on the pitching side and the internal oblique muscles on the non-throwing side.
The low thoracic rotation angle during SFC means that the right-handed pitcher’s thoracic is facing toward third base. Lin et al.23 reported that players exhibiting early rotational movements towards the non-throwing side tended to have slower ball velocity. Therefore, it was thought that a relationship would be found between ball velocity and thoracic rotation angle, which was confirmed.
There are four limitations of this study. This study is fails to consider of the relationship between the pelvis and lower limb joints. Because the H/S is determined by the relative positions of the pelvis and thorax, it may be influenced by factors such as pelvic and hip joint movements of the stance leg. Dowling et al.24 have previously reported relationships between the pelvic rotation and knee joint angles on the stepping side, highlighting the need for future investigations to address these aspects. Next, the measurement accuracy of the Pitch AI and the pitch tracking device is discussed. It was 11.16° and 8.64° RMS for H/S and trunk rotation angle during SFC compared to the 3D motion analysis analyzer, respectively.18 Thus, the Pitch AI should be used understanding that the results are not the same as those that would be achieved using 3D motion capture. In addition, the accuracy of the pitch tracking device used in the ball velocity measurement was unknown. Finally, the sample size and the analysis test were only for the highest ball velocity. In this study, 15 participants were selected because the individuals were either pitchers or experienced pitchers; the pitching motion other than overthrow was also an exclusion criterion. In addition, the throwing motion by pitchers is a repetitive one: the joint angles may differ from test to test. Therefore, increasing the sample size and number of trials in the future is necessary.
CONCLUSION
The results of this study indicate that as the LLR angle on the throwing side increased, the H/S increased and the thoracic rotation angle at the SFC decreased. This suggests that evaluating the LLR angle on the throwing side could be beneficial for players who exhibit early rotation towards the non-throwing side during pitching.
Conflicts of Interest
The authors report no conflicts of interest.