
INTRODUCTION
The anterior cruciate ligament (ACL) is a static knee stabilizer that is commonly injured in sports.1,2 The incidence of ACL injury has continued to rise over the years, with young female athletes being at an increased risk for noncontact ACL injuries compared to males.3–6 Injury prevention programs (IPP) are a common tool used to reduce the incidence of ACL tears, but these programs have limited efficacy, as they require ~100 participants to prevent a single ACL injury and may not target all aspects of injury risk.7,8 Typical IPPs target biomechanical risk factors associated with ACL injuries, such as knee valgus and stiff-legged landing patterns.9,10 However, the efficacy of IPPs may be limited by treatment approaches targeting biomechanical outputs without accounting for critical nervous system processes that contribute to injury risk.11–13
Dynamic knee valgus, or collapse of the knee toward midline during landing, is a specific and sensitive biomechanical risk factor for ACL injury,9 which has been associated with neurocognitive deficits14 (e.g., visual attention, reaction time) and increased sensorimotor and visuospatial neural activity12,13 for knee movement during functional magnetic resonance imaging (fMRI). Taken together, these studies suggest athletes at increased risk of ACL injury employ sensorimotor control strategies highly influenced by the visuocognitive system. Further support comes from three prospective studies: one that identified baseline visuospatial deficits in uninjured athletes who later sustained an ACL injury15; and two studies that used resting state MRI to identify decreased sensorimotor brain functional connectivity in uninjured athletes who later sustained an ACL injury.11,16 Taken together, these neurophysiological and neurocognitive data support the influence of sensory and visuospatial cognition on injury-risk. Therefore, incorporating visuocognitive training into IPPs may improve their efficacy by preparing athletes for the visually and cognitively demanding dynamic sport environment.
A simple and relatively cost-effective way that IPPs could add visuocognitive training is by incorporating stroboscopic glasses (SG).17 SG allow for portable visual perturbation by alternating between clear and opaque lens states at controllable frequencies. This high degree of control enables clinicians/athletic trainers/coaches to incrementally perturb the amount of visual information available to their athletes during neuromuscular training. SG has previously been used in a research setting to assess training effects on behavioral performance, neurocognitive function, and sport-specific abilities,18–28 but there is a paucity of research quantifying neural activity changes following visuocognitive training with SG. Therefore, we developed visual perturbation neuromuscular training (VPNT, injury prevention exercises29,30 overlayed with visual perturbation via SG and external focus feedback to direct attention to the environment) to fill this gap. The purpose of this study was to determine changes in landing mechanics, neural activity (quantified using blood-oxygen-level-dependent [BOLD] signal) for knee motor control, and physical and cognitive training demands in young female athletes following VPNT.
METHODS
Screening
This study was approved by Ohio University’s Institutional Review Board, and all experiments were performed in accordance with the approved protocol. Pre-/post-intervention procedures and VPNT were carried out by one researcher (TW). Female recreational athletes (at least 3 hours of moderate-to-vigorous exercise per week, including one hour of running, cutting, pivoting, or decelerating every week) aged 18-30 were included. Eight female participants (8 F; age = 20.4 ± 1.1 years, height = 1.6 ± 0.1 m, mass = 64.4 ± 7.0 kg) from Ohio University (Athens, OH) were enrolled to participate in this study, and informed written consent was obtained prior to participation. All participants were right leg dominant and met the exercise requirement criteria, as determined by the Marx Activity Rating Scale,31 which assesses one’s general level of activity on four metrics indicating involvement in activities requiring running and rapid change of direction (run=2.6±0.7, cut=1.9±1.6, decelerate=1.9±1.6, pivot=2.1±1.5). No formal power analysis was completed as these data are exploratory and meant to be hypothesis-generating.
Participants were excluded who were contraindicated for fMRI (e.g., pregnancy, implanted metal devices, claustrophobia, and any other criteria as determined by the MRI operator), had visual impairments, had a history of seizures or epilepsy, or had a history of surgery on the back, hip, leg, knee, etc. Other screening criteria included: primary sport, leg dominance, and exclusion for previous leg injury or medical history of anxiety disorder, ADHD, depression, diabetic neuropathy, concussion or traumatic brain injury, cerebral palsy, balance disorder, vertigo, Parkinson’s disease, multiple sclerosis, substance abuse or dependence, heart disease/defect.
Pre-/Post-Intervention Landing Error Scoring System (LESS) Assessment
The LESS is a clinical tool used to assess lower extremity injury risk by identifying injury risk landing mechanics during a jump-landing task.32,33 To ensure participants were enrolled that would benefit from the training, potential subjects were screened and only enrolled participants with high injury risk landing mechanics (LESS score of 6+). This cutoff was selected as prior work validated the 6+ error threshold with 3D motion capture to discriminate between high and low risk biomechanics.34 A total of 20 athletes were screened and eight met the enrollment criteria.
A designated experimenter (TW) was trained to evaluate jump-landing mechanics in real-time using the LESS. For training, TW rated the landing biomechanics of athletes using the LESS while watching 50+ videos from frontal and sagittal views. TW’s ratings were compared with an expert’s ratings (with 10+ years of clinical experience) until TW’s ratings were reliable and valid (over 90% agreement).35–37 The LESS methods have previously demonstrated good to excellent intra- (ICC: .82-.99) and interrater (ICC: .83-.92) reliability as well as good intersession reliability (ICC: .81).36,38
Participants performed the jump-landing task for the LESS four times: twice with a face-forward frontal view and twice with a right (dominant) sagittal view. Participants performed the jump-landing task on a 30 cm tall box, landed at a distance equal to half their height, and were given unlimited practice trials until they could perform the task correctly and explicitly follow test instructions.32 Participants received the following instructions and no additional feedback: 1) stand at the edge of the box in a neutral position, 2) jump forward so both your legs leave the box simultaneously, 3) land just past the target line, and 4) jump for maximal height immediately after landing. Trials were considered successful if the participant jumped from the box using both feet, cleared the minimum distance and performed the task in a fluid motion. All unsuccessful trials (e.g., the participant jumped vertically from the box) were excluded and repeated until four successful jumps were completed.32 After the final VPNT training session, participants completed the same jump-landing task to determine intervention efficacy of reducing high injury risk landing biomechanics. Total LESS score was used for statistical analyses pre- and post-intervention.
Pre-/Post-Intervention Neuroimaging Assessment
All participants completed a pre- and post-intervention fMRI neuroimaging session (~45 minutes including set-up, instruction, and scan time). During imaging, all participants wore standardized shorts and socks without shoes to reduce the possibility of altered skin tactile feedback. Participants also wore a splint to lock their right (dominant leg) ankle at neutral (~0 degrees) to minimize ankle movement throughout the scan. Headphones and hearing protection were provided for safety and communication. While lying supine in the scanner, participants were strapped down to the table with four straps: one across the thighs at the mid-point between the greater trochanter and knee joint line, one across the hips at the anterior superior iliac spines, and two in an X pattern across the chest from each shoulder to the pelvis. Participants were also fitted with customized padding to reduce head motion. This padding was high-density MRI-safe foam that was inserted around the sides and top of the head to remove space between the skull and head coil. This was customized based on skull size. The straps and customized padding were employed to reduce head motion during imaging. A priori head motion threshold for exclusion was set at >0.35 mm of relative motion to ensure high quality data.
The methods used for the fMRI knee motor control task are based on previous literature that mapped whole brain activity and lateralization of the brain activity during isolated lower extremity movements.39,40 Similar knee specific motor tasks have demonstrated good to excellent reliability across days to weeks.41–43 Standardized auditory cues informed the participants when to move and rest, and the frequency of the movement (1.2 Hz). The participants’ dominant (right) leg rested upon a foam roller and alternated from ~40 degrees flexion to full extension, while the non-dominant (left) leg rested at full extension (0 degrees). This motion was completed continuously for 30 seconds with 30 seconds of rest (right leg relaxed at ~40 degrees flexion) for four total cycles. The participants were given an opportunity to ask questions and practice the task with feedback from the experimenter.
Prior to data collection at the MRI, participants completed a mock MRI session where they familiarized themselves with the MRI environment, restraints to reduce head motion, and the lower extremity motor task. The participants were permitted to ask questions and practice the tasks with feedback from the experimenter. The practice session included three practice blocks (30 seconds each) of the motor task with examiner cueing to ensure the participant understood the task, followed by a complete run of the task with the same feedback and timing as during the actual MRI data collection session. This standardized training and mock scanning session played a vital role in reducing head motion during the task, performing the task correctly, and ensuring participants were not claustrophobic.
fMRI scans were collected at Holzer Health (Athens, OH) using a 16-channel head coil. Prior to the functional data collection, a 3-diminsional high-resolution T1-weighted image (repetition time: 2000 ms, echo time: 4.58 ms, field of view: 256×256 mm; matrix: 256×256; slice thickness 1 mm, 176 slices, 8° flip-angle) was collected for image registration (~8 minutes). fMRI collection parameters included 10 whole-brain gradient-echo-echo planar scans per block (4 movement blocks, 5 rest blocks) acquired with a 3 second TR with anterior-posterior phase encoding and a 3.75×3.75 in plane resolution, 5 mm slice thickness for 38 axial slices with a 35 ms TE, 90° flip angle, field of view 240 mm and 64×64 matrix. The functional knee extension/flexion run lasted 4 minutes and 30 seconds. fMRI measured regional brain activity during rest and motor control conditions, which were contrasted to isolate the regional brain activity to the knee flexion/extension task.
Visual Perturbation Neuromuscular Training
All participants completed four separate one hour-long training sessions within two to three weeks. These sessions combined agility, balance, and plyometric exercises with visual perturbation training. VPNT exercises were developed based on a previous clinical commentary and methodology paper,44 detailing how chosen exercises were selected to offset the risk of initial ACL rupture and further modified to incorporate a movement goal that required the participants to interact with an external visual object or target.30,45,46 Each training session spanned one hour with rest interspersed throughout the session to avoid fatigue.
i. Agility Exercises
-
Exercise 1: The T-test involved running 6 m to tap a cone, cutting to the right or left for 3 m to tap another cone, cutting the opposite direction for 6 m to tap a third cone, returning to the center by cutting 3 m to tap the first cone, then running 6 m back to the start position – thereby running in a “T” shape. The experimenter verbally instructed the participant which direction to cut after the participant left the start position, but prior to reaching the first cone reducing ability to plan direction and anticipatory time.
-
Exercise 2: Agility ladder drills required the participant to quickly match specified foot placement patterns within the agility ladder. The experimenter used five visual aids to instruct each participant on how to perform the foot placement pattern to minimize direct explicit feedback (cones, lines etc.) and increase the salience of the SG visual perturbation.
ii. Balance Exercises
-
Exercise 1: Single-leg Romanian deadlifts required the participant to pick up and gently set down a cup at one of three locations marked on the ground (-30, 0, +30 degrees from center) at a distance equal to his or her max volitional reaching distance. The experimenter verbally instructed the participant of which location to place the cup at random. The participant alternated legs for each trial.
-
Exercise 2: Single-leg stance required the participant to stand on a foam surface while holding a light-weight bar horizontally for 30 seconds. The experimenter instructed the participant to maintain the bar’s horizontal orientation and to quickly reset her single-leg stance if the participant placed a second limb on the ground. The participant alternated legs for each trial.
iii. Plyometric Exercises
-
Exercise 1: The vertical jump task required participants to reach 80% of their max vertical jump height as measured by a Vertec, a vertical jump tester that serves as the external target during the task. Additionally, the vertical jump task incorporated an unanticipated unilateral landing, where the experimenter called out the desired landing leg as soon as the participant began the flight phase of the jump.
-
Exercise 2: The jump squat task incorporated a cognitive challenge: participants had to perform a jump squat and land facing a target in one of four locations (0, 90, 180, 270 degrees from the participant in the center); the specified location was quickly called out at random by the experimenter.
Stroboscopic Glasses
All participants initially performed all exercises without SG to familiarize themselves with the task at every training session. SG were then worn throughout all other trials for each exercise. For the first training session, SG remained at level 1 throughout the whole training session (highest frequency of fluctuation between clear and opaque states and the lowest level of visual perturbation). For the second, third, and fourth training sessions, SG remained at levels 2, 3 and 4, respectively, for the duration of each training session. SG’s opaque state duration progressively lengthened with each subsequent training session (25 ms for level 1, 43 ms for level 2, 67 ms for level 3, and 100 ms for level 4) while the clear state duration remained constant across SG levels (100 ms), thereby creating greater interruptions in the availability of visual information for the participants. This approach standardizes SG difficulty exposure for each participant.
Error Scoring System
An error scoring system (Table 1) assessed behavioral performance during training sessions. Scores are reported as counts, which reflect the number of errors incurred during each exercise. All errors are counted equally (one count per error).
Questionnaires
The Rating of Perceived Exertion (RPE) scale47 and NASA Task Load Index (NASA TLX)48–51 were presented to the athletes after each training session to assess perceived levels of difficulty performing exercises with SG. RPE assesses perceived exertion level on a scale from 0 (Nothing at All) to 10 (Very, Very Hard). Both physical and cognitive RPE were assessed. Physical exertion refers to the physical work of the athlete to perform the exercise. Cognitive exertion refers to the mental work required of the athlete to complete the exercise goal. NASA TLX assesses mental workload on six separate scales (mental demand, physical demand, temporal demand, performance, effort, frustration), each with 21-point scale gradations.
Data & Statistical Analysis
The fMRI technique used in this study quantified the BOLD signal via the hemodynamic response (blood flow) by contrasting the lower extremity motor control condition with interspersed rest conditions.52 The BOLD response quantified via fMRI collection and analysis has been validated against actual neural recordings, demonstrating a very high correlation between blood flow and neural activity.53,54 The reliability of fMRI quantification of the BOLD signal is generally high and specific to knee movement and has high inter-session reliability.43,55
The fMRI image analyses and statistical analyses were performed using the Oxford Centre for Functional MRI of the Brain Software Library.56 Image analysis began with standard pre-statistic processing applied to individual data in the standardized FSL recommended order,57 which included nonbrain removal, slice timing correction, standard motion correction and realignment parameters (3 rotations and 3 translations) as covariates to limit confounding effects of head movement and spatial smoothing at 6 mm before statistical analysis.58 High-pass temporal filtering at 100 Hz and time-series statistical analyses were carried out using a linear model with local autocorrelation correction. Functional images were coregistered with the respective high-resolution T1 image and the standard Montreal Neurological Institute template 152 using linear image registration. This registration process allowed data from each participant to be spatially aligned on a standardized brain template for comparison.
The subject-level analysis of knee sensorimotor control relative to rest was completed using a cluster corrected z-score greater than 3.1 and significance threshold of p<.05 (corrected). The cluster correction for multiple comparisons uses a variant of the Gaussian random field theory to decrease type I error in statistical parametric mapping of imaging data by evaluating the activation not only at each voxel, but also at the surrounding voxel cluster (as it is unlikely that the voxel tested and surrounding voxels are active above the threshold due to chance).59–61 The paired contrast between the pre- and post-intervention brain activity was cluster corrected with z scores greater than 3.1 and a significance level of p<.05 (corrected). This pair-wise analysis compares each individual’s pre-/post-intervention brain activity and averages those differences at the group level.
Descriptive statistics including means, standard deviations, 95% confidence intervals (CIs), and Hedge’s g effect sizes were calculated for the LESS, error scores during each training session, RPE, and NASA TLX. With this being a proof-of-concept study with a small sample size, inferential statistics were not calculated. To evaluate the impact of VPNT on these variables, Hedge’s g effect sizes were used because of the small sample size and interpreted as 0.0-0.3 as small, 0.4-0.5 as medium, and 0.6-0.8 as large.62
RESULTS
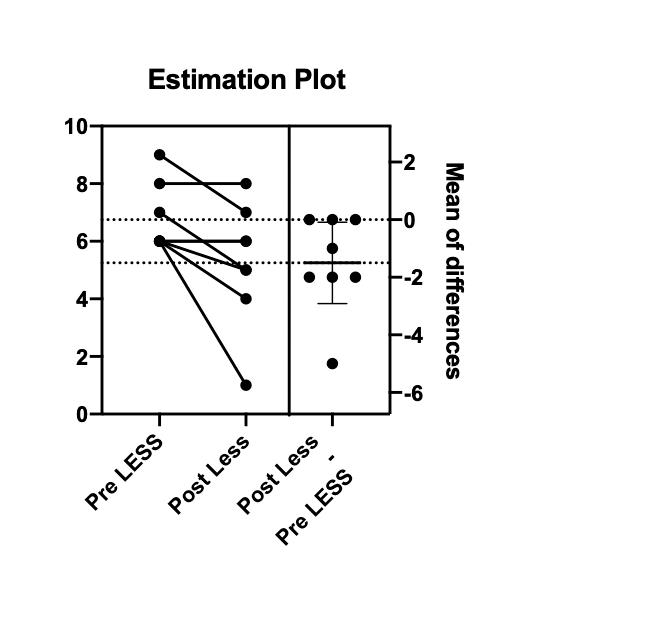
Descriptive statistics including 95% CIs and effect sizes for the LESS, error scores, RPE, and NASA TLX are provided in Table 2. All re-assessments were completed within 23 ± 4.3 days from initial assessments. LESS scores decreased by 1.5 ± 1.69 errors with a large effect size after VPNT. Regarding individual participant’s changes in LESS scores, 5 participants’ scores decreased, 3 did not change, and 0 increased after VPNT (Figure 1). Agility errors from day 1 to day 4 of VPNT had a medium effect size with decreased errors of -2.6±5.2. Lastly, RPE-C had a large effect size between day 1 and day 4 of VPNT with an increase of 1.5±2.2 points.

Regional brain activity are reported that were identified in FSLeyes based on peak-voxel with the Harvard-Oxford Cortical & Subcortical Structural Atlas,63 Juelich Histological Atlas,64,65 and the Cerebellar Atlas in MNI152 space after normalization with FNIRT66 and with FSL tool atlasquery.57 The atlasquery function from FSL utilizes the averaged probability across all voxels in the cluster to identify probabilistic anatomy across the cluster ensuring reporting of peak voxel location and overall cluster spatial representation.
The results are presented as a z-score (activation level relative to the contrast of pre- vs post-intervention) and percent signal change for each group from baseline to sensorimotor control in Table 3. By comparing pre- and post-intervention regional brain activity, reduced BOLD signals were demonstrated in two clusters following VPNT (Figure 2, Table 3): 1) left supramarginal gyrus, inferior parietal lobule, secondary somatosensory cortex (158 voxels; 4.51 z-stat; p=0.0122 cluster corrected; MNI -50,-26,34); 2) right superior frontal gyrus, supplementary motor cortex (314 voxels; 5.33 z-stat; p=0.000159 cluster corrected; MNI 16,-4,72). The clusters are the group average of the paired contrasts of each participant at pre/post timepoints (n=7). One participant was excluded from the fMRI analysis due to excessive head motion (>0.35 mm relative head motion and task correlated). Average relative head motion across the remaining seven participants was 0.11±0.05 mm and absolute head motion was 0.35±.19 mm.

DISCUSSION
Landing Scores Following VPNT
Each participant’s landing mechanics were evaluated with the LESS at pre-/post-intervention timepoints to assess VPNT effects on biomechanical ACL injury risk. There was a decrease in LESS score after VPNT, indicating that VPNT can improve landing mechanics and potentially reduce injury risk. The mean difference in LESS score after VPNT (1.5±1.69) is similar to other reports of improved LESS scores after injury prevention programs, despite the relatively shorter intervention of only two weeks.67–71 For example, an aquatic injury prevention program that only included female participants and lasted for six weeks improved LESS scores by 1.68±1.68 (p=0.004).67 Another study that included mixed-gender youth soccer teams implemented a prevention training program led by athletic trainers for eight weeks and yielded similar results (1.29±0.34, p=0.01).68 The ability of VPNT to achieve similar behavioral outcomes as traditional IPPs in a shorter timeframe could improve athlete/coach compliance for teams with limited resources and time.
It is important to note that while most participants (n=5) in the present study experienced improved landing mechanics after the intervention, some participants (n=3) did not change scores and no participants experienced worsened (higher) LESS scores. Therefore, while VPNT may preferentially improve some athletes’ landing mechanics more than others, no athlete experienced worsened performance after training. In comparison to previous studies67,71 that used LESS to measure an injury prevention program’s efficacy and reported an increase in LESS score post-intervention for some select participants, the current study may lack such findings due to the individualized nature of the training sessions, the addition of SG and external focus feedback, or small sample size. Further, Gholami et al.26 showed that training with visual information disruption improved landing mechanics in a larger study with athletes who already completed post-op ACL reconstruction rehabilitation.
Motor performance errors were tracked during each training session that consisted of objective, clinical-friendly measures of motor performance (e.g., the number of times an athlete placed their opposite foot down during a single-leg balance task). As SG difficulty increased with each training session, the error scores did not substantially change between Day 1 and Day 4 of training for all exercises except for the agility ladder drills, which had a medium effect size of decreased errors (Table 2). Taken together, the training effects on error scores indicate that progressing SG difficulty between levels 1 through 4 does not impair motor performance as assessed by our clinician error scoring system (Table 1). Therefore, decreasing the amount of visual information available to athletes with SG did not hinder participant’s ability to complete their desired movement goals/objectives during training.
BOLD signal and Neural Activation Patterns following VPNT
Another aim of this study was to quantify the brain activation changes after VPNT during a knee flexion/extension task. Cluster 1 of decreased activation included the left supramarginal gyrus, inferior parietal lobule and secondary somatosensory cortex, indicating increased neural efficiency (i.e., reduced neural activity demands) in visuospatial/visuomotor processing,72–76 somatosensory integration, and attention.77–79 Cluster 2 of decreased activation included the right superior frontal gyrus and supplementary motor cortex, indicating increased neural efficiency in motor planning.80,81 Overall, neural efficiency in both clusters may reflect training effects from VPNT, which aimed to improve neuromuscular control and the neural activity associated with baseline high injury risk landing mechanics (e.g., increased visuospatial and sensorimotor neural activity).82 Decreased activity in both clusters aligns with motor skill learning83–85 and improved expertise86,87 specific to lower extremity motor control. Recently, Grooms et al.,88 similarly examined brain activation changes during a knee flexion/extension task in healthy female athletes who underwent neuromuscular training with implicit augmented biofeedback and identified an association between sensory neural activity changes and improved landing mechanics.
The current results are also similar to prior work by Seidel et al.87 that measured brain activity with functional near-infrared spectroscopy during balance training, finding decreased neural activity pre to post-training in the primary motor cortex and inferior parietal lobe to maintain postural stability. The similar regions of decreased activity secondary to improvements in lower extremity motor control (the current study) and postural control (Seidel et al.87), despite the differences in intervention (multimodal balance training87 vs. VNPT) and testing (fNIRS vs. fMRI), may support the key role of proprioceptive processing and motor planning neural efficiency to improve motor performance.
In addition to decreased localized neural activity demands, neural efficiency can be a function of enhanced connectivity between supporting regions. Previous work using resting-state fMRI identified increases in fronto-parietal connectivity following dynamic balance training, where participants had to maintain the horizontal positioning of an unstable stabilometer platform for repeated 30 second intervals.85 After two ~45 minute training sessions spread over two weeks, intrinsic functional connectivity increased between the supplementary motor cortex and parietal cortex. These results following balance training align with the results of the current study, as VPNT (four, 1-hour training sessions spread over two weeks) facilitates functional activity changes in fronto-parietal regions (clusters 1 and 2 of the current study) that could support enhanced connectivity.
Physical and Cognitive Training Demands
There were no substantial changes in physical or cognitive training demands across the intervention as assessed with the RPE-P and NASA TLX. There was an increase in RPE-C, indicating that VPNT preferentially increases cognitive demand over physical demand. Overall physical and cognitive training demands were largely maintained by increasing the visual perturbation dosage each session. One might expect a decrease in training difficulty and demand over time if the SG were not worn, as the athletes experience practice and learning effects for the exercises. Furthermore, of the six metrics measured with the NASA TLX, “frustration” tended to score the lowest. This suggests SG is not aversive to athletes during exercise, which is important for clinicians who want to ensure that their patients have adequate “buy in” and do not become frustrated with the technology.
Clinical Implications
This study utilized SG to perturbate vision during agility, balance, and plyometric exercises in female recreational athletes. By comparing pre-/post-intervention brain activity during a knee flexion/extension task, the results show that VPNT has the potential to modulate somatosensory, visual, and motor neural activity. Promoting increased neural efficiency in visuomotor and visuospatial regions of the brain, VPNT may have the ability to improve neuromuscular control and movement efficiency. Additionally, subjective reports of frustration with SG were low, and our athletes’ motor performance (error count) was not substantially worsened by progressing SG difficulty. Therefore, SG is an attractive, novel modality that warrants further research in future studies that apply visual perturbation training to populations with a maladaptive, increased reliance on vision for motor control (e.g., patients with ACLR).89,90
Limitations
While the reliability of fMRI quantification of the BOLD signal is generally high and specific to knee movement has high inter-session reliability,43,55 this study is limited by the lack of a control group and small sample size (n=8). Thus, the analyses included 95% CIs and effect sizes instead of inferential statistics to illustrate this proof-of-concept pilot study.
The inclusion of a control group, who underwent the same intervention without SG, would allow the authors to delineate whether the results were driven by visual perturbation, neuromuscular training, or their combination. However, published reliability data indicates that no change in the neural activity metrics should be expected across this timeframe if engaged in regularly daily activity, increasing probability that the intervention induced the changes.41 The inclusion of only high injury risk female athletes may prevent the generalization of these findings to non-female athletes and athletes with low injury risk landing biomechanics. And it is reasonable that VPNT may not be as effective in athletes who already display good landing mechanics. Finally, due to practice trials and performance of four or more recorded trials for the LESS, there was potentially a learning effect of the LESS which could have influenced the scores. However, the practice trials are necessary to ensure the LESS is being performed correctly to complete the assessment, and these methods have demonstrated high reliability.32 Controlling the total number of trials completed (practice and recorded) may be beneficial for a larger clinical trial.
Future Directions
Future research may explore VPNT training effects with a longer timeframe (such as six or eight weeks), VPNT training effects in other populations (such as males, the aging, or patients with ACL injuries), or whether the behavioral and neuroimaging effects of VPNT are resilient against time (e.g., 3-month follow-up). Patients with ACL injuries may preferentially benefit from VPNT as they exhibit increased LESS scores relative to uninjured controls91 and an increased reliance on visual information processing to guide motor control.92,93 Future research is needed to examine task-based connectivity following VPNT, as the current study provides support for the use of primary and secondary motor regions and parietal cortex as key regions of interest. Also, the incorporation of 3D motion capture would enable future researchers to increase their sensitivity to movement metrics altered by VPNT. Future research is needed to compare an intervention group to a control group to provide further validation for this proof-of-concept study. Finally, future clinical trials with larger sample sizes should also consider potential factors that could limit reproducibility and reliability of the collection including the learning curve of examiners training individuals, the length of training sessions, and the cost of MRI.
CONCLUSION
This proof-of-concept pilot study evaluates the potential of VPNT to alter landing mechanics, neural activity, and physical/cognitive training demands in uninjured female recreational athletes. The findings suggest that visual perturbation training improves landing mechanics and visuocognitive abilities simultaneously by promoting neural efficiency in brain regions responsible for sensorimotor integration, visuomotor/visuospatial processing, and motor planning.
Conflicts of interest
The authors declare no competing interests.
Funding
This study was supported in part by the US Department of Defense Congressionally Directed Medical Research Program Peer Reviewed Orthopaedic Research Program Research Award (81XWH-18-1-0707) and NIH/National Institute of Arthritis and Musculoskeletal and Skin Diseases NIH/NIAMS; Awards NIAMS; R01AR076153 and R01AR077248. Opinions, interpretations, conclusions, and recommendations are those of the author and are not necessarily endorsed by the Department of Defense and NIH/National Institute of Arthritis and Musculoskeletal and Skin Diseases.
Acknowledgments
We thank the Holzer Health system and Holly Henry MRI technologist and Dr. Phillip B. Long radiologist for MRI support.
Data Availability
The datasets generated during and/or analyzed during the current study are available from the corresponding author on reasonable request.