


INTRODUCTION
Injury to the musculoskeletal system perpetuates concurrent and responsive neuroplastic alteration to the central nervous system that impacts quality of function.1,2 Recent objective real-time quantitative electroencephalogram (qEEG) neurophysiological assessment techniques have been identified to monitor neural adaptive structural and functional changes of the brain that impact functional movement patterns in pre- and post-injury status.1,3 Measuring neural activity of the brain during functional tasks offers clinicians objective data to evaluate and monitor regulatory functional properties of the brain-to-body connection offering insight to assist in identification of disturbances in musculoskeletal function leading to less than optimal biomechanical utility.4 Disturbances in the neural excitability and neuroplastic properties of the brain impacts neurophysiological function of the Central Nervous System (CNS) leading to altered motor responses during functional activities.1–4 Targeting the neuroplastic properties of the brain and CNS have become a primary goal for sports medicine professionals and athletes during both training and injury rehabilitation progressions. The ability to objectively track and monitor neurological structural and functional changes in the brain’s state that affect musculoskeletal function may allow for the optimal management of training and rehabilitation protocols. qEEG has been suggested as a metric for monitoring brain states and brain function as they relate to functional motor performance.1
Similar to functional Magnetic Resonance Imaging (fMRI) of the brain, qEEG reflects changes in the state of the brain related to workload of the different brain regions.5 However, fMRI techniques are not practically applicable for the assessment of dynamic and functional movements.1,3 In addition, the static fMRI images provide limited time windows of brain activity which limits the conclusive alterations associated with musculoskeletal function.5 qEEG offers consistent objective assessments of brain state and the ability to adapt to the changing environment.6
Assessing qEEG brain activity while performing functional movement in healthy uninjured athletes will provide normal objective performance indicators of neurophysiological function. Such baselines can serve as real-time performance properties that assume the brain state is adequately in sequence with the peripheral neurological properties.5,6 Such performance benchmarks can be used as comparative norms to help establish standards for athlete readiness to participate in sport. Therefore, this prospective investigation evaluated neurophysiological responses to performance of task-driven activities using an innovative neurophysiological assessment technique of qEEG monitored neurophysiological responses to establish a comparative benchmark of performance capabilities in healthy, uninjured Division-I athletes. Such baseline data may be used to measure neurophysiological changes as related to degradation and/or improvement of brain state over time.
METHODS
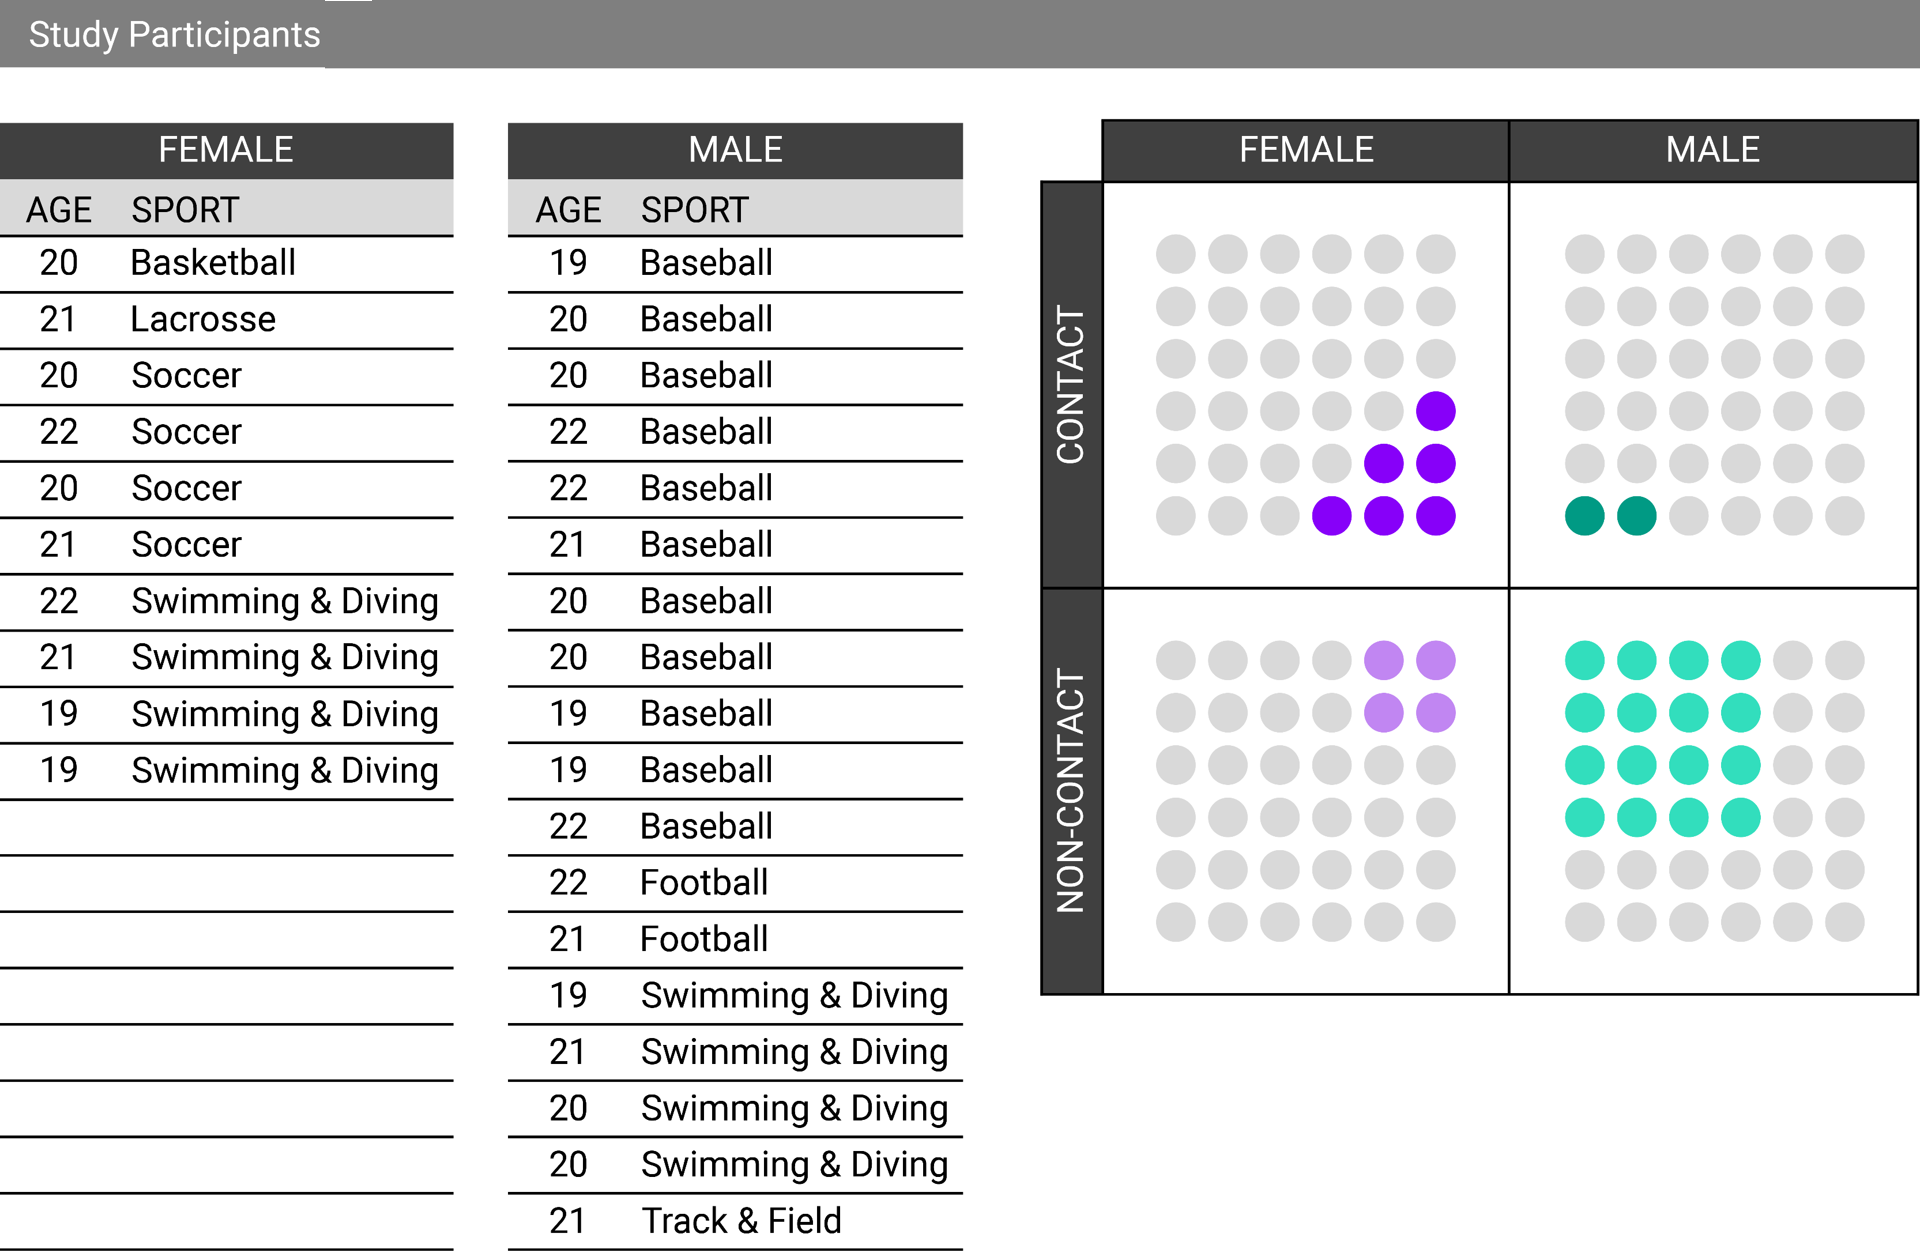
Twenty-eight uninjured NCAA Division-I athletes qualified and consented to participate in this IRB approved prospective case series designed study. Athletes were excluded from participation if they presented with a current injury, a current history of an attention deficit, anxiety, or history of injury that resulted in disqualification from play in the prior six months. The twenty-eight athletes (10 females and 18 males) participated in a variety of competitive sports including both contact and non-contact.
Neurophysiological Assessments
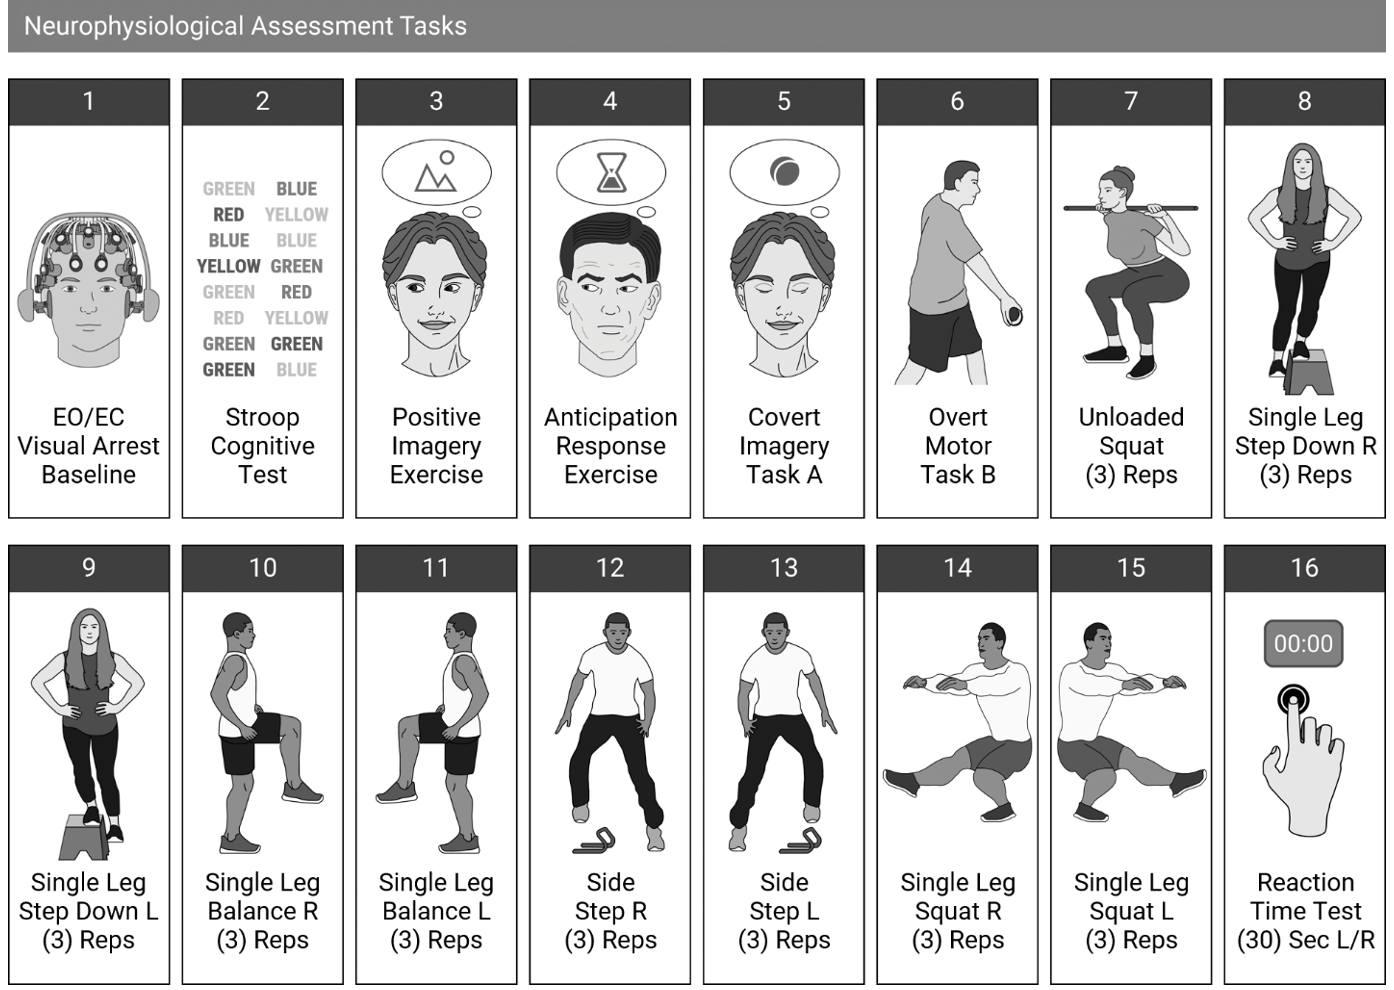
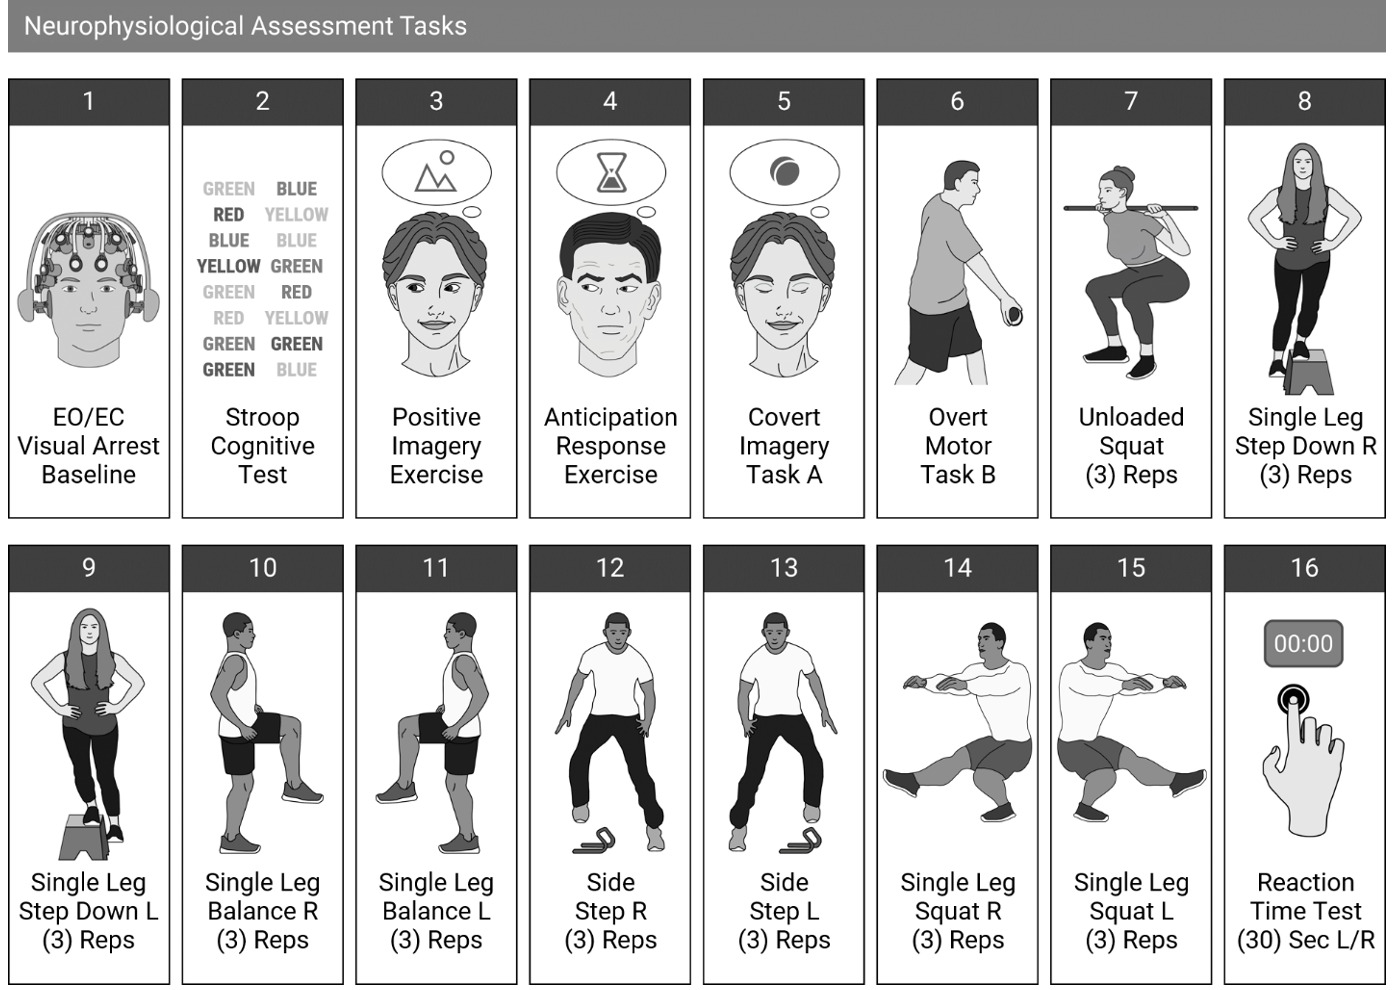
Quantitative electroencephalography (qEEG) is a modern clinical digital assessment used to measure electrical patterns at the surface of scalp which reflect a continuous measure of cortical activity and are referred to as “brainwaves” and assess the central nervous system processing efficiency, power spectra, amplitude, and connectivity. qEEG was used to investigate real-time brain electrical patterns and neurophysiological function as it relates efficiency, power spectra, amplitude, and brain connectivity during functional movement tasks associated with sport. qEEG data were collected during a single testing session of baseline measures where each participant performed a uniform series of cognitive, motor imagery, reaction time and physical functional motor tasks (Figure 1). Baseline data were established by monitoring qEEG brain wave activity during periods where participants sat with eyes closed and eyes open. Once the qEEG baseline was established, participants performed a variety of tasks, including a cognitive test, overt imagery and a corresponding covert activity, functional movement exercises (balance, single limb, and agility tasks) and a reaction time test. Motor imagery was performed before and after five functional movement tasks as previously published.1,7 Functional movement tasks emphasized balance, gait, mobility and lower extremity symmetry.8–10
-
EO/EC Visual Arrest Baseline – Participants sat in a resting state for one minute with their Eyes Closed (EC) and one minute with their Eyes Open (EO), followed by two minutes with eyes open EO and two minutes with EC. CLR AdvantageTM then compared raw EEG signals collected during EC vs EO periods to provide a neurologic baseline from which to process data collected during subsequent assessment tasks. This baseline provided analytics derived from EEG channels, including frequency band power and ratios, band and ratio topo-plots, and the performance of brain Regions of Interest (ROIs).
-
Stroop Cognitive Test – Participants viewed a 30-second series of congruent and incongruently colored words (“Blue”, “Green”, “Red”, “Yellow”) while using a PC mouse to click on particular words correctly rendered in matching colors. CLR AdvantageTM recorded the number of correct and incorrect responses to assess participants’ speed and ability to discern incongruencies. The Stroop Cognitive Test is a common method to measure psychological performance in athletes, and is used to measure speed of processing, executive function and selective attention.
-
Positive Imagery Exercise – Participants imagined a pleasing scene or memory for 30 seconds. Positive Imagery is important to either recreate a good past performance or create a current positive new experience which can optimize performance, enhance focus and concentration, and improve self- regulation of heart rate, breath rate, and galvanic skin response.
-
Anticipation Response Exercise – Participants waited 30 seconds for a stressful audiovisual interruption after being told to expect such by investigators. The exercise is used to measure stress, arousal levels, Galvanic Skin Response, diaphragmatic breathing, and how quickly a participant can recover from a perceived stressor.
-
Covert Imagery Task A – Participants focused on a screen-centered white star then responded to a 30-second display of randomly alternating colors (green, red) by imagining tossing a ball into a basket with their right (green) or left (red) hand.
-
Overt Motor Task B – Participants focused on a screen-centered white star then responded to a 30-second display of randomly alternating colors (green, red) by actually tossing a ball into a basket with their right (red) or left (green) hand. Together, Covert Imagery and corresponding Overt Motor Tasks are used to stimulate and measure Mirror Neuron Network activation. Overt is the act of physically directing eyes to a stimulus and covert is mental shift of attention without physical movement. This indicates whether the participant learned from the covert action to better replicate movement during the overt action.
-
Unloaded Squat – Participants repetitiously (3X) squatted into a 90-degree knee flexion position while maintaining an upright torso and holding an unloaded rod overhead with arms fully extended and feet shoulder width apart in a sagittal plane. Part of the Functional Movement Screen, the Unloaded Squat is used to measure a subject’s bilateral, symmetrical functional mobility of hips, knees and ankles.
-
Single Leg Step-Down Right – Participants repetitiously (3X) stepped down from a 10" pedestal with their right leg.
-
Single Leg Step-Down Left – Participants repetitiously (3X) stepped down from a 10" pedestal with their left leg. Part of the Functional Movement Screen, the Single Leg Step Down exercises are used to measure a subject’s dynamic knee function, hip and trunk strength and biomechanical and kinematic deficiencies.
-
Single Leg Balance Right – Participants repetitiously (3X) maintained balance for 30 seconds, while raising their right leg to a perpendicular angle with a rest period of 15 seconds between each repetition.
-
Single Leg Balance Left – Participants repetitiously (3X) maintained balance for 30 seconds while raising their left leg to a perpendicular angle with a rest period of 15 seconds between each repetition. Single Leg Balance tasks were initiated with the non-weightbearing leg flexed to approximately 30 degrees from a hands-on-hips position. Part of the Functional Movement Screen, the Single Leg Balance tasks are used to measure a subject’s balance, joint stability and proprioception.
-
Sidestep Right – Participants repetitiously (3X) led with their right leg to step over a set of three 6" low hurdles before stepping back to the starting position.
-
Sidestep Left – Participants repetitiously (3X) led with their left leg to step over a set of three 6" low hurdles before stepping back to the starting position. Part of the Functional Movement Screen, the Sidestep tasks are used to measure a subject’s gait mechanics, compensation and asymmetry.
-
Single Leg Squat Right – Participants repetitiously (3X) maintained balance for 30 seconds while squatting from a hands-on-hip position to a 90-degree knee flexion angle on their right leg with the left leg extended.
-
Single Leg Squat Left – Participants repetitiously (3X) maintained balance for 30 seconds while squatting from a hands-on-hip position to a 90-degree knee flexion angle on their left leg with the right leg extended. Part of the Functional Movement Screen, the Single Leg Squat tasks are used to measure a subject’s balance and control, strength of lower body, postural malalignments and kinematic and biomechanical deficiencies.
-
Reaction Time – Participants focused on a screen-centered white star then responded to a 30-second display of randomly alternating colors (green, red) by clicking a PC keyboard with their right (red) or left (red) index finger. CLR AdvantageTM recorded the speed and accuracy of responses. This Reaction Time Test is a common method to measure responsiveness in athletes
Cognitive tasks, including a Stroop Test, Positive Imagery Exercise, and Anticipation Challenge were designed to stimulate and measure cognitive functions. The Covert Imagery Task and companion Overt Motor Task were designed to stimulate and measure Mirror Neuron Network (MNN) activation. MNN is a critical component of the brain’s social cognitive function in action recognition, imitation, learning, and understanding the intentions and observations behind others’ actions. These neurons are excited during incidences when an individual performs or observes a motor skill which stimulates exclusive motor functions. Nine physical tasks including: an unloaded squat; single leg step down (right and left); single leg balance (right and left); sidestep right, sidestep left; and single leg squat (right and left), as well as a scored Reaction Test, were designed to stimulate Mirror Neuron Network activity while measuring regional connectivity and hemispherical asymmetry. These tasks also enabled measurement of attention levels and workload capabilities.11,12
Neurophysiological Assessment Platform
Investigators utilized a CGX9 (Cognionics Company, San Diego CA) Quick-20r v2, 21-channel dry EEG head set to collect continuous electrical brain activity while simultaneously completing the the functional movements. Chi, et al.7 found this system to be a reliable and valid method to measure evoked response potentials as repeatable signals were seen when a standardized test protocol approach is used as compared to traditional wet, wired EEG systems. The dependent variables of cognitive function, attention, workload capability, and Sensorimotor Rhythm (SMR) asymmetries were monitored.1,12 Each measure accounted for acute real-time neurophysiological compensation and accommodations to physical and cognitive tasks.13,14 Additional physiological measures were conducted as secondary dependent variables to examine participants’ physical performance during each Neurophysiological Assessment Task. These measures included: heart rate to examine stress, anxiety and ability to relax15; heart rate variability to examine the ability regulate emotion, attention and breathing16; respiration rate to examine stress, concentration and ability to minimize distraction17; trapezius muscle tension to examine asymmetry and injury predisposition18; galvanic skin response to examine fatigue, emotional arousal and anticipation19; and peripheral temperature to examine the participant’s ability to regulate stress response.20 Physiometric data was collected with the CGX AIMTM (CGX, a Cognionics Company, San Diego CA) physiological device.
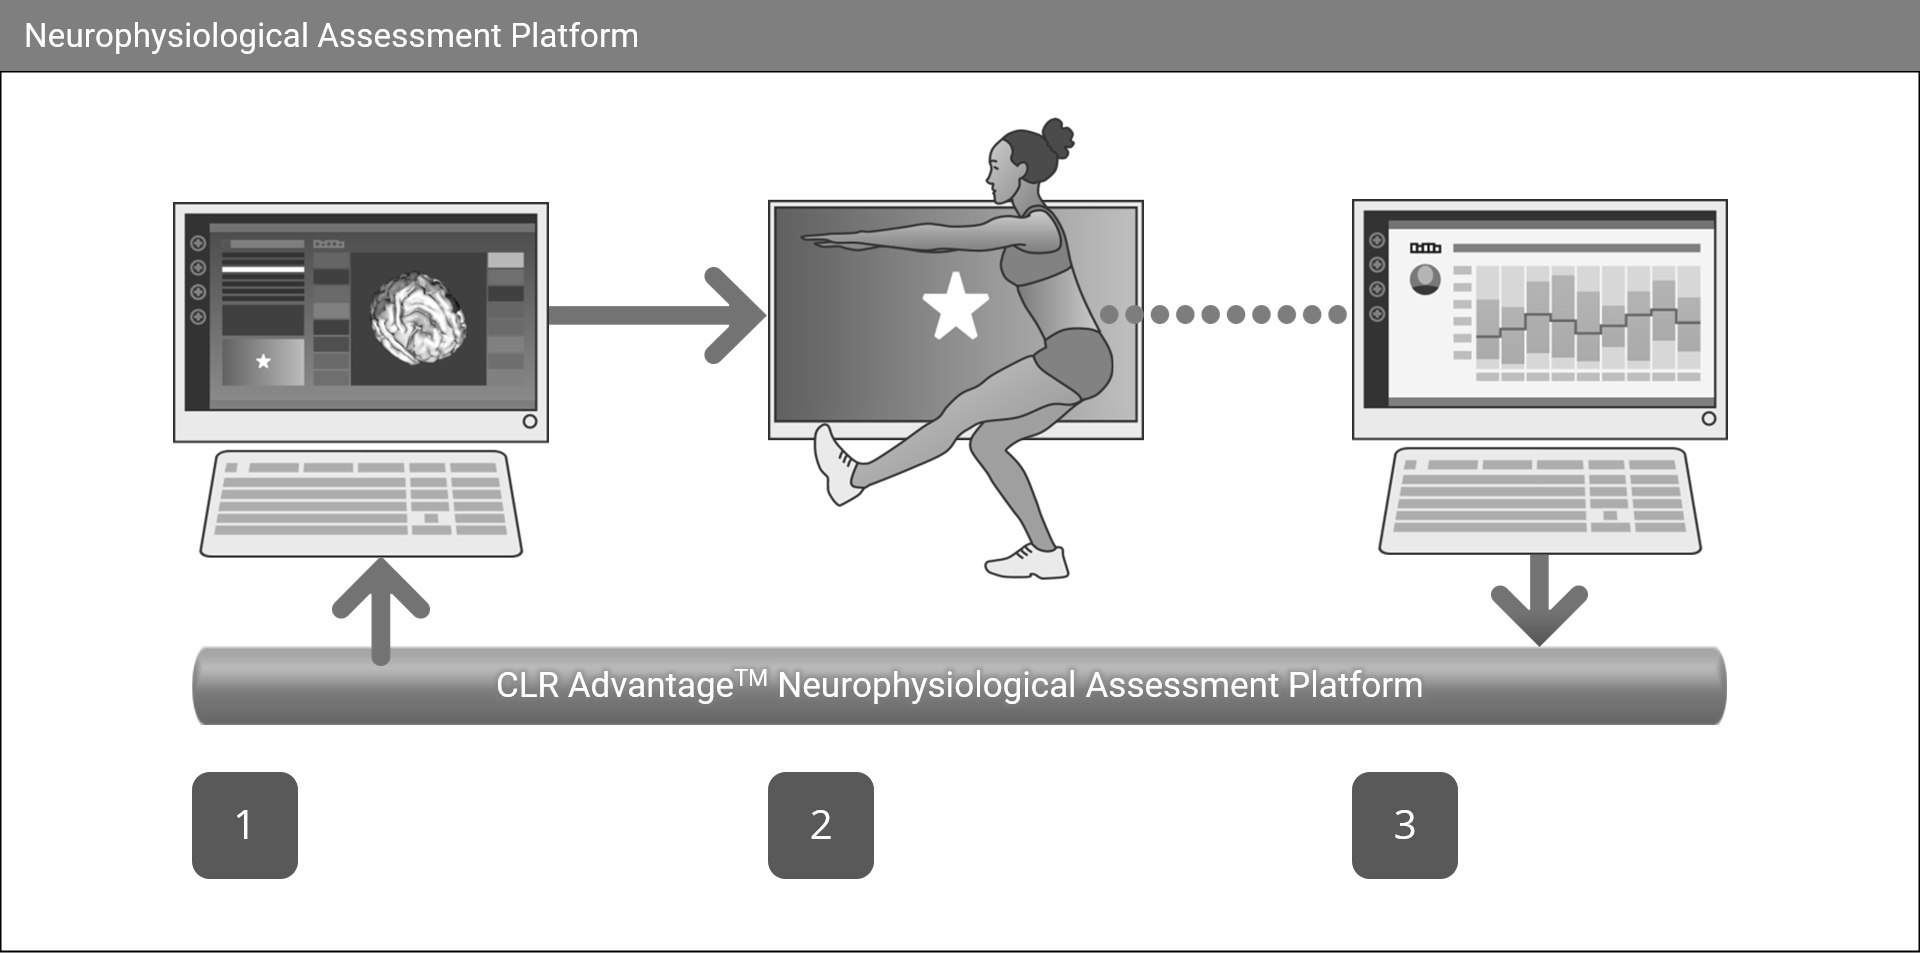
The CLR AdvantageTM (CLR Neurosthenics® Manhattan Beach, CA) Neurophysiological Assessment Platform and the CGXAIM were utilized to simultaneously collect, process and analyze neurophysiological data from the brain and physiological monitoring through electrical data from the body. The CGX devices were then used to stream continuous biometric data via wireless connection to CLR Advantage. This configuration allowed participants to perform various physical tasks without restriction. After confirming the quality and consistency of CGX signal data, CLR Advantage was used to guide participants through the series of preprogrammed neurophysiologic assessment tasks. As investigators selected each task from a remote assessment screen (Figure 2, Step 1), CLR Advantage would display corresponding visual cues and instructions for participants to follow on a separate screen (Figure2, Step 2). Upon completion of each assessment, CLR Advantage would utilize Intheon NeuroscaleTM to generate analytic reports for each participant (Figure2, Step 3). CLR Advantage was also used to collect preassessment profile and medical history data from each participant.1

The EEG and physiologic data screen were designed to capture the most relevant and incisive athletic performance metrics. With 21 channels of continuously streaming EEG, investigators were able to collect data to determine participants’ neural network connectivity, activation, asymmetry and frequency bands levels during each neurophysiological assessment task. The data collected supported sufficient Power Spectral Density (PSD) levels to measure performance across multiple networks and regions of interest including: a) Default Mode Network (medial prefrontal cortex, posterior cingulate cortex, Hippocampus, precuneus, inferior parietal lobe, parietal regions and temporal lobe); b) Salience Network (anterior insula and dorsal anterior cingulate cortex); c) Mirror Neuron Network (inferior frontal cortex and in the inferior parietal cortex, d) Attention (dorsal frontoparietal); e) Sensorimotor Cortex (primary somatosensory cortical area and the primary motor cortical area); and, f) Occipital Lobe (visual processing center ). PSD levels also provided sufficient data to calculate performance within EEG frequency bands, Including: g) Delta (0.5 to 4Hz); h) Theta (4 to 7Hz); i) Alpha (8 to 12Hz); j) SMR(12 to 15Hz); and k) Beta1-3 (12 to 30Hz
Power spectral analysis (PSA) is a common and well-established method for analyzing EEG signals.19 PSA uses a power spectrum to quantify the amplitude of each frequency component in the EEG waveform. PSA estimates the power of a signal at different frequencies.
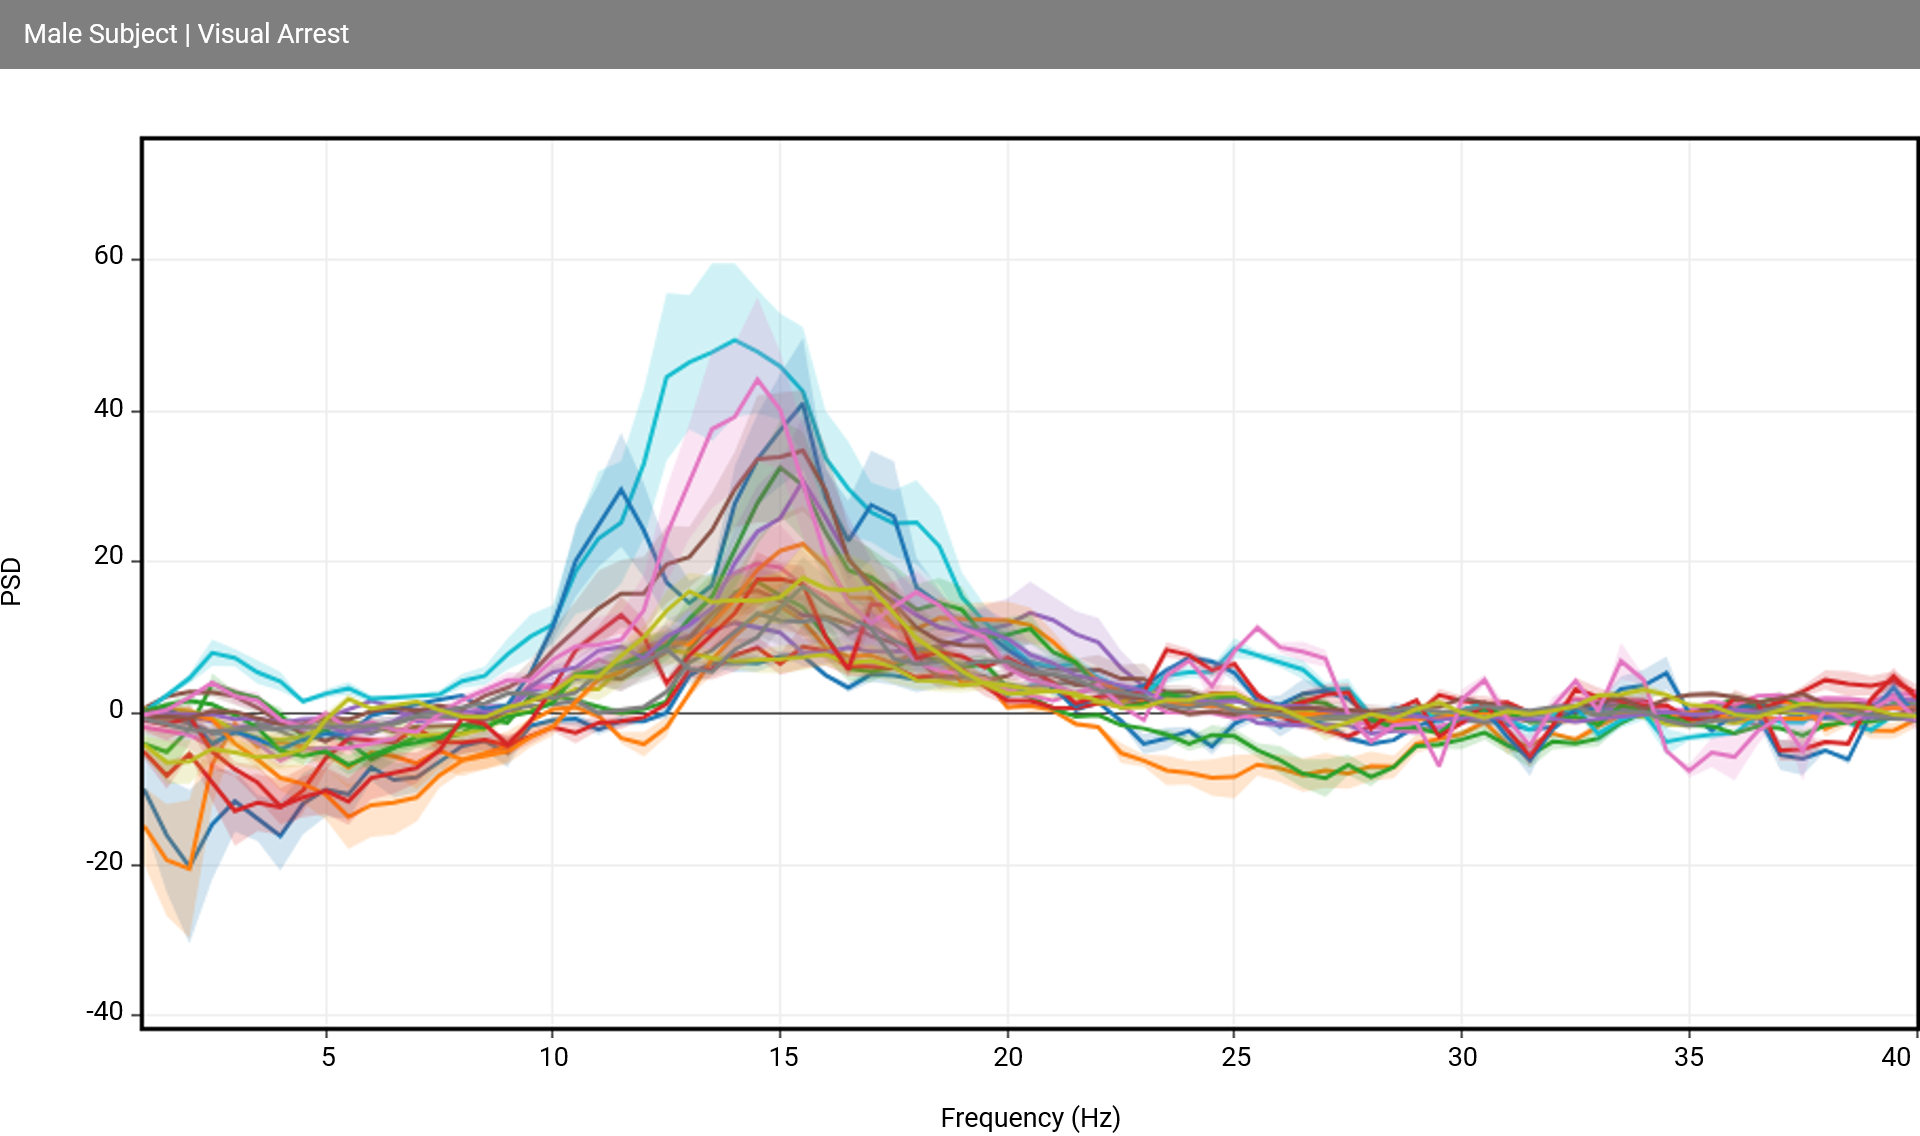
Spectral analysis comparison between power and frequency bands was measured at the change between Eyes Open (EO) and Eyes Closed (EC). The Welsh20 method was used for spectral density estimation and used for estimating the power spectral density analysis and then used 1/frequency (F) normalization to convert to decibels. The raw EEG compared EO versus EC during resting states and analytics based on measurements per channel, across all channels, right and left hand as well as different brain regions, frequency bands, frequency band ratios and Regions of Interest (ROI). Figure 3 represents a sample Power Spectral Density (PSD) assessment of a male participant.
_example.png)


Upon completion of each participant assessment session, collected data was further processed to calculate individual performance metrics, data aggregation, exponential smoothing (by task) and generation of sub-cohort (uninjured, male/female) analytics. The CLR Advantage Neurophysiological Assessment Platform was utilized to analyze participants’ Individual Performance Reports (IPRs) then compare those results to that of the study sub-cohort (uninjured male and female athletes). IPRs may be used to identify neurophysiological deficiencies and provide clinically valuable information to the rehabilitation specialists, coach, or athlete themselves about how the reacts and accommodates based on the demands of their sport and/or position. Four reports generated include:
-
Pre vs Post Motor Training Task Report provides results from the cognitive metrics as a comparison from motor imagery baseline periods before (pre) and after (post) the motor training tasks. The report includes: SMR Asymmetry (the average S MR (13-15 Hz) Asymmetry for the Mirror Neuron Network Regions of Interest (ROIs) averaged together and computed from the motor imagery periods before and after the motor training tasks); Analysis by Channels (analyses and statistics for all channels with power spectral analysis plots for pre motor imagery vs post motor task); Analysis by Sources (analyses and statistics using Regions of Interests (ROIs) as determined by source localization); Cortex Activity (plots showing the difference in pre vs post motor imagery task frequency band powers as T-scores computed for all ROIs, by each hand, and mapped onto a 3D cortex [Figure 6]).
-
Pre vs Post Mirror Neuron Network Connectivity Report provides Connectivity Analyses (MNN Network), including connectogram plots21 (visual representations of neural connections in the brain) showing Pre vs Post (motor imagery) differences in effective connectivity (a multivariate Granger Causaliy22 measure) between selected cortical regions of interest following standardized Low Resolution Electromagnetic Tomography23 sLORETA source localization.
-
Motor Training Task Session Report provides Cognitive Metrics (showing the average Attention and Workload metrics computed across the entire session); SMR Asymmetry Over Time (showing the average SMR [13-15 Hz] Asymmetry for the Mirror Neuron Network ROIs averaged together over time); and Power Bands (with line plots of the frequency band powers (dB) for all channels across the entire session).
-
Individual Session Visual Arrest Report provides: Analysis by Channels (with Power Spectra Channels, BandPower Channels, BandPower Bands / Ratio Topoplots); and Analysis by Sources (with Power Spectra Sources, BandPower Sources, BandPowerRatio Cortex Plots).

RESULTS
The mean age of participants was 19.37 ± 1 years (females 19.8 years; males 19.1 years); height = 176.75cm ± 8.05 cm (females 167cm; males 186cm); weight = 79.38 ± 14.36 kg females 67kg; males 84kg). (Figure 7)

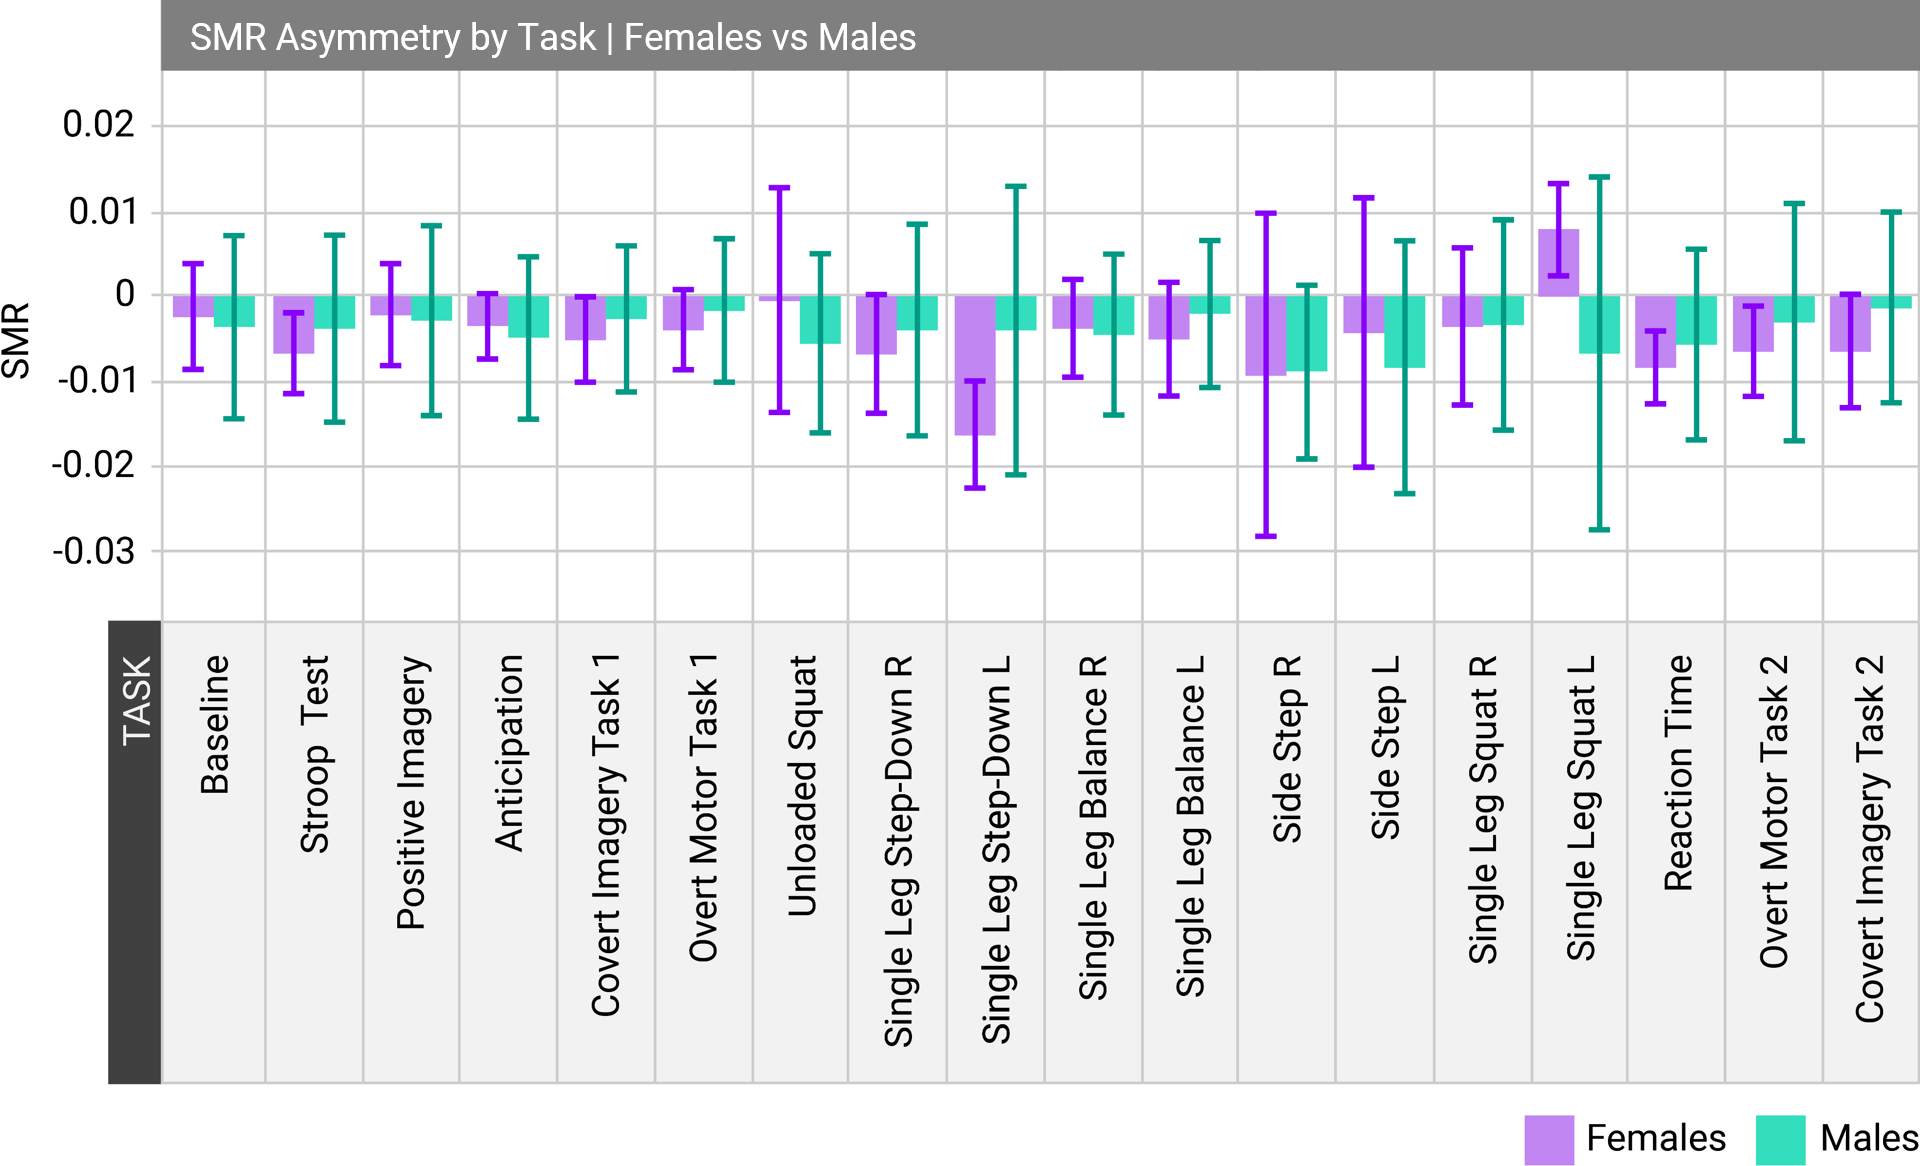
Analysis of the qEEG data of the male and female athletes in this case series demonstrated asymmetries during motor strategies during the step down left, single leg squat and the unloaded squat. Females performed better in the single leg squat and unloaded squat while males performed better on the step-down landing left task. These findings were also supported by the SMR Cortex plots. These cortex plots illustrate characteristics for both male and female, regions of interest, frequency bands of the EEG and network activation during assessment of motor tasks that emphasize balance, gait, mobility and lower extremity symmetry. (Figure 8)
.png)
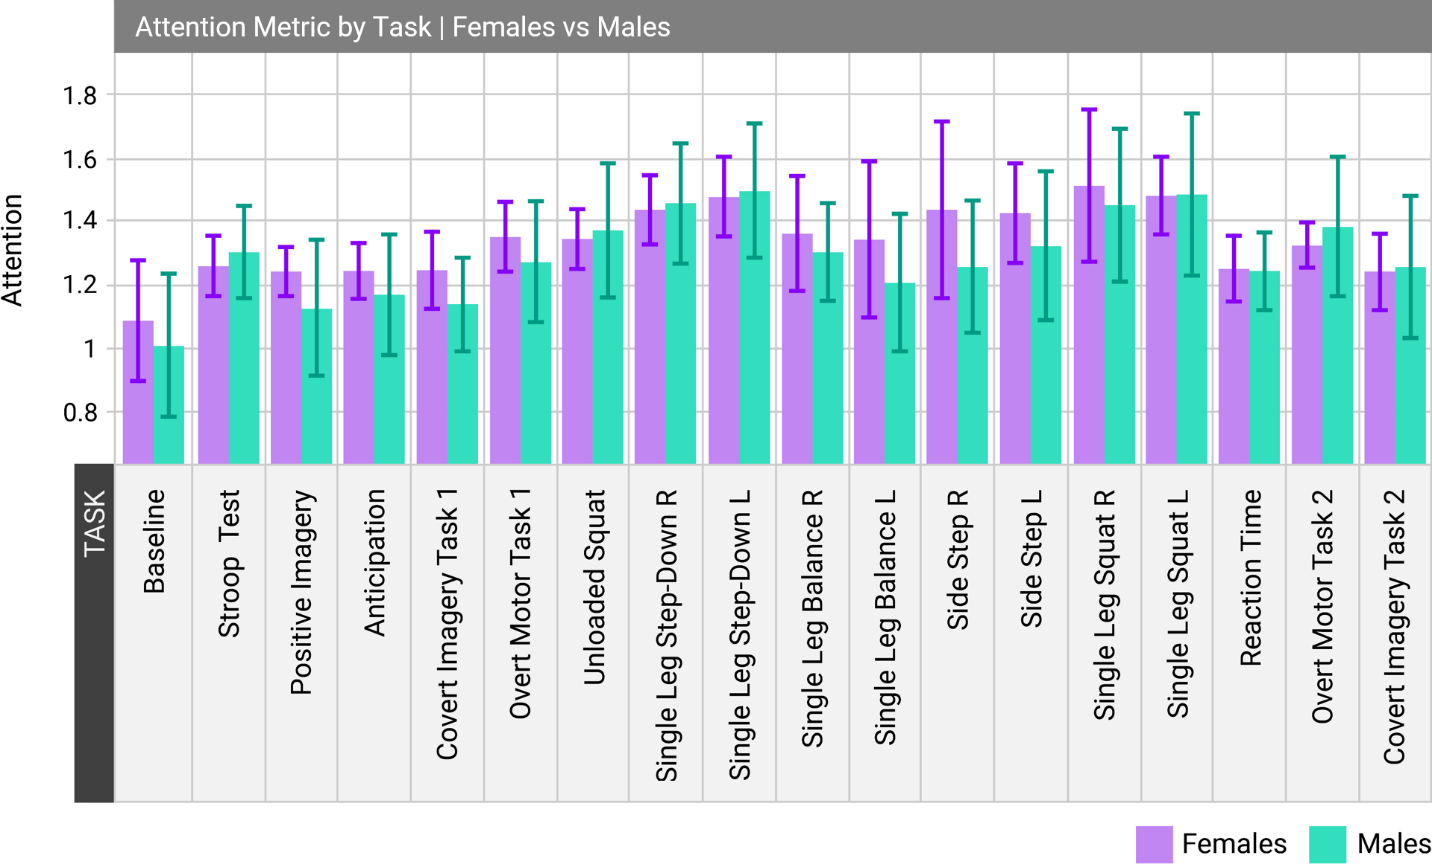
Attention Metric
The Attention metric indicates the ability to maintain goal-directed behavior in the face of distractions. The metric composites were measured during the performance of the functional movement tasks, covert and overt imagery, and cognitive tasks. The attention metric is calculated utilizing frequency band ratios of frontal theta and beta/alpha. Attention increased consistently for both females and males until the single leg balance task as represented in Figure 9.

Brain Workload Metric
Brain workload is related to the brain region(s) of interest engaged through electrical connections during the performance of tasks being performed. The workload metric indicates how the brain responds to the activities being engaged. Results from previous studies have shown that there is a significant difference between men and women in terms of brain workload capability.24 Figure 10 indicates the brain workload metric by task for both females and males. Females’ cognitive workload capability was higher than males beginning at the initial baseline task. Monitoring brain workload in tandem with other key components, such as, attention and focus provide insight as to the effect certain tasks may tax the brain state.
.png)
Pre- and Post-Motor Task SMR Asymmetry
Resting state utilized a spectral analysis comparison between power and frequency bands measuring the delta between EO and EC. The EEG cortex plots illustrate characteristics of various networks for both males and females, and activity in both left and right hemispheres during select functional movement tasks. The EEG cortex plots demonstrate longitudinal EEG for the initial brain map baseline, cognitive tasks, motor tasks and mental imagery. Females exhibited more symmetrical pre- and post- motor task. (Figure 11)

DISCUSSION
The primary objective of this case series was to utilize neurophysiologic assessment data, including brain hemisphere asymmetry, attention levels, and brain workload analytics to quantify performance outcomes in healthy, uninjured athletes during functional movements.1,12 The results demonstrate variances in functional tasks between uninjured Division-I athletes (males and female) in key performance indicators of cognitive function, attention, brain workload capability and SMR asymmetry were observed. Musculoskeletal biomechanical asymmetries or disfunction have been previously reported to be associated with variations in muscle and brain symmetry between left and right hemispheres.25 The reported data affords a visual representation of neurophysiological performance observed during with qEEG monitoring during performance of task driven assessments. This provides researchers and clinicians alike with a possible mechanism to explore neural behaviors, brain symmetries, and brain state regulation associated with normal movements.
Current applications in rehabilitation have increasingly embraced the concept of neural-oriented rehabilitation methods to facilitate neuroplastic adaptation. The brain has multiple cell types that divide and grow, thus developing new connections throughout a lifespan.26 Plasticity is a hallmark of the adaptability of the brain to remodel, adapt, and repair the central nervous system as a result of purposeful interventions using environmental modifications and brain exercises to stimulate neurofeedback improvements.27,28 In a similar fashion, neurological assessments provide insight into the functioning properties of the neural brain-to-body connection.
Sports medicine professionals are familiar with the concept that skeletal muscle cells do not divide with conditioning, but brain cells can divide and precipitate plasticity.26 It is incumbent upon the rehabilitation specialist to be cognizant of the role of the brain’s adaptability and changes that are seen in the pre- and post-injury periods. Dysregulation and rebuilding of neural networks during functional development and during the rehabilitation process are the hallmarks of neuroplasticity. Mangine et al.1 used high fidelity real-time qEEG and physiometric monitoring software to demonstrate simultaneous linear improvements in neurophysiological and musculoskeletal performance in a case report of an athlete after anterior cruciate ligament reconstruction and rehabilitation during a return to play progression. Although in a single subject, these findings suggest changes in the brain’s neuroplastic properties impact musculoskeletal function.1 Thus, clinicians should seek to objectively evaluate brain state during functional training and/or rehabilitation progressions.
Division I athletes possess elite levels of human performance capabilities in strength, agility, balance, reaction time and focus.24 Until recently, measuring these capabilities was largely limited to sport statistics, kinematic observation (time trials, jumping distance, etc.)24 and various strength assessments (bench press, leg press, etc.).29 Over time, the proliferation of sports related injuries has warranted investigations into the role the of the brain-to-body connection30 in athletic performance, including both psychological factors31,32 and neurological function.33
There is a need for methods to support assessment of facets of neuroplasticity as part of functional rehabilitation and the development of athletic skills. The current case series provides information gained from neurophysiologic assessment that demonstrates a foundation utilizing analytics from task-driven exercises to evaluate and benchmark athletic performance capabilities and may assist optimize rehabilitation outcomes within the sports medicine field.
Embracing rehabilitation interventions designed to optimize brain and body performance seems ideal for monitoring athlete preparedness in both clinical rehabilitation and sports performance. Recent findings1 have reported dysregulation in qEEG brain mapping occurs following anterior-cruciate injury and/or reconstruction. Mangine et al.1 demonstrated a functional correction in brain state regulation to be related to improved neurophysiological outcomes, such as, reaction time and task completion during a rehabilitative return to play process following an anterior cruciate ligament repair in a single subject. A dysregulated brain state appears to disrupt neuroprocessing necessary to maintain biomechanical and functional stability associated with sport performance and injury prevention mechanics.7,33 Future studies could utilize neurophysiological baseline data and progressive assessment information to aid in decision making concerning management and rehabilitation of the injured athlete**.**
This case series is a first requisite step in building a body of evidence connecting physical activities and brain functional responses among healthy athletes. Using a combination of qEEG, physiometrics, psychometric, and kinematic applications to monitor change in neurophysiological performance post musculoskeletal injury seems warranted but requires more specialized targeted programs for behaviors associated with brain process for motor control, skill development, and biomechanical sport functions. Future studies should investigate the use of neurophysiological assessments to help determine brain regulatory status and functional readiness to return to athletic participation. Additionally, advanced understanding of brain activity to coordinate neuromuscular function during sports participation may assist sports medicine professionals in examining strategies to mitigate injuries.
Limitations
The neurophysiologic assessments were performed on healthy non-fatigued, uninjured Division 1 athletes using musculoskeletal movements associated with sport and rehabilitation. Fatigue factors have been shown to have a relationship with functional performance34 and were not accounted for in this case series. qEEG data were not collected during actual sport participation, so maximal strength and maximal speed likely not reached by each participant. The task driven activities were limited to controlled movements requiring the brain and body functioning together supporting clean analytics by limiting extraneous EEG “noise” during data collection. Notwithstanding, outcome measures from the current study are unique in combining qEEG, physiometric, and physical movements**.**
Conclusions
The data collected in this case series supports the potential use of the combination of qEEG and physiometric data as a novel neurophysiological real-time measurement to serve as a clinical assessment for establishing comparative baseline normative data for athlete performance. In addition to the unique utility of qEEG and neurophysiologic as an assessment for baseline data, qEEG assessment could provide meaningful data to support clinical decision making and clinical intervention choices. Performing qEEG assessments in tandem with functional movements may allow clinicians to gain insight into the athlete’s potential readiness for participation and safe return to play, related to brain health and neurophysiological function. The authors hope that this work will be to empower sports medical professionals to consider quantitative information concerning the brain’s role in motor function as it relates to motor performance and rehabilitation in athletic or functionally active populations.