

INTRODUCTION
Upper extremity injuries are common in competitive baseball and account for up to 49-58% of all reported injuries in collegiate baseball and Major League Baseball (MLB) with upper extremity injuries accounting for 75% of total time lost from the sport.1,2 Injury rates are not uniform across the baseball season with the highest number of injuries occurring during the start of season.3,4 In the MLB, the highest injury rate was during April (the first month of seasonal play) and declined each month with the lowest injury rate in September (the final month of play).3 High rate of preseason injuries are not unique to baseball, with many other sports, such as soccer and football, demonstrating increased risk for overuse injuries during the beginning of season compared to the remainder of the season.5,6 Most research in the preseason focuses on the use of assessments to identify those who are most likely to become injured, however there is little information regarding training loads during the preseason that may lead to overuse injuries early in the season. Increased preseason training load is particularly important for baseball pitchers, who experience the highest rate of injuries compared to other position players.7,8 Pitchers are uniquely at risk for elbow and shoulder injuries due to the high demand of the position, requiring angular velocities at the elbow greater than 2000 degrees/second and maximum shoulder external rotations over 150 degrees.9
A main theory associated with the high rate of injuries in pitchers is the high number of throws during training throughout their career. As an early specialization sport, many youth baseball pitchers solely train for baseball year-round, increasing the stress at the upper extremity without proper recovery.10 The relationship between increased number of throws and injury risk in youth and high school players has led to some preliminary guidelines regarding the number of throws a player should complete over the course of a game and season. The MLB published guidelines for daily maximums for pitch counts in youth to collegiate baseball, suggesting that collegiate pitchers should not throw more than 120 daily pitches and require five days of recovery when throwing more than 106 pitches.11 These data are the aggregate of pitch counts; however pitch counts often underestimate the total number of throws.12 Pitchers are likely surpassing these thresholds regularly, especially during times when exact pitch counts are not monitored, such as preseason training.
The most common method of measuring workload is through the pen and paper method and counting each individual throw which is cumbersome and requires either accurate recall or immediate attention to tally the throw.13–15 Another method that is often used to quantify workload is the use of ball velocity.16,17 Ball velocity, particularly during fastballs, increases over consecutive games17 and players with higher ball velocity have increased risk of elbow injury.16 Despite these relationships between increased ball velocity and injury, decreasing ball velocity would be counterproductive to performance and therefore it is not feasible to reduce ball velocity as a method of decreasing training load. In contrast to objective measures, rating of perceived exertion has also been suggested as a proxy for workload,18 however, rating of perceived exertion measures more internal workload rather than an external workload and may not accurately represent effort.19
Wearables are becoming the most popular method of measuring workload in many sports, especially in traditional running sports such as football and soccer.2,20,21 Football and soccer often use global positioning systems to quantify distance covered during training and games as a proxy for workload.22,23 More recently, inertial measurement units (IMUs) have been used to identify kinematic patterns in baseball to quantify throwing workload.24,25 Kinematics include a variety of measures including arm slot, angular velocity, arm stress, and shoulder rotation, however the most accurate measure is angular velocity.26,27 Furthermore, the forearm is the most accurate place for sensors in baseball, rather than the proximal arm closer to the shoulder.28 Therefore, the authors quantified workload as angular velocity from throws through a single IMU on the forearm. Using forearm angular velocity, the purpose of this study was to quantify the number of throws and workload, as defined by angular velocity, during preseason training in a collegiate baseball season.
METHODS
Participants
Nine NCAA Division I baseball pitchers from the same college program volunteered to participate in this study. The recruited participants were from a sample of convenience from the same college program in the Chicagoland area. All participants were free of injury during study participation which limited the number of included participants. The University’s Institutional Review Board for biological research approved all procedures and participants provided written informed consent prior to participation.
Procedures
An observational study was conducted to collect all data during practices in real time on a baseball field during preseason over six weeks. Pitching data were captured using a single IMU (MBIENTLAB, MetaMotionRL) placed approximately 1-3 inches proximal to the throwing wrist of the pitcher. All movements were captured at 100Hz and the forearm detection threshold was set at 800°/second, meaning that any movement was classified as a throw if the forearm velocity was greater than 800°/second.29 This forearm velocity threshold was set to include all throws during practice including low intensity throws (classified as a toss with lower angular velocity) while excluding warmup plyometrics and other exercises when the arm movement was below the threshold.29 The angular velocity threshold of 800°/second was confirmed as an appropriate threshold during pilot testing in the fall season to identify all throwing behaviors during training, including short distance tosses and pitches from the mound.
All sensors along with their charging stations were distributed to the pitchers. All participants were instructed on sensor placement, sensor calibration, and sensor charging. At the beginning of practice, participants connected their sensor to their personal profile in the 4D Motion Sports application on an iOS device. After calibrating the sensor, they placed it in the sleeve on an arm band where it remained secured throughout the session. At the end of each practice session, the sensors were returned to their charging docks after ending the data collection module. The participants were responsible for connecting and wearing the device during practice. During preseason training, there were no instances of participants throwing outside of scheduled practice. Raw data were exported through the commercially available mobile application (4D Motion Sports, Inc.) and analyzed using MATLAB.
Data Analysis
Total number of throws for each pitcher for each day pitched was recorded as the number of times the angular velocity threshold (800°/second) was met. Peak angular velocity was extracted for each throw because it is the most consistent variable using the IMU.27 Total workload for each day was calculated as the median peak angular velocity for each day multiplied by the total number of throws for the day and divided by 100,000 so that the acute workloads ranged from 0-5, similar to previous measures of workload.30–32 Each player’s acute workload was calculated as the average workload for each seven-day period and chronic workload was calculated as the rolling workload across the previous 28 days.33 An acute to chronic workload ratio (ACWR) was calculated for each week and each player for an overall ACWR during each week of preseason.
Statistical Analysis
Average of the peak angular velocity for each week, total number of throws pitched during each week, and ACWR for each week were summarized as means and standard deviations for each pitcher. The group average of acute workload and ACWR for each week of preseason was calculated to compare weekly workload progression. A repeated measures ANOVA with pairwise comparisons was used to compare workload between weeks. As an observational study with a sample of convenience, power was not calculated, however, the number of participants is similar to previous studies.27,34 Cohen’s d effect sizes with 95% confidence intervals were calculated for all significant differences and were interpreted as weak (<0.21), small (0.21-0.39), medium (0.4-0.7), or large (>0.7).35 Statistical significance was set a priori at p < 0.05. All statistical analyses were performed in SPSS (version 29, IBM, Armonk, NY).
RESULTS
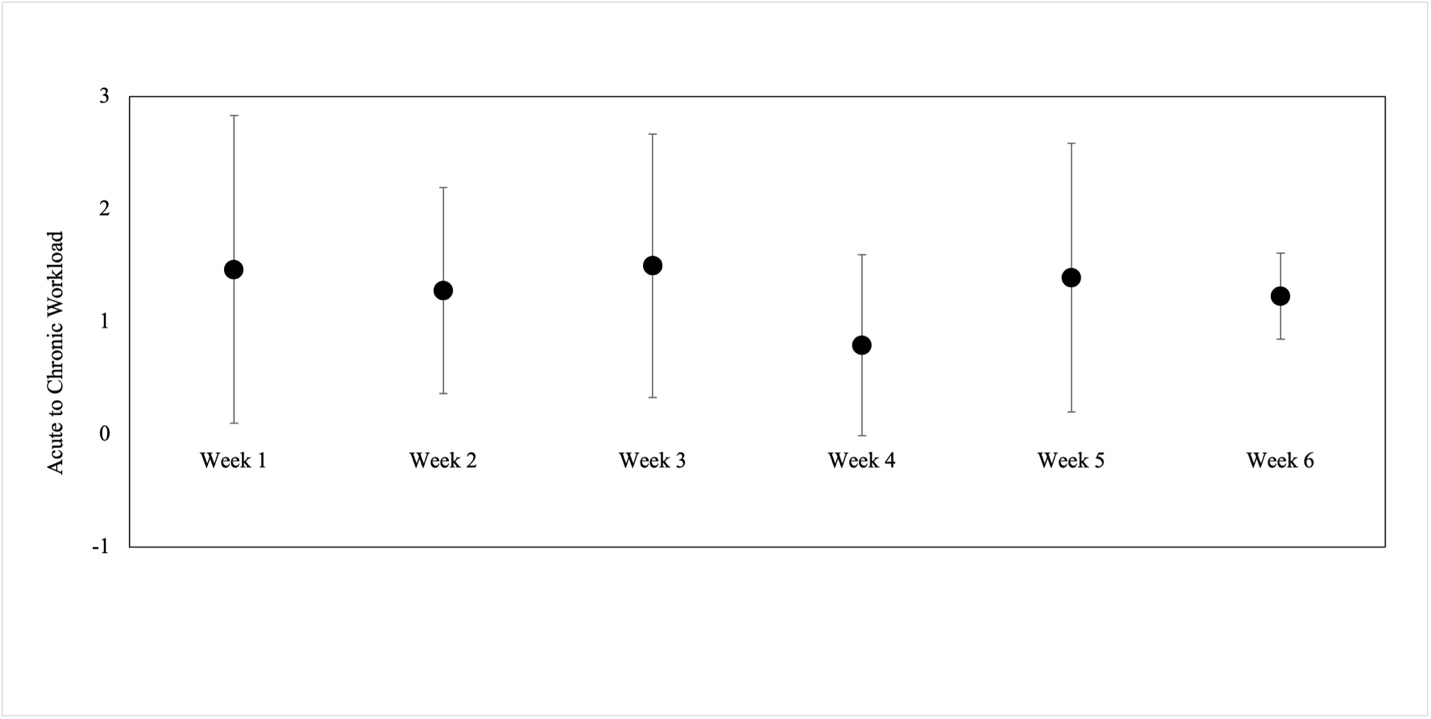
The nine included participants were 20.89±1.69 years of age, 1.88±4.66 meters tall, weighed 91.41±8.56 kg, and had 2.44±1.59 years of collegiate experience. The pitchers in the current study averaged 1990.6±881.7 throws throughout preseason at an average angular velocity of 1686.2±334.9 m/s (Table 1). The average number of throws each week ranged from 216-487 during preseason, with the greatest number of throws occurring during week 5 (Figure 1). Acute workload was reduced in Week 4 compared to Week 2 (p=0.018, d=1.73) and Week 3 (p=0.007, d =2.30) (Figure 2). Week 4 ACWR was also reduced in compared to Week 3 (p=0.021, d =0.71). Weeks 1, 2, 3, and 5 of preseason had an ACWR above 1.27 (Figure 3).


_mean_and_standard_deviation_for_each_week_of_presea.jpeg)
DISCUSSION
The purpose of the current study was to quantify workload in collegiate baseball pitchers during preseason training. The pitchers in this study had a variety of weekly throws, ranging from as few as 51 throws in a week to more than 700 weekly throws. ACWR was significantly greater on Week 3 of preseason in comparison to Week 4, with a large effect size. Acute workload was significantly greater on Weeks 2 and 3 compared to Week 4 with a very large effect size. This suggests that workload was high throughout the six-week preseason with only one deload week (Week 4). The decreased ACWR in Week 4 was not due to decreased number of throws (Figure 1), however was likely the result of a decreased angular velocities during Week 4 (Figure 2). Participation in preseason training is associated with decreased injury risk36 and increased in-season aerobic performance37 and coaches consider preseason as an avenue to increase fitness as quickly as possible to prepare athletes for in-season performance, however increases during preseason need to be progressive to improve physical abilities, technical skills, and endurance for seasonal play. In baseball, the seasonal demand for pitchers largely depends on pitching role, with starting pitchers throwing more than relievers.38 Pitchers who throw more during season have higher chronic workloads and need to be exposed to increasing workloads, especially during preseason, to allow for physiologic adaptations to the high workload demands of the position and reduce injury risk. When the acute workload increases too much (over a seven-day period) in comparison to chronic workload, injury risk increases.32 This is particularly evident for pitchers with an ACWR greater than 1.27, which the pitchers in this study surpassed during four of the six weeks in preseason.39 Further, significant changes in ACWR is associated with risk of upper extremity injury in collegiate baseball pitchers.40 This supports that many of the pitchers were at increased risk for injury during the end of preseason and the beginning of season play.
Preseason injuries during practice across all collegiate sports are higher than during in-season practices.41 This has led to more research regarding workload monitoring during preseason training to better understand how to progress training to best prepare for the season. Researchers in soccer have consistently reported increased training intensity during preseason compared to in-season.42,43 Greater internal and external loading during preseason has led to larger conversations regarding designing training programs during preseason through progressive overload.33 Progressive overload principles in training suggests a gradual and systematic increase in the workload over time exposes the muscles and tissues to increasingly greater loads without surpassing load capacity. Progressive overload requires three concepts: the floor, ceiling, and time33 and coaches may need to consider all three when designing the preseason training plans for individual pitchers. The floor represents an athlete’s current capacity, and the ceiling is the required capacity for the position. Ideally, there is little difference between the two, however, when there are larger differences, the athlete needs time to progressively increase workload to reach and maintain the ceiling. These concepts have successfully been applied in other sports, such as rugby, using technology to monitor workload and progressively increase the workload over the preseason period.44 Current baseball progressions include a variety of throwing quantities and distances and often have ACWR spikes above the safe range.45 Recently, there has been some evidence to suggest that IMUs can assist with baseball throwing progressions during season,25 however more research is needed to define successful guidelines for preseason and in-season training in pitchers and maintain safe workload demands.
The calculation of ACWR in the current study followed previously described concepts and calculations of workload, however utilized angular velocity to define throwing intensity rather than ball velocity or valgus load.16,39 Angular velocity is the most consistent variable in the 4D Motion sensors27 and provides a unique measure of upper extremity demand during throwing without estimating the exact valgus at the elbow through kinematic measures.26 Larger angular velocities at the elbow are associated with higher intensity throws and lead to increased stress.46 Through calculating workload as the median angular velocity for the training day multiplied by the total number of throws, we were able to account for both the volume and intensity of throws for the day. Utilizing angular velocity may provide a framework for future preseason training protocols to optimize training without surpassing the ACWR threshold for safe workload.
There were some limitations in the current study. The IMU captured most throws, however, there were instances when participants completed a throw that was not recorded through the capture algorithm. Although these instances were rare, there were still some throws that may not have been accounted for in the overall workload. The authors took this into account in the calculation of ACWR by utilizing the median angular velocity for daily intensity rather than the mean, which could be skewed based on outliers. Therefore, the authors do not expect the results to shift significantly from the few dropped throws in the dataset. There was not complete adherence from all participants in the study, with a few not wearing their sensors during all sessions in preseason training. Despite these missing data, the authors were still able to capture thousands of throws during the six-week period. Rest days were not monitored; however, this would be taken into account in the acute workload calculation. The study utilized a small sample of participants, which may impact generalizability of these data. In the future, the authors plan to include more participants to account for missing data from lack of adherence. Lastly, the results from this small sample of collegiate baseball pitchers may not be applicable to other baseball levels (e.g., high school and professional). Future studies should explore changes in angular velocities in other baseball levels and larger, multiteam studies.
CONCLUSION
ACWR was above the 1.27 threshold during four of the six weeks of preseason, suggesting that there may be a need to reduce overload over the course of the collegiate preseason in baseball. Increased workload over a short time may be associated with greater upper extremity injuries during preseason in collegiate baseball. Monitoring throwing workload using peak angular velocity through a single IMU may provide valuable insight to the sports performance team to prevent chronic overuse injury. Reducing ACWR below 1.27 throughout preseason and season play in throwing sports may reduce injuries. Additionally, this methodology can be used to design progressive overload training during the preseason.
Conflict of Interests
The authors have no conflict of interests to disclose.