
INTRODUCTION
Achilles tendinopathy is the most common overuse-related injury in runners,1,2 with an approximate 52% lifetime incidence in recreational runners.3 In a retrospective study, development of pain in the mid-portion (2-6 cm proximal to the insertion) occurred in 66% of cases, while Achilles insertion pain occurred in 23% of cases.4 Pain is particularly pronounced during activities that load the Achilles such as running, jumping, walking uphill, or going up and down stairs.5,6 The etiology of Achilles tendinopathy is not agreed upon, but is believed to result from mechanical overuse and likely involves inflammation in the acute stage6–8 and is accompanied by tendon degeneration in the chronic stage.4,6 Once tendinopathy has progressed to the chronic stage, continual peripheral nociceptive input may cause changes in central sensory processing and modulation.9–11 Chronic upper and lower extremity tendinopathies have shown changes in sensory processing: shoulder impingement syndrome,12 lateral epicondylalgia,9,13 and Achilles tendinopathy.10,11 Some trials, however, have not found any sensory processing differences compared to controls in Achilles tendinopathy.14 These adaptive changes in the nociceptive system may contribute to the persistence of pain observed in trials of conservative therapy for chronic Achilles tendinopathies.7,15–18
Exercise, to reload the plantarflexion musculature through eccentric contractions or using heavy-load, slow speed concentric and eccentric contractions, can make clinically important improvements in pain and function, and has been given the highest clinical practice guidelines rating of evidence (Grade A).19 Despite this high recommendation, approximately 20-50% of those affected by Achilles tendinopathy may have continued pain symptoms at long-term follow-up after a three-month intervention.15–18
A common rehabilitation intervention that has been used to reduce acute and chronic pain conditions is transcutaneous electrical nerve stimulation (TENS).20 Technically, the term TENS refers to any type of electrical current that crosses the skin, however, to many clinicians and patients the term TENS has become synonymous with electrical stimulation that is delivered at a comfortable intensity. The mechanisms of comfortable sensory-level TENS include pain inhibitory pathways comprising the periaqueductal gray area of the brainstem and the rostral ventromedial medulla that inhibit central sensitization of dorsal horn neurons in the spinal cord.21 Evidence of the effectiveness of TENS to reduce pain has been mixed, very likely because of differences in how it has been dosed.22–25
One type of less commonly used electrical stimulation, noxious electrical stimulation (NxES), involves the delivery of electrical stimulation at much higher intensities that are painful but tolerable.26 The mechanisms of NxES would be similar to that of TENS; however, NxES also activates the well-known pain modulatory phenomenon called diffuse noxious inhibitory control (DNIC) in animals or conditioned pain modulation (CPM) in humans, which is the inhibition of pain in one area due to pain elicited in another part of the body.27,28 The areas of the central nervous system that are activated include the locus coeruleus in the dorsal pons; a major source of noradrenaline in the brain.29,30 The locus coeruleus sends projections to the subnucleus reticularis dorsalis in the medulla and the resultant pain modulation is thought to involve the arousal and stress responses as well as inhibition of sensitized neurons in dorsal horn.29–33 Pain modulation due to DNIC has been studied extensively in animal models and advances in MRI technology have resulted in fMRI studies that have shown that acute noxious conditioning stimuli in humans is also associated with changes in activity in similar areas of the central nervous system as the animal models,32 thus illustrating that the mechanisms underlying CPM appear similar to those of DNIC.
Recently, a published case report demonstrated a successful recovery after a 20-minute NxES intervention of a runner with chronic bilateral Achilles tendinopathy, after the patient had failed to progress with an eccentric loading program.34 Therefore, the purpose of this study was to describe the changes in pain sensitivity and self-reported function in runners with chronic Achilles tendon pain following sequential treatment with NxES followed by eccentric plantarflexion exercise.
METHODS
Participants
Participants were recruited through flyers posted around the campus community, at local running shoe stores, and at trailheads of running/walking trails. The inclusion criteria were individuals with Achilles tendon pain (mid-portion or insertional) for at least three months duration, who self-identified as actively running at least three days per week for at least the prior month. Subjects with unilateral or bilateral Achilles tendon pain were included. Participants were excluded if they had any significant medical issues such as cardiac history, neurological disorder, psychological disorder affecting ability to perform interventions safely, and/or any additional chronic injury outside of the Achilles. Each participant went through an informed consent process and physical examination to confirm the diagnosis by two physical therapists (BJE and SKS). The physical exam included palpation of the Achilles tendon to confirm pain and to examine for the presence of swelling as well as the performance of single leg calf raise or hopping to confirm pain with loading of the Achilles tendon. Additional screening was performed to rule out any potential referral from the lumbar spine and lower quarter, including adverse neural tension. This study protocol was approved by the IRB at Arcadia University. Study enrollment and participation took place between December 2012 through November 2013.
Intervention
The intervention was split into two treatment phases (see below for details). The first phase lasted one week during which the subject utilized NxES surrounding the painful portion of the Achilles tendon. Subjects with bilateral symptoms were treated with NxES bilaterally. The second phase totaled ten to eleven weeks (six weekly visits and a one-month follow-up) and included eccentric exercises for the plantarflexors/Achilles, core strengthening exercises, and quadriceps and hamstring stretches. All subjects were also educated by two physical therapists (BJE and SKS) to continue with their running routine and follow the pain-monitoring model for progression and regression of running volume. The pain-monitoring model has been proposed as a means to adequately dose the mechanical loads on the Achilles tendon using subjective pain reports.35
Phase 1: NxES
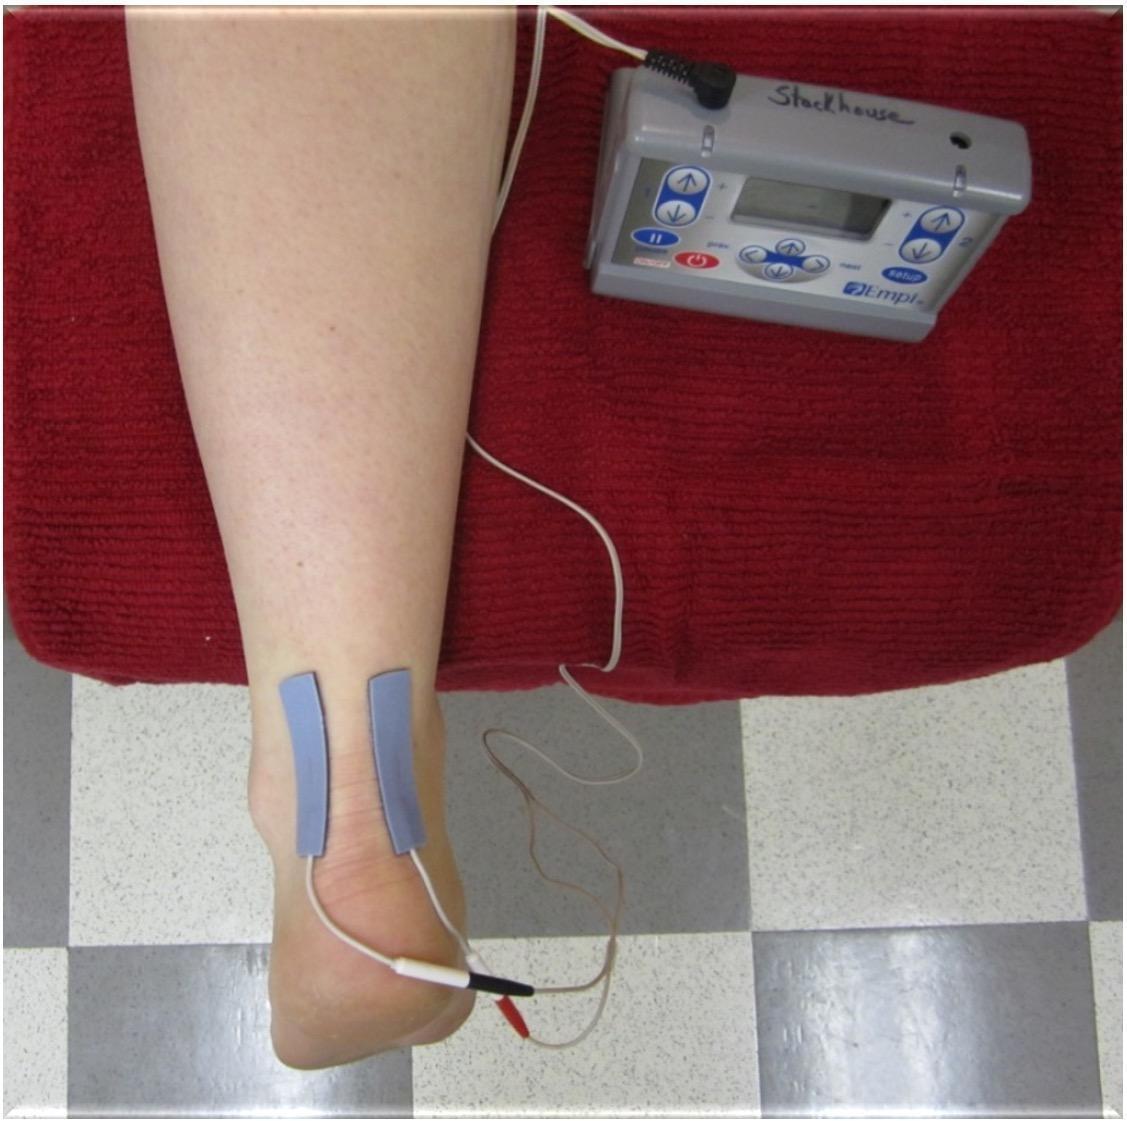
Participants performed NxES on their first day in the lab, and were given verbal and written instruction of how to set up and perform the NxES at home. Subjects kept a log of their NxES use and current intensities reached during the treatments. NxES was delivered using an Empi 300PV (DJO, LLC, Vista, CA, USA) portable electrical stimulation device and two self-adhesive electrodes (Supertrodes, 2x2 inch, SME, Inc, Wilmington, NC, USA) that were cut down to 1cm x 5cm and placed on the medial and lateral borders of the affected Achilles tendon to bracket the painful area (Figure 1). Noxious electrical stimulation was performed only during the first week of treatment, where participants were instructed to use NxES at home on any days that they experienced Achilles pain symptoms upon loading the limb when getting out of bed in the morning. Parameters were set and locked on the device to be delivered for 20 minutes with a cycle timing of 10 seconds on (including a 2-second ramp-up time) and 10 seconds off, at 150 pulses per second, and a phase duration of 400µs. The intensity of the stimulus was dosed to reach a sharp, prickly, buzzing/vibration sensation that was rated as 5-7/10 on a 0 to 10 numeric pain rating scale. The current amplitude (in mA) was recorded by the participant for sensory threshold, as was the initial stimulation intensity that produced the 5-7/10 pain rating on each day of use. Current was allowed to be adjusted by participants to maintain a 5-7/10 pain rating throughout the 20-minute NxES treatment.
Phase 2: Exercise Program
After one week of treatment, NxES was discontinued. After reassessment, a plantarflexion eccentric exercise program was taught, performed, and written instructions with illustrations were provided to start the second phase of treatment. Participants were instructed to complete 3 sets of 15 eccentric plantarflexion contractions (knee extended) two times a day, seven days per week (Table 1). The load was adjusted to reproduce a mild symptom in the Achilles with pain less than or equal to 3/10 on a verbal pain rating scale. Load adjustment occurred as follows: bilateral to unilateral; unilateral to unilateral plus weight in a backpack; addition of weight to backpack as needed. Exercise progression and load adjustments were made by the physical therapist during weekly visits made throughout Phase 2. In addition, participants also were given written instructions with illustrations to perform core strengthening exercises three days per week (side plank, 2 reps with 30-90 second holds; side-lying hip abduction 3 sets of 8-15 reps), and daily quadriceps and hamstring stretches (2 reps held for 30 seconds).
Measures
Data were collected at baseline, Week 1 (end of Phase 1), Week 7 (end of Phase 2), and at a one-month follow-up (approximately 11-weeks after the start of the study). Subjects completed self-report outcome measures, and measures of quantitative sensory testing were conducted at each time point. Quantitative sensory testing was performed to assess the pain sensitivity to pressure and heat with threshold testing, and to evaluate the central nervous system’s reactiveness to repeated stimuli using a temporal summation test (sometimes referred to as “wind-up” or “facilitation”). Testing was performed in a standardized order: Pressure Pain Threshold (PPT), Heat Pain Threshold (HPT), and Heat Temporal Summation (HTS).
Self-report Outcome Measures
Participants completed the Lower Extremity Functional Scale (LEFS), which is a region-specific self-report scale of physical function and the Victorian Institute of Sports Assessment – Achilles (VISA-A) questionnaire that includes questions that are pathology-specific to Achilles tendinopathy in regard to stiffness, pain, and function in ADLs and sporting activities. The LEFS has a high degree of test-retest reliability and the minimal detectable change (MDC[90% CI]) for general musculoskeletal disorders was reported as 6 points, and the minimal clinically important difference (MCID) as 9 points.36 The VISA-A however, has low certainty evidence for being reliable due to high heterogeneity across studies and a large range for the MDC exists (7-19 points across four studies).37 The MCID for active people with mid-portion Achilles tendinopathy was reported in a recent study to be 14 points.38
Additionally, the Pain Catastrophizing Scale (PCS) was collected only at baseline as a means to report on the degree of pain catastrophizing in the sample. The PCS is a reliable and valid 13-item self-report measure designed to quantify an individual’s negative thoughts and behaviors in response to actual or potential pain. A score of 30 or more represents clinically relevant catastrophizing in populations with chronic musculoskeletal pain.39,40
Pressure Pain Threshold Testing
The PPT test sites occurred bilaterally over the Achilles tendons (dermatome S1) and tibialis anterior muscle bellies (dermatome L4) using techniques previously described.11,41 The PPT assessments were conducted with a pressure algometer (FDIX25, Wagner Instruments, Greenwich, CT, USA) with a 1 cm2 rubber tip, with pressure was applied at a rate of 1 kg/s. Standardized instructions were read to the participants prior to each PPT test session and were instructed to indicate the first instance that they felt the sensation of pressure change to that of pain. When the participant indicated pain, the pressure was immediately removed and the peak force in kilograms was recorded. The Achilles tendon was tested in prone with the ankle joint fixed at neutral dorsiflexion/plantarflexion with an inelastic strap.11,14,34 The site of maximum tenderness was determined by manual palpation and this point was recorded as the distance from the calcaneal insertion (mean = 2.17 ± 1.72 cm, range = 0 to 5 cm proximal) and used as the PPT test point. The tibialis anterior testing site was determined as the midpoint from the fibular head to the medial malleolus. Each site was tested twice with a minimum of approximately one minute between repetitions and the two trials were averaged at each site. A standardized order of testing with the following sequence: right Achilles tendon, left Achilles tendon, right anterior tibialis, and left anterior tibialis. PPTs were tested at baseline, after the first week of treatment with NxES only, after six weeks of eccentric exercise, and finally at the approximate one month follow-up. In a prior study, test-retest for Achilles tendon PPT of healthy individuals was high (ICC = 0.91, MDC(90) = 2.05 kg/cm2).41 Participants with bilateral symptoms were excluded from the Achilles PPT data analysis of the unaffected side, but both sides were included in the analysis of the affected side.
Heat Temporal Summation and Heat Pain Threshold
After a two-minute washout period, additional quantitative sensory tests were performed. The heat pain threshold (HPT) assessed heat pain sensitivity and heat temporal summation (HTS) assessed the degree of pain facilitation (wind-up) and were performed as described previously.11,41 For both tests, a computer-controlled thermode with a 3-cm2 contact area (TSA-II Neurosensory Analyzer, Medoc, Ramat Yishai, Israel) was secured to the subject’s most painful aspect of the Achilles tendon with the probe lying as evenly as possible along the tendon and secured with a Velcro strap. For subjects with bilateral symptoms, the most painful side was utilized for HTS and HPT. During the HPT test, the probe’s temperature increased from 35°C at a rate of 0.5°C per second. Participants clicked on a computer mouse when they first felt the sensation of warmth change to that of pain, which would terminate the test. The test was terminated if the probe temperature reached a maximum of 51°C. The HPT was repeated after a one minute rest period and the two repetitions were averaged. A prior study showed moderate test-retest reliability in healthy individuals (ICC = 0.78, MDC(90) = 1.35°C).41
After an additional two-minute washout period, HTS was assessed with a program that applied 10 consecutive heat pulses to the Achilles tendon at a rate of one pulse every 2.5 seconds using the same computer-controlled thermode. Each pulse of heat climbed from 42 to 50.5°C at a rate of 10°C per second and then returned to the starting temperature of 42°C. Participants were asked to rate their perception of the intensity of the pain for each pulse on a standardized visual analog scale from 0 to 100mm. The scale contained the following written descriptor anchors: 0 mm = “no sensation”, 10 mm = “warm”, 20 mm = “pain threshold”, and 100 mm = “worst pain imaginable”. Temporal summation was calculated at the first rating (measured in mm) subtracted from the maximum rating of the series. Prior research has indicated a high test-retest reliability in healthy individuals (ICC = 0.89; MDC(90) = 10 mm).41
Statistical Analysis
Statistical analysis was completed using SPSS Version 29 (IBM Corporation). Repeated measures ANOVA was performed to compare the change across variables over four time points (baseline, Week 1, Week 7, and the one month follow-up). Bonferroni post hoc testing was then calculated to see if there were significant differences between the four time points. Two-sided tests for significance were reported. A priori ɑ < 0.05 was used to determine statistical significance. Effect sizes were calculated with Hedge’s g for mean differences between the time points (trivial <0.2, small ≥0.2 to <0.5, moderate ≥0.5 to <0.8, large ≥0.8 to <1.20, and very large ≥1.2.).42
RESULTS
Seventeen recreational runners with chronic Achilles tendinopathy met inclusion criteria and were enrolled, however one subject withdrew due to an undisclosed cardiac history that was revealed during their first week of treatment. Therefore, a total of 16 participants (eight males/eight females; mean age = 39.8 ± 10.3 years, range 24-55 years) successfully completed all testing sessions of the study. Table 2 provides the characteristics of the subjects, including duration of symptoms (mean 19.76 ± 30.28 months, range 3 months to 8 years), as well as running history. Of the 16 subjects, three presented with bilateral Achilles tendinopathy and five had symptoms located at the Achilles insertion on the posterior calcaneus. The subjects exhibited non-clinically-relevant levels of catastrophizing at baseline (mean score 10.00 ± 8.68, range 0-28).
Regarding the self-application of NxES, subjects tracked their usage, which was an average of 5.5 days (range 3-7 days) over week one of the study protocol. During the initial application of NxES, the average maximum amplitude each subject reached ranged from 6-32mA (mean = 20.51 mA), which equated to an average of 3.9 times above sensory perception threshold. For the final application of NxES, subjects recorded an average maximum intensity ranging from 7.5-36 mA (mean = 20.97mA). There were no adverse events reported by the subjects with any of the treatment interventions over the course of the study.
Self-report Outcome Measures
There was a significant effect of time in the mean LEFS score (F(3) = 16.90, p < 0.001; Table 3). Post hoc testing (Table 4) indicated a significant difference between baseline and week one (p =0 .011, 95% CI [1.1, 6.9]), week one and week seven (p = .008, 95% CI [1.7, 9.4]), and baseline and one month post (p < 0.001, 95% CI [5.5, 13.7]), but not between week seven and the one month follow-up (p = 0.969). The reported MCID of the LEFS is 9 points,35 which was exceeded between baseline and the one month follow-up (9.6 ± 7.7; Table 4).
For the total VISA-A score, there was a significant effect of time in the mean score (F(3) = 14.57, p < .001; Table 3). Post hoc testing indicated a significant difference between baseline and week one (p =0 .015, 95% CI = [1.7, 13.5]), week one and week seven (p = 0.005, 95% CI = [3.4, 16.0]), and baseline and the one month follow-up (p <0 .001, 95% CI = [9.9, 28.8]). For the VISA-A, the lower end of the MDC range (range 7-19 points)36 was exceeded between baseline and week 1 (7.6 ± 11.0) and week one and week seven (9.7 ± 11.8). The MCID of 14 points was exceeded between baseline and one month follow-up (19.4 ± 17.7), which was approximately 11-12 weeks from baseline.
Specific to the VISA-A, two questions were examined from this outcome measure due to their relationship to running. Question 5 of the VISA-A asks about Achilles pain during or immediately after doing 10 (single leg) heel raises from a flat surface, with 0 representing “strong severe pain” and 10 indicating no pain.43 For the responses to this question, there was a significant effect of time in mean response (F(3) = 8.56, p <0.001; Table 3). Post hoc testing (Table 4) indicated a significant improvement between week one and week seven (p = 0.006, 95% CI = [0.6, 3.0]) and for baseline and the one month follow-up (p = 0.004. 95% CI = [1.0, 4.3]), but not from baseline to week one (p =0 .296). Question 6 of the VISA-A asks about the number of single leg hops that can be performed without Achilles pain with a range of 0-10.43 For VISA-A question 6, there was a significant effect of time in mean question score (F(3) = 6.93, p <0 .001; Table 3). Post hoc testing (Table 4) indicated a significant improvement between week one and week seven (p =0 .028, 95% CI = [0.2, 3.4]) and for baseline and after one month follow-up (p = 0.009, 95% CI = [1.0, 6.1]), but not for baseline to week one (p =0 .397).
Pressure Pain Threshold Testing
For PPT of the affected Achilles tendons (n=19), there was a significant effect of time in the mean PPT (F(3) = 26.82, p <0 .001; Table 5). Post hoc testing (Table 6) indicated a significant difference between baseline and week one (p = 0.002, 95% CI = [1.1, 3.9]), week one and week seven (p < 0.001, 95% CI = [2.7, 6.0]), and baseline and one month follow-up (p <0 .001, 95% CI [4.5, 10.6]). Following the NxES treatment, there was a 2.5 ± 2.9kg increase in the involved Achilles PPT from baseline to week one which surpasses the MDC(90) of 2.05 kg.41 Following the eccentric exercise phase (week one through week seven), there was an increase in PPT values of 4.3 ± 3.4 kg, again exceeding the MDC(90).
For PPT of the unaffected Achilles tendon (n=13), there was a significant effect of time in the mean PPT (F(3) = 12.60, p < 0.001; Table 5). Post hoc testing (Table 6) indicated a significant difference between week one and week seven (p < 0.001, 95% CI = [3.0, 7.1]) and baseline and one month follow-up (p = 0.006, 95% CI [2.3, 10.9]), but not for baseline to week one (p = 0.232). For PPT of the tibialis anterior location across both extremities, there was a significant effect of time in the mean PPT (F(3) = 45.50, p <0 .001; Table 5). Post hoc testing (Table 6) found a significant difference between baseline and week one (p = 0.005, 95% CI = [0.5, 2.5]), week one and week seven (p < 0.001, 95% CI = [2.8, 5.1]), and baseline and one month follow-up (p < 0.001, 95% CI = [3.7, 6.5]).
Heat Temporal Summation and Heat Pain Threshold
For HPT, there was a significant effect of time in the mean temperature (F(3) = 25.71, p < 0.001; Table 5). Post hoc testing (Table 6) found a significant difference between week one and week seven (p < 0.001, 95% CI = [2.1, 5.5]) during the eccentric exercise phase and baseline and one month follow-up (p < 0.001, 95% CI [2.9, 5.3]), but not between baseline and week one during the NxES phase (p = 0.376). The increase in HPT during eccentric exercise (3.8 ± 3.1℃) surpassed the MDC(90) of 1.35℃.41
For HTS, there was a significant effect of time in the mean amount of pain facilitation (F(3) = 6.05, p = 0.001; Table 5). Post hoc testing (Table 6) found a significant difference between baseline and one month follow-up (p = 0.002, 95% CI = [-37.0, -10.5]), but not for baseline and week one (p = 0.130) and week one and week seven (p = 0.145). Neither the application of NxES (baseline to week one) or eccentric loading (week one to week seven) reached significance for change in HTS, but the MDC(90) of 10 points was exceeded between baseline and one month follow-up (mean change = -23.7 ± 24.8).41
DISCUSSION
In this group of recreational runners with chronic Achilles tendinopathy, a staged intervention of NxES followed by eccentric-focused plantarflexor exercise had a progressive effect on decreasing mechanical and thermal sensitivity of the affected Achilles tendon (reduced primary hyperalgesia), and mechanical sensitivity of the unaffected Achilles and the tibialis anterior, bilaterally (reduced secondary hyperalgesia). Thus, treatment with NxES followed by eccentric exercise provides evidence for the reduction in both peripheral and central sensitization when compared to baseline measures in a pain-free group of runners.11 The study participants, on average, also improved their self-reported physical functioning by meaningful degrees on both the LEFS and VISA-A questionnaires. From baseline through the follow-up time period, 62% of participants exceeded the MCID for the LEFS (≥ 9 points) and 68% for the VISA-A (≥ 14 points). The magnitude of change observed in the current study for the VISA-A scale is comparable to other studies of eccentric training or heavy slow resistance training of the plantarflexors over similar time periods.18,44–52
From the studies of resistance training for Achilles pathology, only four45–48 examined PPT of the Achilles tendon, and only the study by Rompe and colleagues48 found a significant increase in PPT (decreased sensitivity) due to eccentric training. The PPT baseline values and change in PPT from the current study were much larger than reported by other authors.45–48 In the current study, baseline PPT of the affected Achilles in the included subjects was 5.8 ± 3.1 kg, where the other studies participants ranged from (1.5 ± 0.6 kg to 4.23 ± 1.7 kg). This difference may be due to contrasts in PPT methodology, as the current study fixed the ankle in neutral dorsiflexion/plantarflexion to put some tension on the muscle-tendon unit. The observed increase in the involved Achilles PPT of 2.5 ± 2.9 kg after one week of treatment with NxES, and an increase of 7.5 ± 6.3 kg across the study period, brought the tendinopathy group to a similar Achilles PPT value (Achilles PPT post-treatment follow-up = 13.4 ± 6.9 kg) to a prior study involving control runners using the same PPT methodology (Control Runners Achilles PPT = 12.7 ± 5.4 kg).11 Additionally, no other studies have reported on changes in HPT over the course of treatment for Achilles tendinopathy. Eckenrode and colleagues11 showed that runners with Achilles tendinopathy had a lower HPT at the site of the tendinopathy compared to runners without Achilles tendinopathy (44.7°C vs 46.7°C). Noxious electrical stimulation did not change the HPT, but eccentric training of the plantarflexors may have contributed to a large increase of 3.8°C which was seen in this study (large effect size). The observed changes in PPT and HPT could represent a reduction in primary hyperalgesia of the affected tissues over the course of treatment, potentially leading to increased tolerance to loading of the Achilles tendon during running and other functional activities.
Pain facilitation, as measured by the heat temporal summation test, has not been well-studied in response to Achilles tendinopathy treatments. Only Chimenti et al45,53 have previously reported on pain facilitation but they utilized different assessments than used in the current study. They used a constant cold pain stimulus delivered to the hand and examined the pain ratings at five and 20 seconds of immersion of the hand in cold water, and found no significant difference in temporal summation between before and after a local anesthetic injection53 or after eight weeks of exercise-based treatment in people with Achilles tendinopathy.45 In the present study, the delivery of 10 rapid heat pulses (50.5°C pulses delivered at 2.5 second intervals) as a pain facilitation assessment found a depression in the amount of Achilles heat temporal summation that was not statistically significant (-11 mm; small effect size) after one week of NxES, but reduced significantly over the treatment period and maintained the one month follow-up (-23.7 mm; large effect size). This finding is in agreement with a prior study that showed significant HTS suppression 24hrs after a single session of NxES and eccentric plantarflexor exercise, but not after low intensity cycling.41 A similar suppression was recently observed in HTS at the knee in a small group of people with knee osteoarthritis after NxES.54 Over the course of treatment and follow-up in the present study, the reduction in HTS supports the concept that the treatments served to reduce the pain facilitation response despite not being elevated prior to treatment when compared to those reported in prior study of healthy runners.11
In addition to reductions in primary mechanical and heat hyperalgesia and pain facilitation over the course of treatment, the participants also showed desensitization (increased) in pressure pain thresholds in the uninvolved Achilles and at the tibialis anterior bilaterally. Increased mechanical sensitivity in areas outside of the involved tissues has not regularly been observed in lower extremity tendinopathies, but have been more widely observed in upper extremity tendinopathies.55,56 The group of runners with Achilles tendinopathy in the current study did show some signs of mild central sensitization with the presence of secondary hyperalgesia seen in lower PPTs in the uninvolved Achilles and bilateral tibialis anterior at baseline when compared to those reported in another study of control runners.11 The PPT’s increased (became less sensitive) in the uninvolved Achilles (by 6.6 kg, large effect size) and the tibialis anterior (by 5.1 kg, large effect size) over the entire treatment and follow-up period.
Limitations of this study include the small sample size and no control group; therefore, cause and effect inferences cannot be made, as the improvements seen could have been a result of the natural course of injury recovery or due to repeated testing. However, the changes in PPT, HPT, and HTS observed across the duration of the study are beyond error as indicated by exceeding the minimal detectable change scores.41 Thus, the changes observed in this study may not be due to a repeated testing effect; however, there is no data establishing the reliability of PPT (over the Achilles), HPT, and HTS in people with Achilles tendinopathy. The current study used the pain-monitoring model35 to educate subjects on how to manage running volume; therefore, the education could have influenced symptoms and pain sensitivity. It is unknown how variations in running activity could have influenced findings, either favorably or unfavorably. Lastly, the study participants investigated consisted of active runners with chronic Achilles tendinopathy; therefore, the findings should be interpreted with caution when applied to a less active group or those with acute and subacute Achilles tendon pain.
Future studies on individuals with Achilles tendinopathy should look to compare the effects of NxES followed by eccentric exercise versus exercise-only, and additionally investigate if a dose-response relationship exists for NxES. While this study focused on painful eccentric exercise of the plantarflexor muscle groups, the response from other contraction types or tendon loading protocols should also be investigated.
CONCLUSION
A sequential treatment of NxES with eccentric Achilles strengthening may prove to be a beneficial intervention for individuals who present with chronic Achilles tendinopathy. Primary mechanical hyperalgesia was reduced with NxES intervention after one week of treatment using NxES. Over the entire course of treatment, secondary mechanical hyperalgesia, sensitivity to heat pain, and pain facilitation all decreased. Clinically meaningful changes in LEFS and VISA-A were achieved through this intervention approach.
Conflicts of interest
The authors have no disclosures.
ACKNOWLEDGEMENTS
We would like to thank Evelyn Brown, DPT, Brooke Greer, DPT, and Ashley O’Brien, DPT, for their assistance with elements of this project.