


INTRODUCTION
The soleus muscle is an important contributor to performance in daily activities, and sports where fast running, jumping, acceleration, or direction change is required.1 The soleus is considered a primary muscle involved in forward propulsion during gait.2,3 In addition, the soleus acts as an agonist for the anterior cruciate ligament (ACL) during cutting and other “at-risk” movements.3
Performance and strength tests that quantify components of physical fitness and describe key performance indicators allow for measurable clinical goals and objectives.4 In athlete screening, measuring the soleus’ isometric muscle strength provides a quantifiable baseline.5–9 Patients or athletes may display strength deficits altering either their muscle performance1 or knee stability.3 Accurate assessment of soleus strength is crucial in the rehabilitation and physical preparation phases of lower-limb injured patients and those participating in “on-legs” sports.
Documenting the strength of the ankle plantar flexors, especially the soleus muscle, has been identified as an important gap in clinical and performance practice,10 and necessary reliability data11 for tests allowing detection of soleus muscle strength measures are rare.
In one study, Rhodes et al10 investigated the test-retest reliability of an isometric strength test of the soleus in academy football players. They found high reliability but a slight bias (increased second test score) for their test. Their test placed the participants’ hip, knee, and ankle at 90° of flexion, and they used a soft (Airex®) pad between the thigh and a fixed bar above the point of contact. This testing protocol likely produces lower values12,13 as it allows thigh movement towards hip flexion against the soft pad. Starting the test at 90 degrees, closer to the ankle’s inner range of the plantar flexors – i.e. a more plantarflexed position – also contributes to lower force generation due to active insufficiency.14
In an effort to address the clinical gap of measuring plantar flexion force in a mixed population, an instrumented test of plantar flexion strength was developed at the authors’ facility that underwent an extensive period of pilot testing and refinement. Briefly the device comprises an externally adjustable frame using commercially available clamps mounted to a steel plate upon which a force place is positioned. For participant comfort, the horizontal bar is padded and an additional firm polyurethane pad is placed between this bar and the participant’s knee during the test. In contrast to the method of Rhodes,10 the test position is in greater ankle dorsiflexion, and modifications have been made to the thigh bar padding of the device resulting in better reported participant comfort during our pilot testing. To minimize ankle movement during the test a pre-load of 200N is applied prior to each test, and verified after the patient reports they are relaxed, not pushing, prior to each repetition through inspection of the force trace output from the force plate software. Note that ankle plantarflexion torque while the knee is flexed is not solely created by the soleus muscle as the remainders of the calf musculature have the capacity to generate this torque in addition to the soleus.15 For convenience, in this investigation this measure will be termed a “soleus strength test”.
Despite good reports of feasibility and patient acceptance, before recommending routine clinical implementation, reliability and minimal detectable change data are required to allow accurate interpretation of these scores.9 Hence, the purpose of this study was to investigate the test-retest reliability, bias, and describe the minimal detectable changes for the measures obtained during the test of seated plantarflexion strength.
METHODS
Participants
A pilot study suggested that test-retest intra-class correlation (ICC) would be approximately 0.85. A more conservative estimate of 0.45 for the final correlation in planning the sample size was used, and therefore, to achieve the power of 0.95 (alpha of 0.05, two-tailed) a minimum sample size of 54 participants was required. Accordingly, a sample size of 61 was planned to allow for sufficient power despite a 10% dropout rate.16 Inclusion criteria were any consenting healthy volunteer adults at any level of physical activity from a convenience sample. Exclusion criteria were any current or recent injury which would prevent the participants from safely performing the test.
Prior to testing, participants’ gender, age, body weight, physical activity level (Tegner), and medical history were recorded, and subsequently, the estimates of soleus muscle maximal voluntary strength were collected. Note that the term ‘soleus strength test’ is one of convenience and does not reflect the fact that plantarflexion force is likely a combination of a number of muscles in the leg. Ethical approval, including provision for participant safety, confidentiality, and personal data storage, was obtained from both the Research Ethics Approval Committee (University of Bath-Application Number: 2023-021) and the Aspire Zone Foundation Institutional Review Board (Qatar, Application Number: E202301055).
Study Design
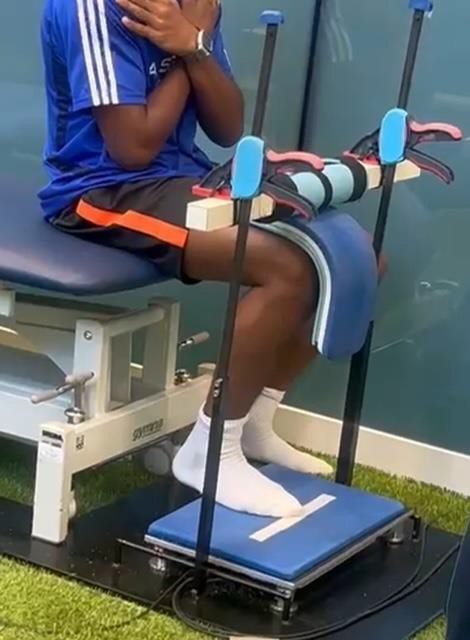
The test setting used in the study comprises a force plate, an adjustable height treatment table and an adjustable bar with padding below the individual’s foot and above the thigh (Figure 1).

Procedures
Initially, the participants had the procedure explained and demonstrated to them by the investigator, and informed consent was sought and obtained. The participants then performed a minimum of six minutes of stationary cycling, walking, and/or running, along with any exercises they preferred until they felt ready to perform the test. The left limb was arbitrarily tested first. All participants were positioned to favor soleus muscle activation and optimize high plantar flexion force production. Individuals were seated at the end of an adjustable height treatment table with horizontal thighs and their foot and ankle at rest in dorsiflexion exceeding 90°. The foot was positioned such that the anterior tip of the big toe was placed at the edge of taped mark on the surface of the force plate 5 cm anterior to a vertical (plumb) line from the front-most aspect of the horizontal bar. The anterior aspect of the knee was then vertically aligned to this point (Figure 1).
In this position, after ensuring the participants had relaxed their foot and ankle, and they were comfortable, a preload of 200 Newtons was applied to the lower thigh using an external clamp and an intervening custom polyurethane pad (confirmed from the output of the force plate software). The participants then performed several submaximal contractions to confirm comfort, familiarity, and correct performance of the test. This was repeated until both the examiner and the participants felt ready to perform the test. The participants were then asked to provide a forceful, rapid contraction, which was encouraged with the verbal instructions: “3, 2, 1 Yalla! – PUSH!!, PUSH!!, PUSH!!, PUSH!!”. The test continued for at least three seconds, then after a short rest period where resting pressure of 200N was reaffirmed, the test was repeated until four satisfactory trials were performed on the limb. The test was then repeated on the opposite limb. A total of four trials per leg, per participant were performed. The entire test was repeated a second time by the same physiotherapist, not less than one day and not more than seven days later. During the second test, the same physiotherapist was blinded to the initial test results to minimize bias in strength measure estimation and recording.17
The pilot study, which informed the sample size calculations, involved five repetitions for each participant. Subsequent analyses, considering maximum value, average value, and varying numbers of repetitions, demonstrated acceptable reliability when using the maximum value observed in the first four trials. Accordingly, the maximum value observed in four trials during the test and retest was utilized in this study in the final analyses.
Data Analysis
Initially, descriptive data were calculated, and exploratory analyses were conducted to ensure data veracity. Subsequently, ICC(2,1) test-retest reliability (absolute agreement) was calculated, and Bland-Altman analyses were created. Note that Intraclass Correlation Coefficient (ICC2,1) is commonly used to assess test-retest reliability as it evaluates the consistency of measurements across repeated tests when there are multiple raters or assessments under the same conditions. Specifically, it is ideal when each participant is measured by the same raters (or under the same conditions) in both tests, and when the raters or conditions are considered to be a random effect, that is representative of a larger population of potential raters or test conditions. This model also considers both between-participant and within-participant variability, making it a good choice for assessing the stability of measurements over time in test-retest studies.18 Reliability descriptors were reported as “excellent” for ICC ≥0.90, “good” for 0.75-0.89, “moderate” between 0.50 and 0.74, and “poor” as <0.50.18 The minimal detectable change19 was calculated as 1.96 * √2 * Standard Error of the Measure,20 and the bias along its 95% confidence interval was described using Bland-Altman analysis.21
RESULTS
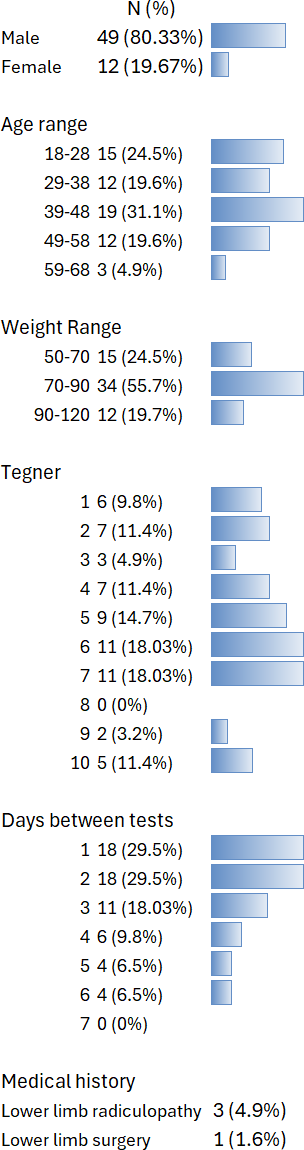
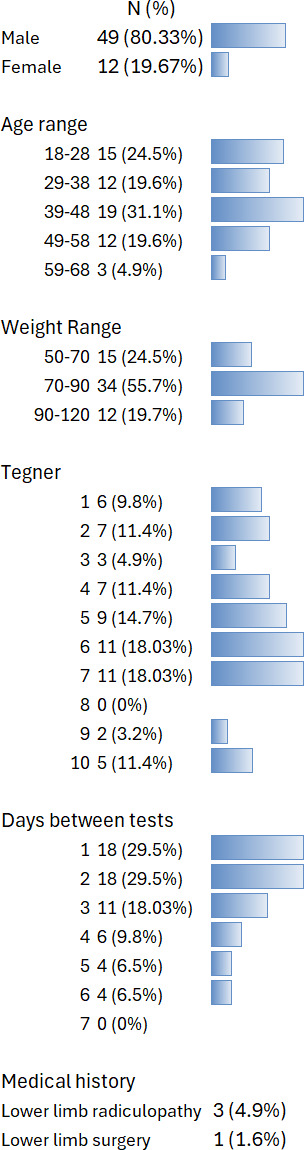
Valid data were obtained from all 61 participants. Descriptive values for Age were average = 39.6 years (SD=12.6); median=40, (IQR: 32 to 48), [range: 18 to 61]; and weight = 81.1kg (13.8); 83(71.4 to 89) (Figure 2).
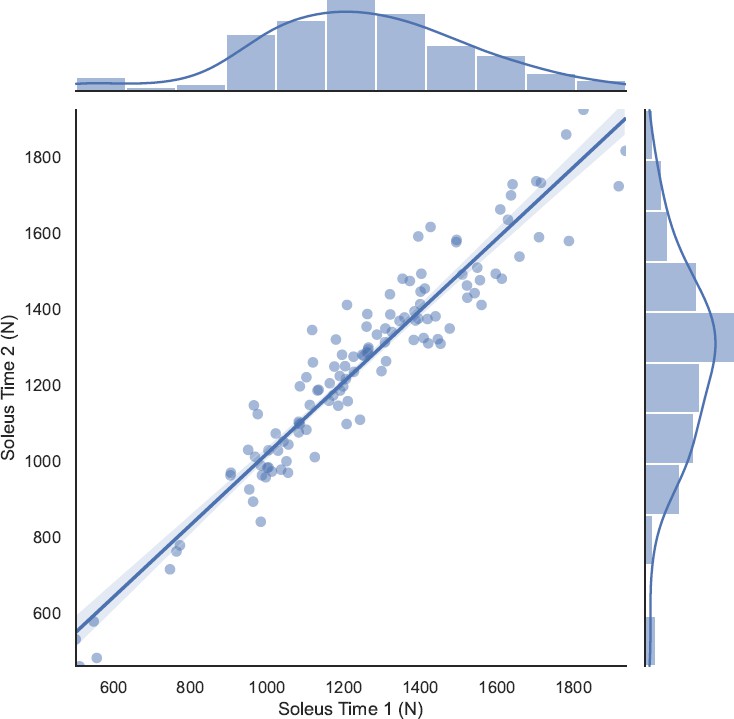
The mean (SD) of force was 1254.1N (276.1N) which equated to a mean (SD) of 1.58 bodyweights (0.29BW) and 15.54 (2.83) N/kg. Excellent test-retest reliability (ICC(2,1) = 0.976 [0.97 to 0.98], p<0.001) was found for the soleus strength test (Figure 3).

Bland-Altman analyses (Figure 4) showed no systematic bias between tests (mean difference= -6.30N [95%CI -21.44 to 8.85N) or across the ranges of observed strengths. The minimal detectable change (MDC) was 118N (0.148 bodyweights). Due to the uneven distribution of the participants’ Tegner scale no meaningful analysis was possible with respect to their activity level. Supplemental Figures 1-3 present bodyweight-adjusted force values with Tegner scores as covariates.

DISCUSSION
The results of this study indicate excellent test-retest reliability (ICC2,1=0.976 [0.97 to 0.98], p<0.001) of an instrumented isometric soleus strength test with a minimal detectable change of 118N (14.8% of body weight).11 These findings, along with the patient and therapist-reported clinical acceptance, help fill the gap in clinical and performance practice,10 where the documentation of plantarflexion strength, especially soleus muscle strength, is required. These data help inform the findings from baseline/pre-season strength testing in athletes who may suffer calf muscle, ankle joint, or ACL injuries during the season.
The test-retest reliability calculation (ICC2,1 = 0.976 [0.97 to 0.98], p<0.001) and the Bland-Altman analyses in this study appear slightly better than previously reported methods.10,12 Rhodes et al.10 reported high test-retest correlation (Right: 0.89; Left: 0.79, p<0.05) with no significant difference detected between legs. In addition, McMahon et al.12 identified good to excellent absolute reliability for the peak force for both limbs with no meaningful differences between peak force values at either time point (p=0.306–0.808; g=0.05–0.22).12 The absence of reported minimal detectable changes nor Bland-Altman analysis in the study by McMahon et al. preclude comparison of these aspects to the current research. However, calculating the MDC from the Rhodes et al. data using the same methodology used in the current study, provides an MDC of 531N, which was higher than the calculation reported here of 118N.
This study’s findings concur with the previous researchers10,12 and extend them to a wider population in terms of activity level (Tegner), resistance training experience, and to both genders. In contrast to the protocol of Rhodes et al.10 the participants were placed in greater dorsiflexion which is speculated to have several advantages in terms of ecology and feasibility.22 Firstly, this position more closely mimics the ankle at mid-stance during gait23 and allows for more force generation than in a less dorsiflexed position.14 Secondly, during pilot testing, where a less dorsiflexed position was initially employed, occasionally, individuals experienced painful cramping of the calf muscles during the test.24 In this study, and in all clinical tests subsequently performed in this position, no reports of any adverse effects have been noted at the time of the test or in the ensuing days. Some authors have carefully controlled thigh position,12 but not others.13 In practice, the use of an adjustable height treatment table greatly simplified the positioning of the thigh to horizontal, and due to the standardization of the knee and foot position, the authors are confident the knee position was also consistent throughout tests; however, these angles and heights were not recorded.
The data presented here contrasts with that of the professional rugby players examined by Lee et al.13 and youth football players12 showing a greater range, but approximately similar maximum values: 6.32 to 22.89N/kg; 0.64 to 2.33BW.
The narrow confidence intervals for the reliability estimate (0.97 to 0.98) suggest further data collection will not meaningfully increase precision. However, the clinical utility of these findings still needs to be demonstrated despite the excellent reliability found here. One method of doing this would be to document clinical improvement on some metric thought to be associated with plantar flexor strength (e.g., short sprint times or jump height)25 or differences between populations (e.g., healthy compared to injured calf), and then see if there is any association with changes in the strength test values which exceed the minimum detectable change values documented in this study.
It is noted that this reliability study was conducted with tests a minimum of 24 hours (up to one week) apart, a condition put in place by the local scientific committee. Several participants reported difficulty performing a maximal test as they were tired from a recent bout of recreational exercise (e.g., a football match that morning). This situation reflects usual clinical practice of re-test some days after an initial test. However, it’s speculated that higher reliability (and therefore lower minimal detectable change values) would have been demonstrated if testing was performed a short period (e.g., an hour) apart where there would be no meaningful change in the individual’s force-generating capacity due to activity.26 Similarly, it is expected there could be better reliability demonstrated if it were possible to control of the individuals’ activity level in the preceding 48 hours.12
The population in this study was a convenience sample. Even though it displayed good representativeness in terms of activity level, age, and body weight, different results may be seen in other populations encountered in clinical practice with varying requirements of soleus muscle strength. The relatively low proportion of female participants (20%, 12 women) suggests some caution should be applied in extrapolating these results to women. Future research may refine and extend these data to other populations.
Finally, the test examined is termed, for convenience, a “soleus strength test” however the plantarflexion force generated by the participant will not be limited to activity of the soleus muscle.15 Future research could examine the relative contribution of the soleus muscle, along with the other plantar flexors to determine the relative contributions of each and better allow interpretation of these values in a clinical context.
CONCLUSION
Excellent test-retest reliability (ICC2,1=0.976) and a minimal detectable change of 118N (14.8% bodyweight) were demonstrated for this measure of plantar flexion force in healthy adults of varying physical activity levels in both genders.
Conflicts of interest
The authors note that while they developed the custom strength testing device, they have no financial links, nor any conflicts of interest perceived or actual regarding this device. Specifically, the device is not for sale by the authors or any of their affiliates, and we have provided all information for readers to manufacture their own versions of the same herein or upon reasonable request.
ACKNOWLEDGMENTS
The Rehabilitation Department in Aspetar.
Dr Ezio Preatoni; Internal supervisor for the study
The participants who volunteered for the study.


