
INTRODUCTION
The ability to perform movements fast and forcefully is a desirable physical capability across all age groups regardless of health status. Maximal muscle power represents the product of maximal muscle force combined with maximal contraction speed.1 Muscle power is integrated into everyday tasks, such as climbing stairs, crossing the street, and in various sport-specific movements such as sprinting, side-cutting, and jumping.2,3 Therefore, muscle power is often assessed in both healthy and athletic populations2–5 as well as in elderly and clinical populations.6–11 Higher production of muscle power is associated with better athletic performance.3 Similarly, higher production of muscle power is associated with functional performance in both elderly and patient populations.6,10–12
Expensive and sophisticated equipment, such as the Nottingham Power Rig or force plate-based methods, are typically considered the gold standard for assessment of lower limb muscle power.1,2,12–15 Alternatively, the Counter Movement Jump has been proposed for use when testing lower limb muscle power, as it is closely associated with Leg Extensor Power (LEP).13,16 However, it requires a wearable inertial measurement unit or a force plate to derive a muscle power estimate from the jump height measurements.17 Alcazar and colleagues demonstrated that both Bilateral 5 repetition Sit-To-Stand (5STS) and Bilateral 30-second Sit-To-Stand (30STS) are highly correlated with physical function in older populations.9,18,19 Moreover, they also produced unilateral power estimates derived from the bilateral sit-to-stand tests. However, caution should be exercised when applying those estimations in younger or middle-aged subjects, as well as in subjects with side-to-side differences in lower limb function. Furthermore, performing a bilateral sit-to-stand test can be impractical due to injury-related limitations,20 such as wearing a leg-brace on one leg, where it may still be valuable to assess muscle power loss in the contralateral leg due to immobilization. Additionally, it may be redundant to perform a bilateral test, because the task may not yield a true maximal effort when performed in younger populations. Thus, an inexpensive, easy-to-administer, test for lower limb muscle power, is important to identify and validate.
Both the Bilateral 30STS and the Bilateral 5STS exists as unilateral tests, and both the Unilateral 30STS and the Unilateral 5STS are feasible and valid measures of quadriceps strength, establishing them as appropriate tests for assessing lower extremity strength in adults.20–24 However, it is unknown whether these tests correlate with muscle power, specifically LEP. Understanding this relationship is important, as LEP is a key determinant of physical function across healthy and clinical populations.12–15 Previous studies have demonstrated that another unilateral test for leg function, the unilateral Hop For Distance test (HFD), correlates with lower limb muscle peak power production in injured and active athletes.25 Therefore, the HFD was integrated into this study’s assessments to determine whether these easily administered tests could serve as practical proxies for muscle power across a wide range of individuals with varying ages and physical activity levels.
Thus, this study aimed to identify an easily administered, functional performance test to assess unilateral muscle power.
METHODS
Participants
For this cross-sectional study, healthy participants were recruited. A convenience sample of 52 healthy participants meeting the following criteria was included: 1) aged 18-50 years, 2) considered themselves to be healthy, and 3) reported no lower limb injuries. Participants were excluded if they had been diagnosed with any injury or disease that could affect their ability to perform the physical function tests, such as acute lower limb injuries, severe knee or hip osteoarthritis, neurological disorders, or other musculoskeletal, cardiovascular or neurological conditions hampering lower extremity function. Eligibility was assessed by the physical therapists responsible for the testing procedure. Written informed consent was obtained from all participants before testing.
The study was registered with the Region of Central Denmark’s internal list of research projects (Journal Number: 1-16-02-285-23). The reporting of the study conforms to the Strengthening of the Reporting of Observational Studies in Epidemiology (STROBE).26 All procedures in this study were carried out in accordance with the Declaration of Helsinki II.27
Protocol
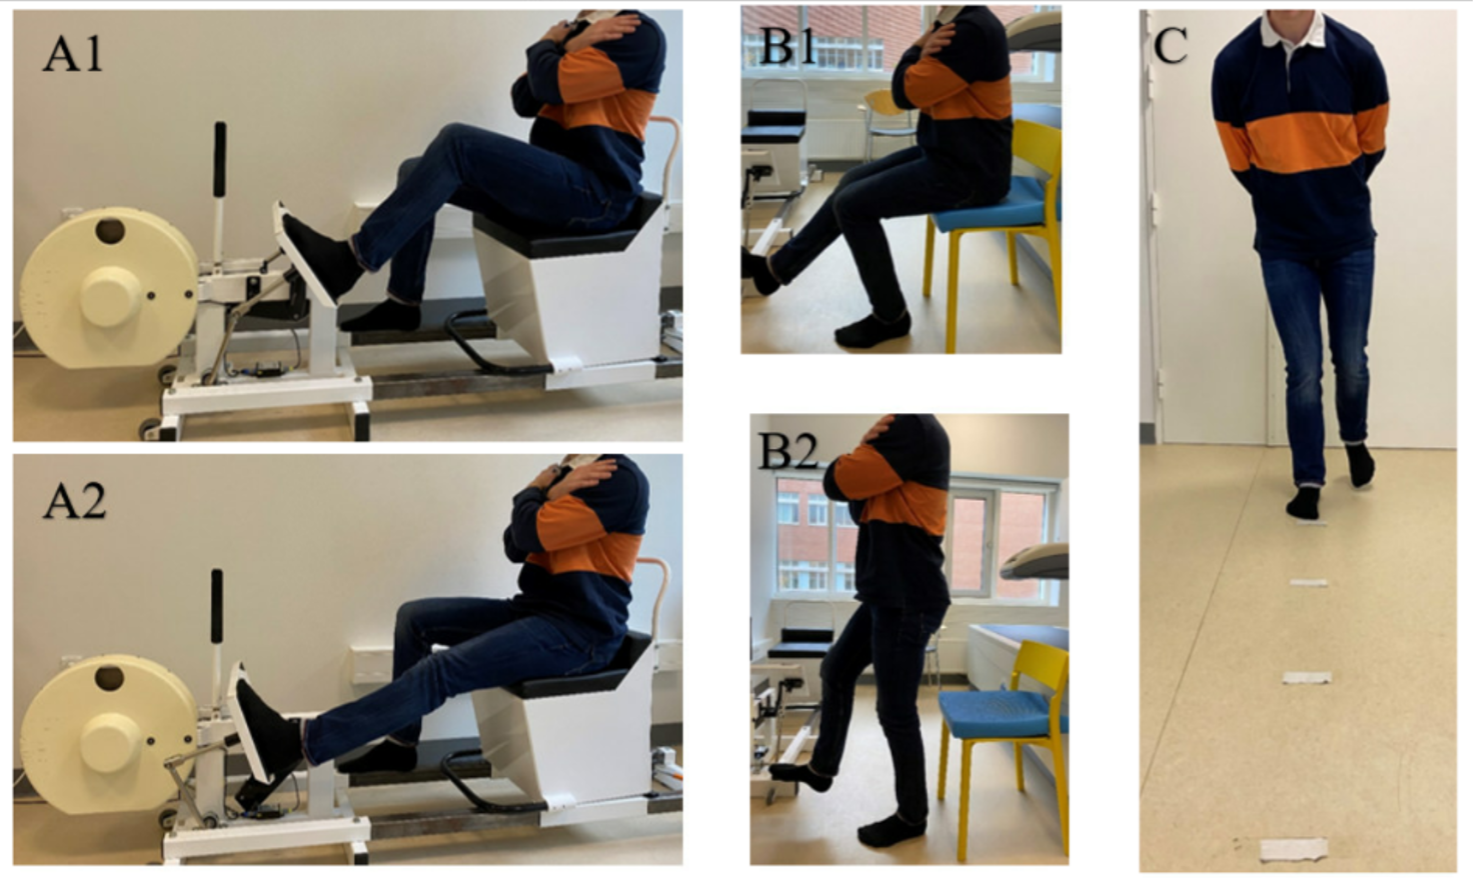
Data collection: Data collection in this study included measurement of leg extensor power as assessed by the Nottingham Power Rig, and functional performance was measured by the unilateral tests; 5STS, 30STS, HFD (Figure 1), and self-reported physical activity was assessed by the Short Questionnaire to AssesS Health-enhancing physical activity (SQUASH). The assessment also included measurement of body mass (kg), height (cm), age (years), sex (male/female), and dominant leg (right/left) determined by which leg the participants would use to kick a ball. All participants were tested by one of three physical therapists, according to a pre-established test protocol.

Leg extensor power (LEP): The Nottingham Leg Extensor Power Rig (Queen’s Medical Center, Nottingham University, UK) was used to measure LEP unilaterally (Figure 1). The method is proven feasible, reliable, and valid in healthy subjects.28,29 Testing was performed with participants in a seated position with torso upright and arms crossed. Participants were then instructed to kick the pedal as hard and fast as possible. A unilateral explosive repetition of combined hip- and knee extension accelerated a flywheel inside the Nottingham Power Rig. LEP, measured in watts was calculated from the maximum speed of the flywheel. Participants completed two familiarization-trials on each leg before testing. Following this, they conducted a minimum of five trials on each leg with a 30-second pause in between, starting with the dominant leg. If the fourth or fifth trial did not exceed the previous highest LEP output, the test was concluded. If not, further trials were performed until a plateau in LEP output was reached, defined as two consecutive trials below peak LEP or when a total of ten trials were completed.13 LEP was normalized for each participant by dividing watts with body mass (kg).
Unilateral Sit to Stand Performance: Two unilateral STS test procedures were used: unilateral 5STS and unilateral 30STS. Both tests have high interrater reliability of >0.98.23 Both legs were tested in the two STS tests, starting with the dominant leg. The unilateral 5 STS was tested first, followed by the unilateral 30STS after a two-minute rest. A chair with a seat height of 50 cm was used for both STS tests (Figure 1). The unilateral 5STS assessed the time required to perform five repetitions as fast as possible, whereas the unilateral 30STS, measured the maximum number of repetitions completed in 30 seconds. One repetition was defined as rising from sitting to standing with full hip- and knee extension, followed by returning to a seated position, ensuring the buttocks made contact with the seat of the chair. Each complete cycle of sitting to standing and back to sitting was counted as a repetition. Each leg was tested once with a two-minute rest between legs. Participants were allowed three trial repetitions to familiarize with the test. Participants were allowed to position their test limb as they felt optimal for performance, thus defining the starting position of the test. The tests were performed with arms across the chest and with the contralateral knee fully extended or flexed in an approximately 90-degree position. Only complete repetitions were counted, defined as buttocks touching the chair, knee fully extending, and the contralateral leg not touching the ground.23
Hop For Distance (HFD): To test participants’ ability to unilaterally jump and maintain balance, the HFD test was used. This test is recognized as a reliable method to asses lower limb function, with an interrater reliability of 0.8.30 Testing was performed with participants standing on one leg behind a line on the floor, with their hands behind their backs (Figure 1). Participants were then instructed to perform a maximal effort forward hop, while maintaining balance on the leg for three seconds after landing, without supporting with the contralateral leg. The distance in cm (rounded up to the nearest half a cm) was recorded from the starting line to the heel of the standing foot. Participants were allowed one familiarization-trial on each leg followed by three trials, alternating legs between each trial.25 If the third trial was measured to be 10 cm longer than the previous trials, the participants were allowed another trial, until not able to improve by 10 cm. The best trials for each leg were recorded.
The Short Questionnaire to AssesS Health-enhancing physical activity (SQUASH)S: Self-reported habitual physical activity during an average week, was measured by the SQUASH, a short physical activity questionnaire with an intraclass coefficient of 0.73.31,32 The SQUASH measures the duration and the intensity of activities in the following domains: Commuting; leisure; household; and work or school. Based on the reported effort, an intensity score was assigned to each activity domain. Reported sports activities were assigned a metabolic equivalent (MET) value. Activities were divided into three intensity categories: light (2 to < 4 MET); moderate (4 to < 6.5 MET); and vigorous (≥ 6.5 MET). Activity scores were calculated by multiplying the time per week spent in each intensity category with its intensity score. Estimation of total physical activity was calculated by the sum of all activity scores for the three categories. Activities with a MET score below 2 were excluded as they were considered low-intensity activities.31,32
Statistical analysis
Continuous data were assessed for normality using histograms and qq-plots. Variance homogeneity was assessed using the F-test. Paired t-tests were used to compare between-leg differences in the Nottingham Leg Extensor Power Rig test and unilateral functional performance tests, presented as mean differences with a 95% confidence interval (95% CI). Pearson’s correlation coefficients (denoted r) were presented with 95% CI to quantify the strength of the relationship (e.g., values ranging from -1 to 1) between muscle power and unilateral functional performance tests, self-reported physical function. Correlations were interpreted according to the following criteria:0.0-0.3 negligible; 0.3-0.5 low, 0.5-0.7 moderate; 0.7-0.9 high; 0.9-1.0 very high correlation.33 The statistical assumptions for the Pearson correlation (i.e., linearity, bivariate normality, homoscedasticity, and independence) were assessed before analysis. Probability levels less than five (p<0.05) were accepted as significant.34 The sample size was determined to be at least 50 according to the rules of thumb suggested by Wilson Van Voorhis and Morgan.35 STATA (StataCorp LP, College Station, Texas) version 18 was used for data analysis. RStudio (Integrated Development for R. RStudio, PBC, Boston, MA) was used for producing plot figures.
RESULTS
Patient characteristics are presented in Table 1, showing that there were an equal number of male and female participants, with a mean age of 30.1 years, and a mean BMI of 24.2 (Table 1).
A difference in number of repetitions completed by the dominant and non-dominant leg was found for unilateral 30STS (Table 2). There were no between-limb differences for any other outcome. Correlations between LEP and functional tests as well as SQUASH are presented in Table 3.
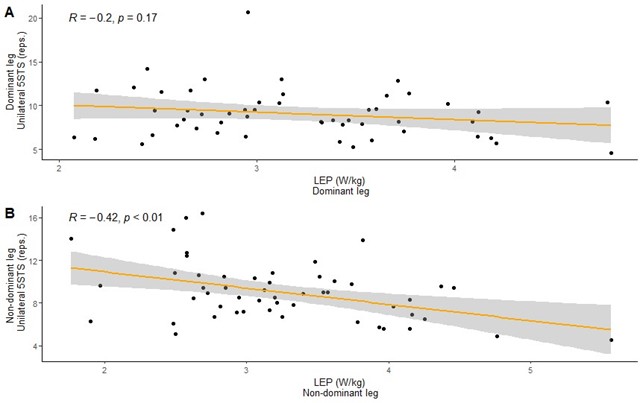
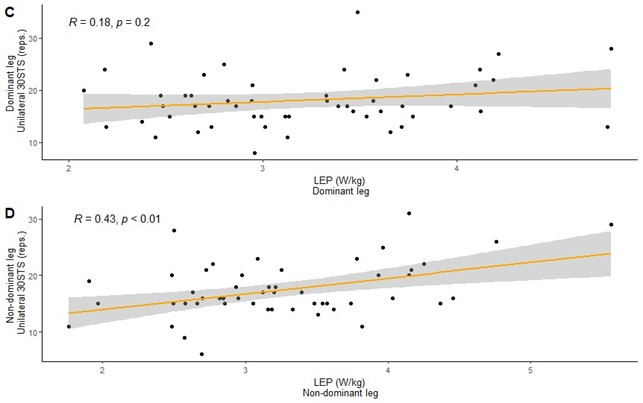
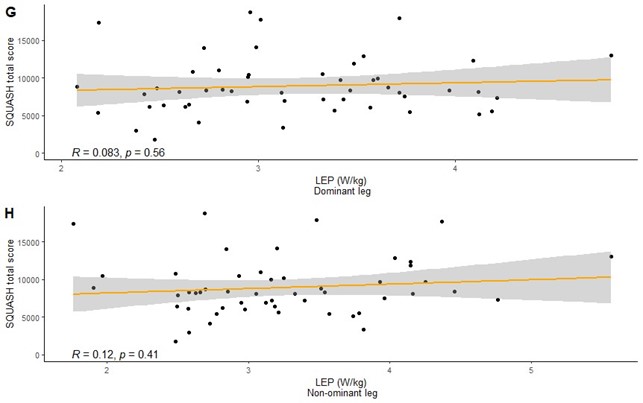
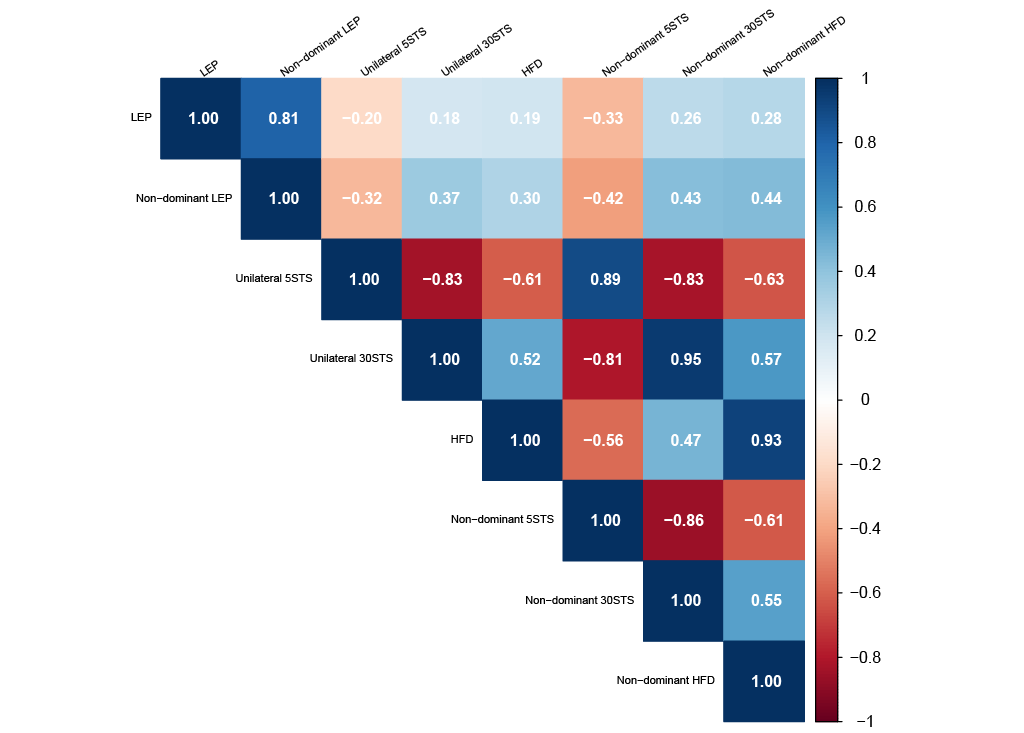
Correlations with LEP for the dominant leg: Correlations were negligible between LEP and the functional tests (Figures 2A, 2C, 2E), as well as self-reported physical activity on the dominant leg (Figure 2G).
Correlations with LEP for the non-dominant leg: There were low correlations between LEP and Unilateral 30STS (r=0.43, p=<0.01) as well as HFD (r=0.44, p=<0.01), and a low inverse correlation with LEP and Unilateral 5STS (-0.42, p=<0.01) (Figures 2B, 2D, 2F). A negligible correlation was observed between LEP and self-reported physical activity on the non-dominant leg (Figure 2H).


DISCUSSION
This study sought to identify a functional performance test that could easily be administered to assess lower limb muscle power. Correlations were evaluated between LEP derived from the Nottingham Power Rig and the functional tests: unilateral 5STS, unilateral 30STS, and HFD, as well as with SQUASH scores. All correlations produced in this study were negligible or low. Similarly, the SQUASH questionnaire showed negligible correlation with LEP, indicating no concurrent validity between the SQUASH total activity score or intensity categories (i.e., light, medium or vigorous) and LEP.
In comparison to the results of Alcazar et al.,18 who assessed the validity of the conventional bilateral 30STS in community-dwelling older adults and found a high correlation between the test and LEP of 0.75, similar high correlations were not seen in this current study, when performing the 30STS as a unilateral functional test. Several factors may contribute to why high correlations were not found.
In this study, a chair of 50 cm seat height was used, equivalent to 6 cm higher than the chair used in the Alcazar et al. study.18 The taller chair height was chosen to ensure all participants were able to complete at least 5 sit-to-stand repetitions unilaterally. However, that did result in the range of motion during the sit-to-stand assessments performed in this study being less than that of Alcazar et al.,18 which may also alter power outputs, as chair height influences the knee joint load during the unilateral STS movement.36 In addition, the starting angles of the ankle, knee, and hip may have differed from the more standardized starting position of the Nottingham Power Rig.
Also, as suggested by Alcazar et al.,19 a leg extension exercise may reflect a more isolated work of the leg muscles (i.e., eliminating inertia produced by the trunk), which would also be true for the Nottingham Power Rig. However, during sit-to-stand movements, postural control plays an important role in the performance of the exercise.19 Thus, it is intuitive that muscle power output would be negatively affected during a unilateral STS movement.3
To further comment on this, the ability to utilize trunk inertia to initiate the rising movement represents a vital difference between the testing modalities (Nottingham Power Rig vs. sit-to-stand assessments). Therefore, the results of this study may also indicate that the unilateral physical functional tests may be composite tests, measuring several underlying constructs or physical capabilities in addition to muscle power, such as dynamic balance and muscle strength. Further research is warranted to modify the functional tests or to explore alternative functional tests for assessing unilateral lower limb muscle power with minimal equipment.
Study limitation: Some limitations to the study need to be addressed. First, the inclusion of only healthy participants limits the external validity to healthy and athletic populations. Consequently, the clinical applicability of the tests into patient and disease population is therefore limited. Participants may also have benefitted from a learning effect when performing the tests on both legs. However, since the sit-to-stand tests were only performed once per leg, and require demanding postural control, which reduces side-to-side transferability of familiarization, the effect of this appears negligible. Second, the sample size chosen for this study aimed for ~50 participants; however, a larger sample size may have revealed higher or lower correlations between LEP and the functional tests, self-reported physical activity, and could have led to more precise estimates. Further, the possibility of inter-rater reliability of the sit-to-stand tests being affected by increasing chair height were not accounted for. However, given that the original tests have high inter-rater reliability, such a minimal change to the test would not seem to be of significance. Finally, the standardized chair height used in the tests may pose a limitation for the sit-to-stand tests in general, as it does not accommodate variations in participant’s lower limb lengths. This could produce different advantages or disadvantages for participants depending on their height and limb lengths. Addressing this issue could be a valuable direction for future research.
CONCLUSION
The findings presented in this study indicate that the selected functional tests, the 5STS, 30STS, and HFD, do not function as optimal proxy measurements for muscle power in the lower limb. Other alternatives need to be investigated to identify an easily administered functional test to assess unilateral lower limb muscle power.
Funding
This study has not received funding.
Conflicts of interest
The authors report no conflicts of interest.