
INTRODUCTION
The incidence of shoulder pain and injury among overhead athletes varies considerably depending on the sport and level of competition with ranges between 18% and 90%.1–3 Shoulder pain and injury commonly result in decreased sports performance, time missed from training and competition, increased potential need for rehabilitation or surgical interventions, and athletes with a shoulder injury may no longer be able to participate in sport depending on the severity or chronicity of the condition.4–6 Certain overhead sports have been highlighted regarding the incidence of shoulder pain and injury as well as associated risk factors; for example, in Major League Baseball (MLB) the shoulder has been reported as the most injured area overall.7 The injury rate related to the shoulder in MLB (particularly for pitchers) is partly associated with the velocity and force required during the throwing motion, and more notably with the eccentric braking of the arm that must occur once the ball is released.8,9 The physical demands involved with these forces are most evident in the late cocking phase of throwing.8 During the late cocking phase of throwing, glenohumeral joint external rotation range of motion can reach ranges from 165-175 degrees with subsequent glenohumeral joint internal rotation velocities peaking at over 7,000 degrees per second.8,9 Other overhead sports such as handball, volleyball, and tennis demand similar means of force production and deceleration but to a lesser degree. Swimming may demand less force production and velocity than other overhead sports, but the number of revolutions without rest that the shoulder must endure during practice and competition makes it vulnerable to pain and injury.3 Among tactical athletes (military, law enforcement, and firefighters) glenohumeral joint instability occurs at a higher rate than in the civilian population.10,11
Given the incidence of shoulder pain and injury in overhead athletes, there has been considerable interest and effort placed into identifying associated risk factors and subsequently creating and implementing shoulder injury prevention programs.1,4,6,12 However, there is limited research evaluating the effectiveness of shoulder injury prevention programs in overhead athletes. A recent systematic review of the literature on the topic of shoulder injury prevention programs in overhead athletes found that only three studies were able to demonstrate a favorable outcome when implementing an injury prevention program.6
There is a clear need to identify and understand risk factors associated with shoulder pain and injury in athletes who participate in overhead sports to effectively develop and implement shoulder specific injury prevention programs. Additionally, these injury prevention programs should account for the unique demands of each sport and in some instances, individual positions within a given sport. The most recent unregistered systematic review13 performed on the topic utilized a broad inclusion criterion which did not include a specific follow up time or indicate if studies including athletes currently experiencing pain were excluded. Additionally, the systematic review limited the included sports to those classified as overhead and did not include tactical athletes. Therefore, the purpose of this study of this systematic review was to identify risk factors associated with a new onset of shoulder pain and injury among the athletic population.
METHODS
Guidelines
This systematic review utilized the Preferred Reporting Items for Systematic Reviews and Meta-analyses (PRISMA) guidelines for all phases of the review process. The PRISMA statement includes a 27-item checklist designed to improve reporting of systematic reviews and meta-analyses.14 This study was registered using the international prospective register of systematic reviews PROSPERO with the corresponding reference number CRD42020187086
Search Strategy
Searched databases included Medline (PubMed), Embase, AMED, CINAHL, and EmCare utilizing a search strategy developed by one of the authors (HD) with assistance from a medical librarian. No restrictions on date of publication or language were utilized in the search. The search was performed from database inception through October 9, 2022. An example of the search strategy utilized for PubMed can be found in Table 1.
Citations were imported into Rayyan, an online screening tool, for storage, access and management for review.
Study Selection
Title and abstract screening were performed by two independent reviewers (MD and HRT for the initial round as well as PS and DW for the subsequent round) with discrepancies handled through discussion. The inclusion criteria for studies included in this review consisted of the following: (a) athletes either currently in a pain free state (for any length of time) or with no history of shoulder pain at baseline, (b) athletes presenting with shoulder and or arm pain described by the clinician or researcher as originating from a musculoskeletal shoulder problem (c) study designs in which risk factors were captured in a prospective manner (d) factors such as patho-anatomy and biomechanics in isolation or in addition to personal characteristics, environment, activity, participation, lifestyle, beliefs expectations, past experience, etc. (e) studies including relative risk, odds ratios, and/or hazard ratios and (f) follow up of ≥ 6 months. Studies were excluded if they were published in a language other than English and if the results were presented using mixed patient populations where data could not be separated.
There are discrepancies in how researchers define pain and injury and in some cases the definition of pain was similar to that of the definition of injury. For comprehension, the authors chose to retain studies that examined risk factors associated with both shoulder pain and injury among the athletic population. Risk factors were defined as an exposure that, when present, may increase the risk of an unfavorable outcome, in this case, shoulder pain or injury.15 Further boundaries created around risk factors identified within the retained studies included physical (ie. range of motion [ROM]), behavioral (ie. pain experience), environmental (ie. turf vs. grass playing surface) and sport specific demands (ie. training load). Lastly, risk factors were considered modifiable if they could be controlled or changed.
Data Extraction and Appraisal
Data were extracted by two independent research assistants (EL and KF). Data extracted included first author, population/demographic information as well as physical and or psychological variables reported as relative risk (RR), odds ratios (OR), and/or hazard ratios (HR). Relative risk results are performed through a Poisson model and are the risk of sustaining the outcome compared to the entire sample. Odds ratios were performed through a logistic regression and are the odds of sustaining the outcome by dividing the total number with the outcome by the number of participants in the sample who do not sustain the outcome. Hazard ratios were performed through survival (i.e., time to event) analyses. Hazard ratios incorporate time within the denominator. Given that no one tool for measuring risk of bias fit the varied study designs represented, the authors chose the Quality in Prognosis Studies (QUIPS) tool. This tool has been shown to be reliable with a median interrater reliability of 0.75. This tool consists of six elements (study participation, study attrition, prognostic [risk] factor measurement, outcome measurement, study confounding, and statistical analysis and reporting). Each element contains subheadings that examine particular features of the six larger elements. The six elements are then given a score of low, moderate or high risk of bias based on clearly outlined criteria for each subheading within the tools supplementary file.16
Included articles were distributed to members of the review team (CC, HD, RC, JL, PS, and DW) with all articles being reviewed independently for risk of bias (ROB) by two reviewers and consensus scoring agreed upon for each element of all retained articles. The use of summated scoring for overall risk of bias is discouraged and instead selecting criteria a priori for determining overall quality is encouraged. Prior to scoring, two of the reviewers with research experience in this area (PS and CC) agreed that if four or more of the six elements were given a particular score, the majority score would be given as the overall score. If the scores were split three of one and three of another, the score of moderate would be given and if there were three of one score and the others did not all agree, it would be given an overall score of moderate.
Statistical Analysis
Due to the heterogeneity in the data, a descriptive data synthesis was performed. Aggregated data were reported as median (range). Individual data points were reported as reported in the individual study. All analyses were performed with R 4.21. (R Core Team (2022). R: A language and environment for statistical computing. R Foundation for Statistical Computing, Vienna, Austria. URL https://www.R-project.org/.) . The dplyr package was used for all cleaning, coding, and descriptive analyses.
RESULTS
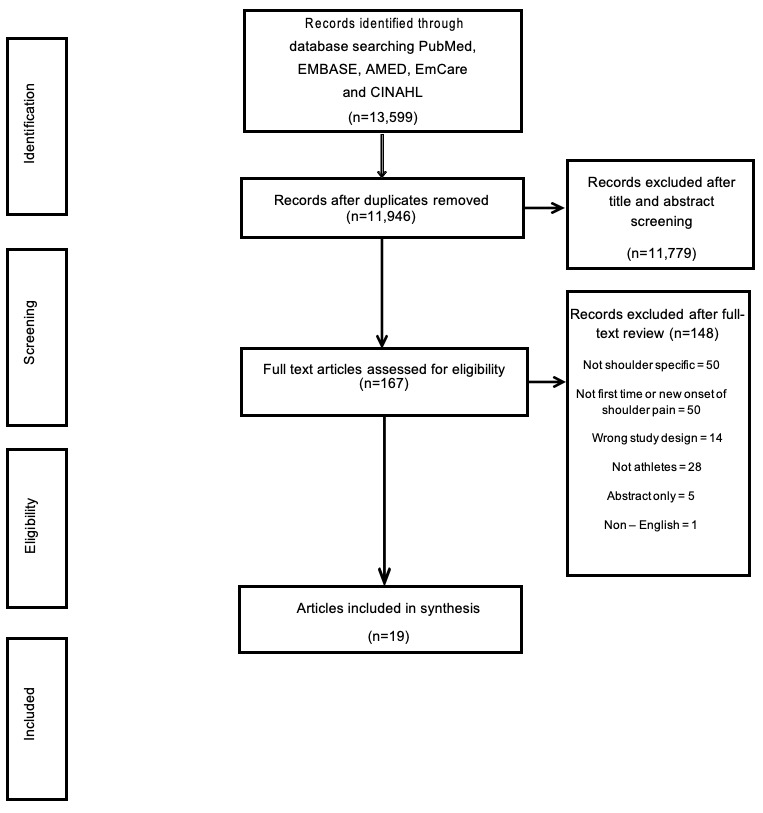
The search yielded a total of 13,599 citations, 1,653 duplicates were detected and removed to allow for 11,946 unique citations for screening of which after screening, a total of 19 studies were included in this systematic review (Figure 1). Four studies investigated baseball,5,17–19 five handball,20–24 three swimming,25–27 two tennis,28,29 two military,30,31 one cricket,32 one American football,33 and one examined multiple overhead sports.34 Overall, 7,802 athletes were studied (Table 2).
Methodological Design and Risk of Bias
One study was a randomized controlled trial21 and eighteen studies were prospective cohort studies.5,17–20,22–34 Thirteen studies received an overall rating of low risk of bias,5,17,19,21–23,26,28–32,34 six received an overall rating of moderate risk of bias18,20,24,25,27,33 with no studies rated as having high risk of bias overall. Element 2, study attrition, was what led to most articles receiving a score other than low, with three studies receiving a score of high risk of bias18,20,24 and ten receiving a score of moderate risk of bias.19,21,25–29,32–34 Element 4, outcome measurement, contributed to most articles rated as low risk of bias with only three rated as moderate20,24,27 and none rated as high. Seventeen of the included studies were considered Level 2 evidence and the remaining two case control studies considered Level 3.
Physical Factors
Anatomy
Increased glenoid retroversion as associated with an increased risk of posterior shoulder instability for those in the military service. Every one degree increase in glenoid retroversion there was an increased hazard of 1.17 (HR 1.17 [1.03-1.34]) is.30 In this population, decreased glenoid height to width ratio also demonstrated increased anterior instability hazard (HR 8.12 [1.07-61.72]).31
Among 46 adolescent swimmers (Female: 30; Male: 16) increased body mass index (BMI) (OR 1.48 [1.00-2.19]) demonstrated increased risk of developing shoulder pain. Additionally, humeral head position which included a smaller inferior Kibler distance in abduction (OR 0.90 [0.83 -0.97]), a smaller horizontal distance between the anterior humeral head and the anterior acromion (OR 0.76 [0.59-0.98]), and BMI (OR:1.48 [1.00-2.19]).26
An investigation of 113 recreational overhead athletes (Female: 59; Male: 54) found that less scapular upward rotation at 45° (OR: 1.038) and 90° (OR: 0.986) of humeral adduction during humeral elevation in the frontal plane were significant for developing shoulder pain.34
Range of motion
Both increased and decreased ROM in certain movements were found to increase the risk of shoulder pain or injury depending on the sport and in some cases sex.
Handball: A difference of >7.5° for external shoulder ROM on the dominant throwing shoulder (OR 4.1 [1.1-15.4]), compared to the non-dominant, demonstrated increased shoulder injury risk in handball players, irrespective of sex. A loss of >7.5° in the dominant throwing shoulder for men (OR 0.61 [0.5-0.8]) demonstrated a protective factor against shoulder injury, while a loss of 7.5° for women (12.50 [1.4-114.6]) demonstrated an increased risk of shoulder injury in handball players. The authors of this handball study surmise that the differing findings are likely due to a difference in exposure, pathomechanics and injury mechanics among male versus female handball players.20 In another handball study of 344 players (Female: 172; Male: 172) when stratified by sex, females that had decreased total ROM on their dominant shoulder compared to the non-dominant shoulder demonstrated no difference in hazard of arm injury (HR: 1.30 (0.59-2.83)). Males that had decreased total ROM on their dominant shoulder compared to the non-dominant shoulder demonstrated no difference in hazard of arm injury (HR: 0.77 (0.33-1.81).22
Swimming: Decreased shoulder flexion on the dominant shoulder did not demonstrate increased shoulder injury risk (OR 0.96 [0.918-1.004]) in competitive swimmers. Low shoulder external rotation (swimmers with <93° of external rotation) or high shoulder external rotation (swimmers with ≥100° of external rotation) both demonstrated increased risk of shoulder injury (Low: OR 11.1 [2.4-51.6]; High: OR 5.9 [1.3-28.05]) in competitive swimmers.27
Baseball: Among 296 professional baseball pitchers, insufficient external rotation, defined when a pitcher had 90° of abduction in the scapular plane of the throwing shoulder that was at least 5° greater than the non-throwing shoulder, demonstrated an increased risk of shoulder injury (OR: 2.2 [1.2-4.1]) and shoulder surgery (OR: 4.0 [1.5-12.6]). Total rotational deficit (OR:1.5 [0.8-2.8]; OR: 0.8 [0.3-2.1]), GIRD (OR: 0.6 [0.2-1.5]; OR: 0.5 [0.1-1.7]), and flexion deficit (OR: 0.6 [0.2-1.4]; OR: 0.7 [0.2-2.3]) demonstrated no significant difference in shoulder injury or surgery respectively.5
Cricket: In a sample of 115 female cricketers, dominant shoulder internal rotation ROM (OR: 0.98 [0.94-1.01]) and total ROM (OR: 0.99 [0.97-1.01]) demonstrated no difference in arm injury odds.32
Strength
Decreased dominant shoulder isometric absolute (OR: 10.70 [1.2-95.6] per 10 N) and body weight normalized strength (OR: 1.2 [1.0-1.4] per 0.1 N/kg) demonstrated increased risk for shoulder injury in handball players, irrespective of sex.20 Decreased ratio between the dominant shoulder external and internal rotation shoulder strength (OR 1.2 [1.1-1.5]) demonstrated an increased risk of shoulder injury in handball players.20 In another handball study of 344 players (Female: 172; Male: 172) when stratified by sex, females that had decreased isometric external rotation and internal rotation strength on their dominant shoulder compared to the non-dominant shoulder demonstrated increased hazard of arm injury (External Rotation: HR: 2.37 [1.03-5,44]; Internal Rotation: HR: 2.40 [1.06-5.61]). Males with decreased isometric external rotation and internal rotation strength on their dominant shoulder compared to the non-dominant shoulder demonstrated no difference in hazard of arm injury (External Rotation: HR:1.02 [0.44-2.36]; Internal Rotation: HR: 0.74 [0.31-1.75]).22 A smaller study (n=16) of female handball players demonstrated a significant increase in relative risk of shoulder injury when an overall muscular imbalance was present within the rotator cuff RR: 2.57 (1.60-3.54).23
Increased posterior shoulder muscle endurance on the dominant shoulder demonstrated decreased shoulder injury risk (OR 0.96 [0.916-0.998]) in competitive swimmers.25
Dominant shoulder internal rotation strength (OR: 1.00 [0.98-1.02]) and total ROM (OR: 0.99 [0.97-1.01]) or external rotation strength (OR: 0.98 [0.96-1.01]) demonstrated no difference in arm injury odds in female cricketers.32
Asymmetric hip strength demonstrated increased risk of shoulder injuries (RR 1.24 [1.06-1.46]) in professional pitchers.19
Behavioral Factors
Pain Profile
Youth baseball pitchers that had a history of shoulder pain (OR 3.34 [2.16-5.17]) or elbow pain (OR 1.53 [1.00-2.31]) demonstrated increased risk of sustaining a shoulder injury.18
Previous Injury
A previous trunk or lower extremity injury in the same season increased hazard of shoulder injury (HR 2.6 [1.2-5.6]) in professional baseball pitchers.17 Sustaining a previous shoulder injury increased hazard of subsequent shoulder injury (HR 9.3 [1.1-83]) in professional baseball pitchers.17
Psychological Factors
There was no association in Athletic Identity Scores and shoulder injury (HRR 0.89 [0.36-2.20]) in competitive adolescent tennis players.29
Environmental Factors
Physical Environment
American football players that played on grass demonstrated an increase in shoulder injury rates (Incidence rate ratio 1.36 [1.02-1.81]).33
Sport Specific Factors
Training Load
Increased acute:chronic workload ratio increased shoulder injury risk (OR 4.31 [1.001-18.537]) in competitive swimmers.25
Each workload spike in competition (HRR 1.26 [1.15-1.39]), fitness training (HRR 1.18 [1.09-1.27]), and or training/competition (HRR 1.22 [1.12-1.34]) increased shoulder injury hazard in tennis players.28
Increased training hours between 16 and 36 hours a week demonstrated increased shoulder injury risk (OR 2.00 [1.07–3.92]) in youth baseball players.18
Increasing training load by over 60% per week, demonstrated increased hazard of shoulder injury (HR 1.91 [1.00-3.70]) in youth handball players.24
Shoulder Injury Prevention Programs
Incorporating shoulder injury prevention programs reduced hazard (HRR 0.44 [0.29-0.68]) of shoulder injuries in handball players.21
DISCUSSION
Nineteen studies met the inclusion criteria for this review. There were a number of studies excluded because of the presence of shoulder pain at baseline or not able to be determined as described by the authors, and data that were not able to be separated out specific to shoulder as many investigated arm pain or combined both shoulder and elbow pain within their data. The risk of bias among the included studies was rated from moderate to low overall with no single study being identified as high risk of bias. Additionally, no study had more than two areas scored as high, with the areas of study attrition and study confounding being the only areas for any studies that were rated as high risk of bias.
Within the included studies, the first-time incidence of shoulder pain among athletes was found to be associated with the following risk factors; ROM, strength, pain, previous injury, and training load. It is important to note that these variables were investigated among various overhead sports, each requiring unique demands of the shoulder complex. Methods for quantifying these variables were not consistent among all studies. For example, strength was measured using different techniques such as handheld dynamometers and isokinetic testing devices, differing types of strength were also quantified such as isometric, eccentric, and reported in a variety of formats such as ratios, normalized to body weight, and absolute strength. Additionally, none of the 19 studies utilized the same definition for injury and or pain, with variations including location, time missed from competition or practice, needing to seek care from a medical provider, or utilizing a specific outcome measure. Inconsistencies in the definition of injury or pain make it difficult to move forward in this area of research regarding risk factors associated with shoulder injuries or pain and there needs to be a shift towards improving this shortcoming.35
Range of motion results exhibited the unique demands of each sport examined as they relate to risk factors. The risk factors for handball were seen in specific ranges of external rotation while among swimmers it was low and high shoulder external rotation that increased injury risk. Baseball players had increased risk around a variety of ranges including horizontal adduction, internal rotation, and external rotation. These results suggest that there may be value in athletes exhibiting a certain degree of ROM specific to their sport and its demands on the shoulder complex to prevent shoulder injury. The concept of ROM requirements for a specific sport and position has been widely studied among baseball pitchers where the incidence of shoulder and elbow injuries is significantly greater for those with glenohumeral joint external rotation and internal rotation asymmetries compared to the non-throwing shoulder.5,36,37
Strength was also examined among the same three sports as ROM. A decrease in strength, whether compared bilaterally, as a ratio, or below normative values when available, has long been thought to be a risk factor for injury. Examining various forms of strength throughout the entire kinetic chain is often part of various screening mechanisms for athletes and may form a foundation for the development of broad or specific training programs throughout the course of their season designed to reduce the risk of injury.13 Among handball players increased risk was associated with decreased isometric absolute strength, bodyweight normalized strength, and the ratio of external to internal rotation strength all compared to the non-dominant side. Reduced endurance of the posterior shoulder musculature was more revealing of risk for swimmers while among professional baseball pitchers it was asymmetrical hip strength that increased the risk of shoulder pain.
Having experienced pain in the elbow or shoulder or having a previous upper or lower extremity injury also resulted in an increased risk of shoulder injury among adolescent and professional baseball pitchers respectively. The relationship between previous injuries, whether it be to the shoulder, elbow, lower extremity, or trunk has not been extensively studied. Evidence of this risk factor is primarily seen in youth and professional baseball pitchers. The hypothetical rationale for this phenomenon is found within the extreme demand of the entire kinetic chain in order to achieve high pitch velocity. A “weak link” in the kinetic chain from a prior injury along with fatigue, over the course of an exposure or season, may increase the load on the upper extremity, particularly the shoulder and elbow.17,38,39
Examining the modifiable risk factors may assist with the development and implementation of injury prevention programs for overhead athletes. A systematic review by Wright et al.6 investigating the effectiveness of shoulder injury prevention programs in overhead athletes identified only three of the seven studies actually being able to reduce injury in the overhead athlete population.40–42 Modifiable risk factors included in the prevention programs consisted of strength and mobility in two40,42 of the studies and strength only in one41 of the studies. Both strength and ROM are modifiable risk factors identified through the current review of the literature in both the handball and baseball population. One modifiable risk factor that appeared across baseball, handball, swimming, and tennis was training load.18,24,25,28 There are many variables that factor into an accurate account of training load for athletes, which is often times under estimated. Examining exposure and dose as part of training load is a good first step but requires a detailed approach to each athlete and their specific position/sport demands .43–45 Although not something that could be implemented from an athletes training perspective, awareness and monitoring of training load by the coaching and sports medicine staff, where available, could help to further mitigate shoulder injuries.
The results of the current review suggest that even among overhead athletes, there are not only unique risk factors for shoulder pain but each of those risk factors is different for each sport. Although this may appear intuitive, these findings support the need for individualization of sports screening and injury prevention programs among different overhead sports and positions where appropriate. Considerations for moving forward in this area of research have been provided as they relate to risk factors associated with shoulder pain and injury within the athletic population based on the findings of the current study. (Table 4).
Limitations
One of the limitations of this study is the restrictive inclusion and exclusion criteria to investigate the specific aim of this study. Additionally, being able to determine studies where athletes were not experiencing pain or injury at baseline was not always clear as well as the variability in the definitions of injury and pain and how risk factors were measured. Finally, only studies published in the English language were included.
CONCLUSION
The results of this systematic review suggest that there are a number of modifiable risk factors associated with the new onset of shoulder pain among athletes from various overhead sports, including range of motion, strength, and training load. These findings may be used to tailor sport specific screens and injury prevention programs to address areas such as ROM, strength, and training load in order to mitigate shoulder injury risk. These findings are supportive of a “drilling down” approach to risk factors specific to body region, sport, and where applicable, position. Future research would benefit from determining and or adhering to specific definitions of injury and using these uniformly in methods used to quantify possible risk factors.
Conflicts of Interests
The authors report no conflicts of interest
Trial Registration
PROSPERO: CRD42020187086
Acknowledgements
Kelly Freehauf and Ethan Launstein for their work on data extraction quality checking.