
INTRODUCTION
Currently, there is no “gold standard” testing protocol for return to sport (RTS) decision-making. It is, however, recommended to include measures to identify physical deficits as part of a comprehensive evaluation.1,2 Physical performance tests (PPTs) can identify deficits in components of athletic performance, such as speed, agility, balance, and power, which may help inform RTS decision-making.3,4
The Star Excursion Balance Test and the lower quarter Y-Balance Test (YBT), measures of dynamic standing balance and neuromuscular control of the lower extremities, have been linked to increased risk of athletic injury, particularly among soccer, basketball, and football players.5–7 Although relationships with athletic injury have been observed, current evidence suggests that age, gender, and sport/activity should be considered when interpreting test results.7 For example, Plisky et. al.5 found reach distance in the anterior direction relative to leg-length greater than four centimeters was significant (OR ~ 2.5, p < 0.05) for predicting lower extremity injury among high-school basketball players. In contrast, Read et. al.8 found no significant relationship between absolute reach distance difference of four centimeters in the anterior direction and athletic injury among elite male soccer players. Additionally, differences in the quality of injury prediction among athletes categorized according to bone growth maturation were revealed, indicating greater relative reach distances among less skeletally mature athletes compared to more skeletally mature ones, although absolute reach distances were greatest among those who were more skeletally mature.
However, no high-quality evidence exists supporting the use of PPTs for assessing risk of secondary athletic injury, particularly among female athletes.9 Healthcare providers should exercise caution interpreting the results of current PPTs for RTS decision-making.10,11 The reasons for the shortcomings of RTS protocols are varied. One reason is that some RTS criteria previously studied have not been strict or comprehensive enough.12 Another reason is that they may not effectively measure the physiologic demands an athlete will be exposed to while participating in sports.13,14 Gokeler et. al.14 purported that current PPTs for ACL injury screening are “closed skills” and do not reflect actual physical demands on the field. Regardless, strict RTS criteria fail to explain relatively high initial athletic injury rates, highlighting the need to identify athletes at risk of injury prior to participation in sports.5,6
Before implementing a PPT into routine practice, its reliability should be verified. Also, to account for the effects of motor learning, multiple practice trials of a PPT are recommended prior to recording trials. In this manner, subsequent performance can be more confidently attributed to changes in physical performance and not a learning effect. The optimal number of practice trials for every PPT is variable and test dependent15–17; therefore, a PPT should undergo testing to confirm how many practice trials are required to achieve performance stabilization.
Additionally, PPTs should be validated within the population they are used. Soccer is a physically demanding sport requiring a combination of speed, cardiopulmonary endurance, muscular strength, muscular endurance, muscular power, and agility. Depending on the player position, these athletes may be required to run continuously, often upwards of 10 km during a single match, with variable intensities.18 In addition, players may be required to perform explosive movements, such as jump for headers, accelerate or decelerate quickly, and make quick directional changes. Also, players may need to be able to coordinate their movements while controlling a ball and react quickly to other players and the ball, which is particularly important for goalkeepers. Clearly, soccer requires a comprehensive set of physical abilities, but many clinical tests to assess physical performance only assess a single aspect of it, such as muscular power or agility. The Butterfly Agility Test (BAT) was developed to overcome this limitation and provide clinicians a more comprehensive assessment of physical performance among athletes participating in high-intensity sports involving running, jumping, and cutting, such as soccer.
The BAT has demonstrated good reliability (ICC = 0.89, 95% CI = 0.23-0.97), and moderate-to-strong relationships with multiple aspects of physical performance among young adults, including agility, muscular power, and speed (r = 0.50-0.77).19 The BAT includes tasks commonly performed in high-intensity sports and has potential utility as a pre-participation screening test or as a component to a comprehensive evaluation for RTS decision-making during the end stage of rehabilitation from an injury. However, the BAT has not been validated to identify the risk of athletic injury or for RTS assessment. Additionally, the BAT requires ~ 6 m2 of floor/ground space and a box 42 cm in height, which may not be conducive for some clinical practices with space limitations. Modifications to the original BAT may enable more clinicians to adopt the test in their clinical practice. Therefore, the purpose of this study was to determine the reliability of the modified BAT (mBAT) and the number practice trials required to optimize its reliability. A secondary purpose was to assess the preliminary validity of the mBAT associated with the Y-Balance Test (YBT) and its relationship with player position among competitive soccer athletes.
The research hypotheses were that 1) the mBAT would demonstrate excellent reliability and that its reliability would improve after multiple trials 2) the mBAT would demonstrate a statistically significant relationship with the results of the YBT, and 3) “defenders” would perform significantly better on the mBAT than athletes playing other positions among competitive soccer athletes.
MATERIALS AND METHODS
Design
A multi-phase reliability and validity study was designed. The study protocol was approved by the University’s research ethics committee prior to subject recruitment.
Participants
In Phase I, twenty-nine healthy adult participants were recruited from January to March 2022. In Phase II, forty-two competitive soccer athletes were recruited from July 2023-January 2024. A power analysis according to G-Power (version 3.1.9.4) indicated a minimal total sample of 14 subjects was needed to conduct a 2 x 10 repeated measures analysis of variance (ANOVA), 52 subjects for an independent t-test, 108 subjects for a chi-squared test, and 128 for a multivariate ANOVA with five groups.
Participants in either phase were excluded if they reported current pregnancy, low weekly exercise frequency and intensity, recent lower body pain while running, jumping, cutting, or shuffling, or were not cleared for unrestricted participation in sport activities. Additionally, subjects were excluded if they answered “yes” to any COVID-19 screening questions or any of the first seven questions of the Physical Activity Readiness Questionnaire (PAR-Q). Finally, if participants had a BMI > 30, they were excluded. All participants provided written consent prior to induction into the study.
Instrumentation
Each participant’s height and weight were measured using a physician’s scale (Detecto SP7044, Webb City, MO, USA) in Phase I. In Phase II, height and weight were self-reported by athletes. The YBT Kit (Functional Movement Systems, Inc. Chatham, VA) was used to measure dynamic single-limb standing balance in Phase II. In both phases, the mBAT was measured with a hand-controlled stopwatch (Robic 1000W; Waco, Tx, USA).
Materials and Conditions
During Phase I, testing was performed inside a temperature-controlled room on a wooden platform floor; room temperature and humidity was 68° F and 30%, respectively. All participants wore athletic footwear and apparel during testing. Also, a 46 x 57 x 30 cm hand-made wooden box with a vulcanized rubber top surface was utilized for mBAT testing. During Phase II, testing was performed outside on artificial turf or track; ambient temperature and humidity ranged 64°-92° F and 21-79%, respectively. All athletes wore standard soccer cleats and team jerseys during mBAT testing, although cleats were removed for the YBT; also, shin guards were removed for all testing. Finally, a 32 x 32 x 31 cm metal-framed platform (Rage Fitness, CF-PB012/S, Gibson Athletic, Denver, CO) with a vulcanized rubber top surface was used for mBAT testing.
Test Administration
Prior to testing, all participants received verbal instructions with a demonstration of testing procedures and were guided through a five-to-ten-minute dynamic warm-up. Each physical performance test was administered as follows.
Modified Butterfly Agility Test (mBAT)
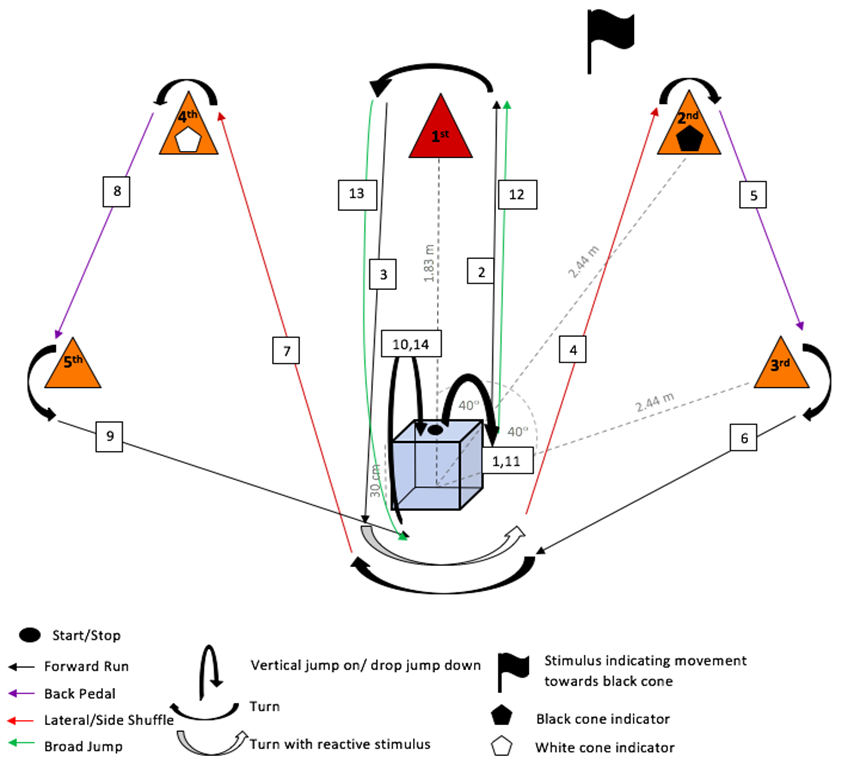
To setup the test, distances between the front and center of the box/platform and each cone were measured as measured using a fiberglass tape measure (Empire 100’ Long Reel, Mukwonago, WI, USA). Next, the angle between each cone and the midline was measured with a universal goniometer. Once ready to begin a trial, each subject began the test while standing on top of the box/platform. Then, each subject was instructed to complete the steps of the test as quickly as possible without errors (Figure 1). The assessor(s) used either a black or white flag, approximately 18 x 15 cm in dimension, held near the center of their chest during step 3, to indicate the next cone subjects were to move toward during step 4. The assessor(s) used hand-timers (Robic 1000W; Waco, Tx, USA) to measure the time required for subjects to complete each trial.

Y-Balance Test (YBT)
The YBT protocol described by Plisky et. al.20 was utilized. Without shoes, each subject stood in single-limb stance on the YBT platform with their longest toe touching the starting demarcation line. Next, subjects were instructed to slide the reach indicator with their contralateral lower extremity as far as possible along the measurement rod. If a subject lost balance during the test, lost contact with the reach indicator, or demonstrated inappropriate use of the reach indicator, the trial was repeated. Subjects performed maximal reaches in the anterior, posterolateral, and posteromedial directions associated with the device.
Data Collection
During Phase I, three independent assessors recorded trials. The principal investigator, a physical therapist (PT), recorded all trials for each participant and two student physical therapists (SPTs) alternated recording trials. This procedure allowed for assessment of concurrent inter-rater reliability between each SPT and the PT and intra-rater reliability across trials for the PT. Also, testing errors were assessed visually and a survey about the testing experience was administered by a third SPT. During Phase II, testing was administered and recorded by two PTs and five SPTs.
During Phase I, participants performed the mBAT ten consecutive times with three-minutes of rest between each trial. During Phase II, the mBAT and the YBT were performed, in random order, twice with one-minute of rest between each trial; the mean of two recorded trials of each test was used for statistical analysis. Subjects completed a post-test survey regarding areas of difficulty during testing.
Statistical Analysis
Statistical analysis was performed by the principal investigator. Data were analyzed using Statistical Package for Social Sciences (SPSS) version 27 (IBM Corp., Armonk, N.Y., USA). Alpha level of significance was set at 0.05 and power at 0.80 for all analyses. Outliers were identified using the outlier labeling technique. Participants with outlying datum in three or more trials were excluded from final data analysis. For Phases I and II, data from 25 and 42 participants were included in the final analysis, respectively.
Descriptive statistics, chi-squared tests of independence, and independent t-tests were used to analyze subject characteristics in both phases (Table 1). In Phase I, a repeated measures analysis of variance (ANOVA) with post-hoc paired t-tests were used to analyze differences between trials among subjects. Pearson’s product-moment correlation coefficients were calculated to determine the relationships between each set of trials; correlations were considered strong if greater than 0.75, moderate if between 0.50 and 0.75, and fair if less than 0.50. Inter- and intra-rater reliabilities were analyzed using intraclass correlation coefficients (ICC3, 1); reliability was considered to be “excellent” for measures yielding a coefficient of 0.90 or higher, “good” for values between 0.75 to 0.89, “moderate” for values between 0.50 to 0.74, and poor if less than 0.50. The levels of acceptable coefficients for correlations and reliability were based upon previously recommended guidelines.18 In phase II, an ANOVA with post-hoc Scheffe comparisons was used to analyze mBAT and YBT performance differences between player positions. Additionally, post-hoc independent t-tests were used to analyze mBAT and YBT performance differences between two player positions. A comparison of mean mBAT performance between Phases I and II was performed with an independent t-test.
RESULTS
Overall, two of three research hypotheses were rejected and one was unable to be rejected. Among the rejected, the mBAT did not demonstrate a statistically significant relationship with the YBT and defenders did not perform better than other player positions. However, both the intra- and inter-rater reliability of the mBAT were found to be excellent.
Subject characteristics differed between Phases I and II (Table 1). Although there were no differences in height, weight, or gender between subjects in Phases I and II, subjects in Phase II participated in competitive sport, exercised with greater intensity and for longer duration, and performed better on the mBAT compared to subjects in Phase I. Fifty-five percent of athletes in Phase II were females competing in NCAA Division I, whereas 45% were males competing in Alabama 6A high-school soccer. Regarding player positions, most athletes, 40% (n = 17), reported playing “forward,” 17% (n = 7) were “wide defenders,” 14% (n = 6) were “wide forwards,” 12% (n = 5) were goal keepers,10% (n = 4) were “defenders;” and 7% (n = 3) did not report their position. Lastly, 31% (n = 13) reported having sustained a lower extremity injury within the prior 12-months.
In Phase I, significant differences in mBAT times were found between trials (F [1,24] = 3,017-3,070, p < 0.00). The mean mBAT times were 19.30 ± 2.50 seconds across trials 1-3, 16.98 ± 1.85 seconds across trials 4-6, and 16.33 ± 1.64 seconds across trials 7-10 (Figure 2).

Mean mBAT times (left y-axis) ± s.d. measured concurrently by a PT (green circles) and a SPT (red squares) across ten trials (x-axis) during phase I of the study are displayed. The sum of errors (black triangles, right y-axis) committed by all subjects across trials in phase I of the study are displayed. A trend towards reduced mBAT times and a lower number of errors committed during each trial was observed across trials, with the lowest times and errors observed during trial ten. mBAT = modified Butterfly Agility Test, s.d. = standard deviation, sec. = second, PT = physical therapist, SPT = student physical therapist
Pairwise comparisons of mBAT times measured by either the PT or SPTs revealed no significant differences between trials 1 and 2 (p = 1.00), between trials 1 and 3 (p > 0.05), or between trials 2 and 3 (p > 0.34); however, significant differences were found between trial 1 and trials 4-10 (p < 0.00), trial 2 and trials 4-10 (p < 0.00), and trial 3 and trials 4-10 (p < 0.04); differences between trials 4-10 were variable (p = 0.01 – 1.00). Also, moderate correlations were found between each of the first two pairs of mBAT trials (r = 0.55 – 0.70; p < 0.00) and strong correlations were found in the remaining seven pairs (r = 0.77 – 0.89; p < 0.00), indicating data stabilization after the third trial and agreement with the first research hypothesis, which anticipated improved mBAT performance across multiple trials.
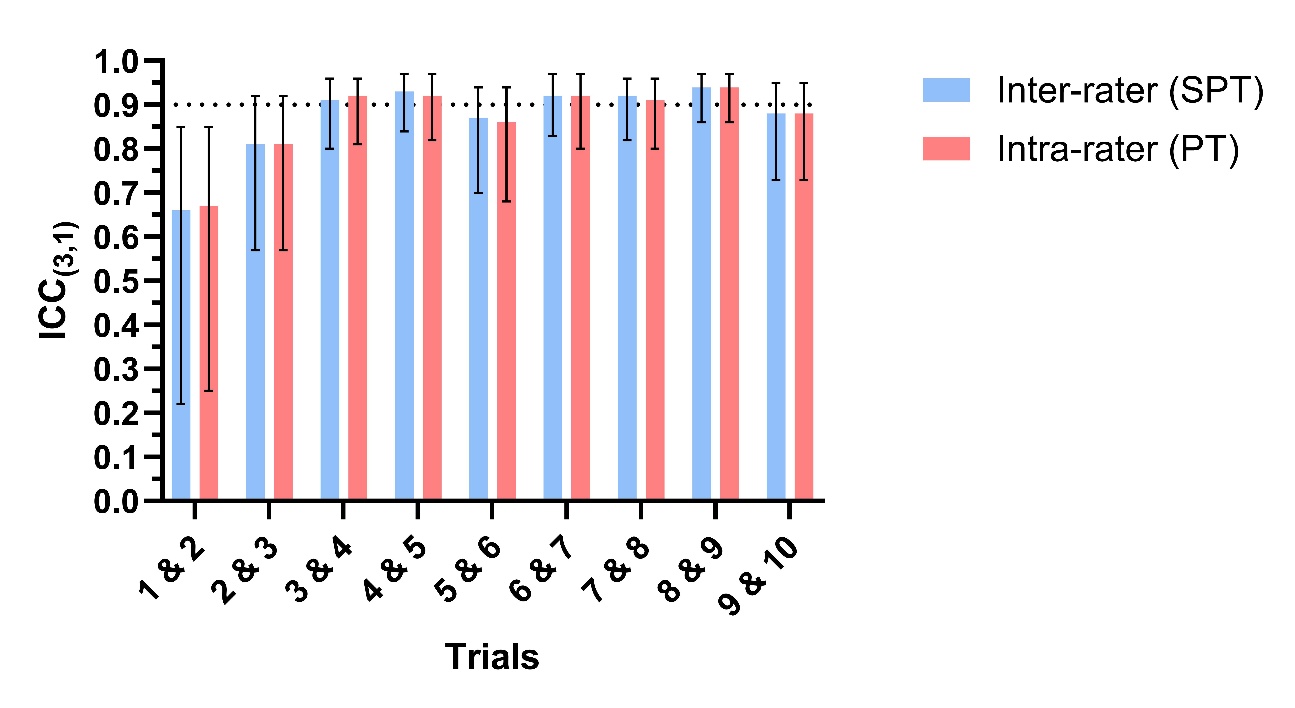
Similarly, agreement with the first research hypothesis anticipating excellent mBAT reliability was observed. The assessors’ (i.e., PT and SPTs) concurrent inter-rater reliability was excellent during each mBAT trial. Also, test-retest inter-rater and intra-rater reliability among the SPTs and the PT, respectively, was moderate between trials 1 and 2, was good between trials 2 and 3, was excellent between trials 3 and 4, and was excellent between trials 4 and 5. Test-retest reliability among both SPTs and the PT between the remaining trials (i.e., 5-10) varied from good to excellent (Table 2 and Figure 3).

Inter-rater and intra-rater test-retest reliability point estimates surpass 0.90 threshold (black dotted horizontal line), indicating excellent reliability, between trials 3 and 4. Also, the 95% confidence intervals (black t-bars) become narrower between trials 3 and 4, indicating improved measurement precision relative to trials 1 and 2 and trials 2 and 3. ICC(3,1) = intraclass correlation coefficient, SPT = student physical therapist, PT = physical therapist, mBAT = modified Butterfly Agility Test
According to the post-test survey in Phase I, participants reported the most difficulty with coordinating broad jumps (80%) and lateral shuffling (12%). Also, most participants (64%) reported they gained confidence in their performance after the third trial. Objectively, a total of 236 errors were committed among all participants, of which 110 (47%) were committed within the first three trials. Most errors were committed during the first trial (22%). A strong correlation was found between mBAT and the total number of errors committed during each trial (r = 0.96; p < 0.00), indicating more errors were associated with worse mBAT performance (Figure 2).
In Phase II, the mean mBAT and relative composite YBT were 13.68 ± 0.91 sec. and 0.98-0.99 ± 0.07%, respectively, however no significant correlations were observed between the mBAT and the YBT (r = 0.21-0.22, p > 0.17), indicating that these tests may not assess the same aspect of physical performance. Therefore, the second research hypothesis was rejected, which anticipated a statistically significant relationship between these PPTs. Similarly, no significant relationships were found between player positions and either the mBAT (F[4] = 0.81, p = 0.53, η² = .09, 1-β = 0.23) or YBT (F(8) =0.54, p = 0.82, η² = .06, 1-β = 0.23), which led to the rejection of the third research hypothesis anticipating better performance among defenders compared to other position players. However, moderate relationships were found for age (r = - 0.48, p < 0.00) and height (r = 0.32, p = 0.04), indicating relatively older and shorter athletes performed better on the mBAT. Finally, significant differences in mBAT performance between athletes in Phases I and II were found (t(38) = 9.76, p < 0.00, d = 3.27), which indicated competitive soccer athletes performed better on the mBAT than gender and body composition matched recreationally active adults.
DISCUSSION
The results of the current study are consistent with a previous study assessing the reliability of the BAT,19 which provides additional evidence that the mBAT is a reliable test among young recreationally active adults. The current study implemented modifications to the BAT, which included reducing box/platform dimensions and changes to the cone orientation. The box/platform height was reduced from 42 cm to 30 cm in order to reduce the cost of implementation and to improve participant safety. Also, a 30 cm box/platform height is consistent with what is used in other PPTs, such as the drop jump21,22 and Landing Error Scoring System23,24 tests, which reduces the need for additional equipment to conduct all of these tests. Additionally, the distance between the box/platform and the first cone was reduced from 3 m to 1.83 m, a reduction of 1.17 m. These changes may enable clinicians to implement the mBAT in smaller spaces where the original BAT would be space prohibitive.
In Phase I, the results indicated that three mBAT practice trials should be performed before recording trials in order to optimize test reliability. Not only was this indicated objectively, but subjectively as well. An analysis of errors committed across trials and participants indicated a disproportionate number of errors occurring during the first three trials (i.e., 47%). These errors were likely influenced by the cognitive process of motor learning.25 In Phase I of the current study, only 20% of participants reported confidence in their performance within the first three trials, further supporting the need for at least three practice trials. Since no detrimental effect was observed in performance after the third trial, the effect of fatigue during latter trials was negligible, which indicates the three-minute rest period was excessive for physiologic recovery between trials. In fact, the mean mBAT times continued to improve after trial four, indicating continued performance improvement with successive trials. Overall, the mean mBAT measured by both sets of assessors were worst during trial one and best during trial ten, with a difference in mean time of 4.7 sec. between the two trials. However, this difference should be interpreted with caution considering overlapping error margins across all trials (Figure 2). Additionally, the results demonstrate that the mBAT does not require extensive training, knowledge, or time to conduct, which makes it conducive for clinical practice among clinicians with various experience levels, including SPTs.
In Phase II, female collegiate competitive soccer athletes performed better on the mBAT than high-school competitive males, providing preliminary evidence the mBAT may be able to distinguish between levels of athletic ability. Although there was no significant difference in mBAT between five different player positions, the analysis was underpowered (1-ẞ = 0.23).
Limitations
The small sample size was a limitation of the current study, particularly in Phase II, which may have caused a Type II error. Previous studies assessing test reliability of the BAT, YBT, or Star Excursion Balance Test have used a sample size less than twenty-five, as used in the current study.19,20,26,27 Therefore, the authors believe the sample size was sufficient in Phase I to address the research question. However, in Phase II, a univariate ANOVA analyzing differences in mBAT performance between five player positions demonstrated a poor effect size with inadequate power (η² = 0.09, 1-ẞ = 0.23), which favors the probability of a Type II error having occurred.
Another limitation was the differing environments where testing was conducted between Phases/groups. Subjects performed the mBAT indoors during Phase I, whereas they performed it outdoors in Phase II. Also, the mBAT was performed on a wooden platform in Phase I and either on artificial turf (i.e., girls) or a rubber track (i.e., boys) in Phase II. Additionally, within Phase II, data for the boys were collected in January, whereas they were collected in late July for the girls, indicating a 28° ambient temperature and a 58% humidity difference between testing environments for the two groups.
Diverging methodologies between Phases I and II was another limitation. First, the box used for the mBAT had different dimensions between Phases I and II. Although both boxes were approximately the same height, the box used in Phase I was 14 cm longer and 25 cm wider than the box used in Phase II. A commercially produced box was implemented in Phase II in order to allow multiple tests to be performed simultaneously. Additionally, the authors believed that the rubberized top and base stabilizers provided with the commercially produced box would enhance participant safety and facilitate accessibility of materials used to conduct testing. Therefore, differences in mBAT performance between Phases and groups during Phase II should be interpreted with caution. Second, rest periods between trials differed between Phases I and II. In Phase I, three minutes of rest was provided between trials, whereas only one minute of rest was provided in Phase II. Although different, the authors learned from Phase I that three minutes of rest between trials was excessive. In order to improve data collection efficiency during Phase II, the rest time was reduced to approximately one minute which appeared sufficient as no participant was forced to initiate a trial prior to self-reporting readiness to begin.
Future studies should include large prospective designs (i.e., a minimum sample size of 130) with a standardized protocol to determine whether or not the mBAT can differentiate levels of performance among athletes and to determine the predictive ability of the mBAT to identify individuals at risk of initial or secondary athletic injuries. Also, normative mBAT values and cutoff scores for both pre-participation sports screening and return to sport decision-making should be established among various sports and athletic skill levels. If more measurement precision is desired, an electronic timing gate system could be integrated into the test. Similarly, an electronic light system could be integrated to reduce the burden on the assessor during the reactive component of the test. Finally, additional measurements, other than time, could be added to the test, such as a qualitative or quantitative assessment of joint kinematics, kinetics, muscle activity, or other physiologic tests, which may be useful for comparison of physiologic demands of testing with those required of players during competitive play.
CONCLUSION
The mBAT is reliable, quick to administer, inexpensive to deploy, and can be implemented by clinicians with various experience levels, including SPTs. It requires a 30 cm box, a stopwatch, five small cones, two different colored flags, and ~6 m2 floor area. A dynamic warm-up with specific instruction focusing on broad jump technique should be administered and three practice trials should be performed before averaging the results of multiple recorded trials. When using a hand-timer for measurement, the precision of the measurement is estimated to be about 0.5 seconds. A change in time of two seconds is suggested as the threshold to indicate a significant performance difference. The mBAT can be deployed indoors or outdoors with modifications and may have potential to distinguish physical abilities among athletes, which could be useful information for coaches and trainers for player position assignment and training regimen prescription. Although data associated with the current study is considered preliminary, the mBAT shows promising utility and may be considered for inclusion within a pre-sport participation testing battery or for return to sport decision-making among competitive soccer athletes. However, large prospective validation studies are warranted prior to using the mBAT for clinical decision making.
CONFLICTS OF INTEREST
The authors report no conflicts of interest.
ACKNOWLEDGEMENT
We would like to thank Cynthia McKinnis, Rachael Smith, Caroline Manemann, Nathaniel Roberts, Madeleine Gill, Cade Harris, Andrew Allen, and Alexandra Hall for their contribution to this work