


INTRODUCTION
Over one million sports-related lower extremity injuries are estimated to occur every year.1 These lower extremity injuries can adversely impact performance and lead to disability due to pain, weakness, loss of motion, impaired balance, and diminished neuromuscular control.2–7 The American Physical Therapy Association clinical practice guidelines recommend functional performance tests for assessing impairments of body function and for predicting lower extremity injuries.2–7 Among these tests, the Star Excursion Balance Test (SEBT) is commonly used by researchers and clinicians.7–9
The SEBT is a functional test that requires components such as strength, range of motion, balance, and neuromuscular control, with evidence supporting its reliability, validity, and responsiveness.8–16 The SEBT has been found to be useful for assessing functional performance in individuals with groin pain, femoroacetabular impingement (FAI), hip arthroscopic surgery, great trochanteric pain syndrome, anterior cruciate ligament (ACL) injuries, patellar tendinopathy, patellar femoral pain, ankle sprain, and plantar fasciitis.10–16 It is also used to differentiate reach distance values between injured and uninjured population.8,9,12,17–60 Traditional methods measure an individual’s performance on the SEBT utilizing a standard tape measure which require the clinician to assume a hands-and-knees position to record each of the reach distances based on visual assessment.8,9 This method, given the multiple recordings in each direction, is time-intensive and inefficient. Additionally, visual assessment may cause potential errors due its inherent imprecision. Therefore, a computerized version of the SEBT would facilitate efficient and precise measurements and allow it to be more practical for use in clinical practice.
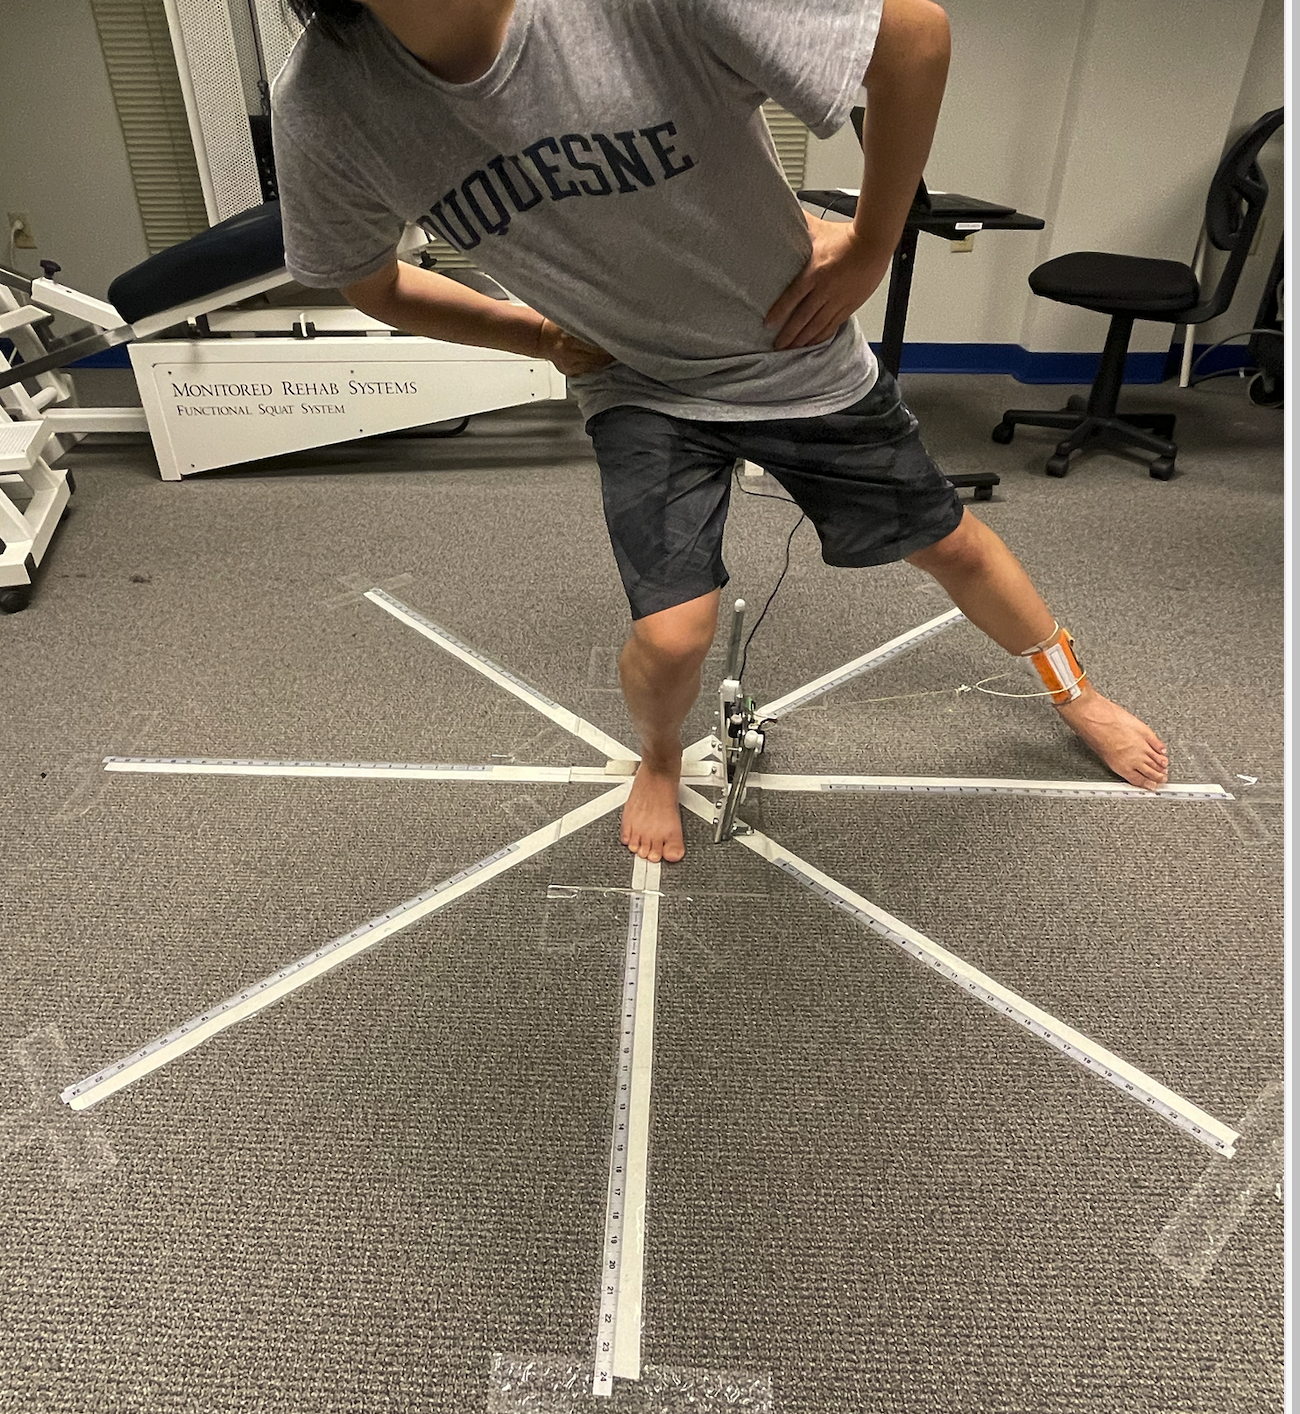
A new device called the Star Performer™ (GDE Technologies; Townsend, DE) (Figures 1 and 2) has been developed as a computerized version of the SEBT. The Star Performer™ automates the measurement process with real-time continuous data collection, data storage, and visual feedback displays. Additionally, the software can present graphs of reach distances, including radial plots, that allow for comparison of the reach distances on each leg to facilitate interpretation of an individual’s performance. By improving the convenience and precision of the SEBT, the Star Performer™ holds promise for broader clinical use.

While the Star Performer™ theoretically has significant advantages, there is no current evidence to support its usefulness. Therefore, the purpose of this study was to investigate the test-retest reliability of Star Performer™ device and compare its validity to traditional SEBT methods. It was hypothesized that the Star Performer™ will have excellent test-retest reliability and strong correlation with the traditional SEBT methods in individuals with lower extremity injuries.
METHODS
Subjects
A sample size of 26 was calculated using methods described by Bonett et al,61 with values as follows: ICC=0.85, w=0.2, k=2 and zα/2 =1.96. Accounting for potential dropouts, 30 participants were included in the study. Participants were eligible if they were aged between 18 and 45 years and had sustained a lower extremity injury (hip, knee, foot, or ankle) in the prior six months, as diagnosed by an athletic trainer, physician, or physical therapist. Exclusion criteria included weight bearing limitations, a neurological disorder, pain with walking, and/or conditions that prevented the ability to stand on one leg. Subjects who sustained injuries or underwent balance training during the one-week test interval were also excluded. Of the 30 initial participants, five did not complete the study. Three participants withdrew between the first and second visits due to injuries, while the other two participated in balance related training during the one-week follow-up interval. Therefore, a total of 25 injured legs were included in this study. Written informed consent and authorization to disclose protected health information for a research study were obtained from all participants in accordance with the Ethics Committee of the Duquesne University.
Data collection
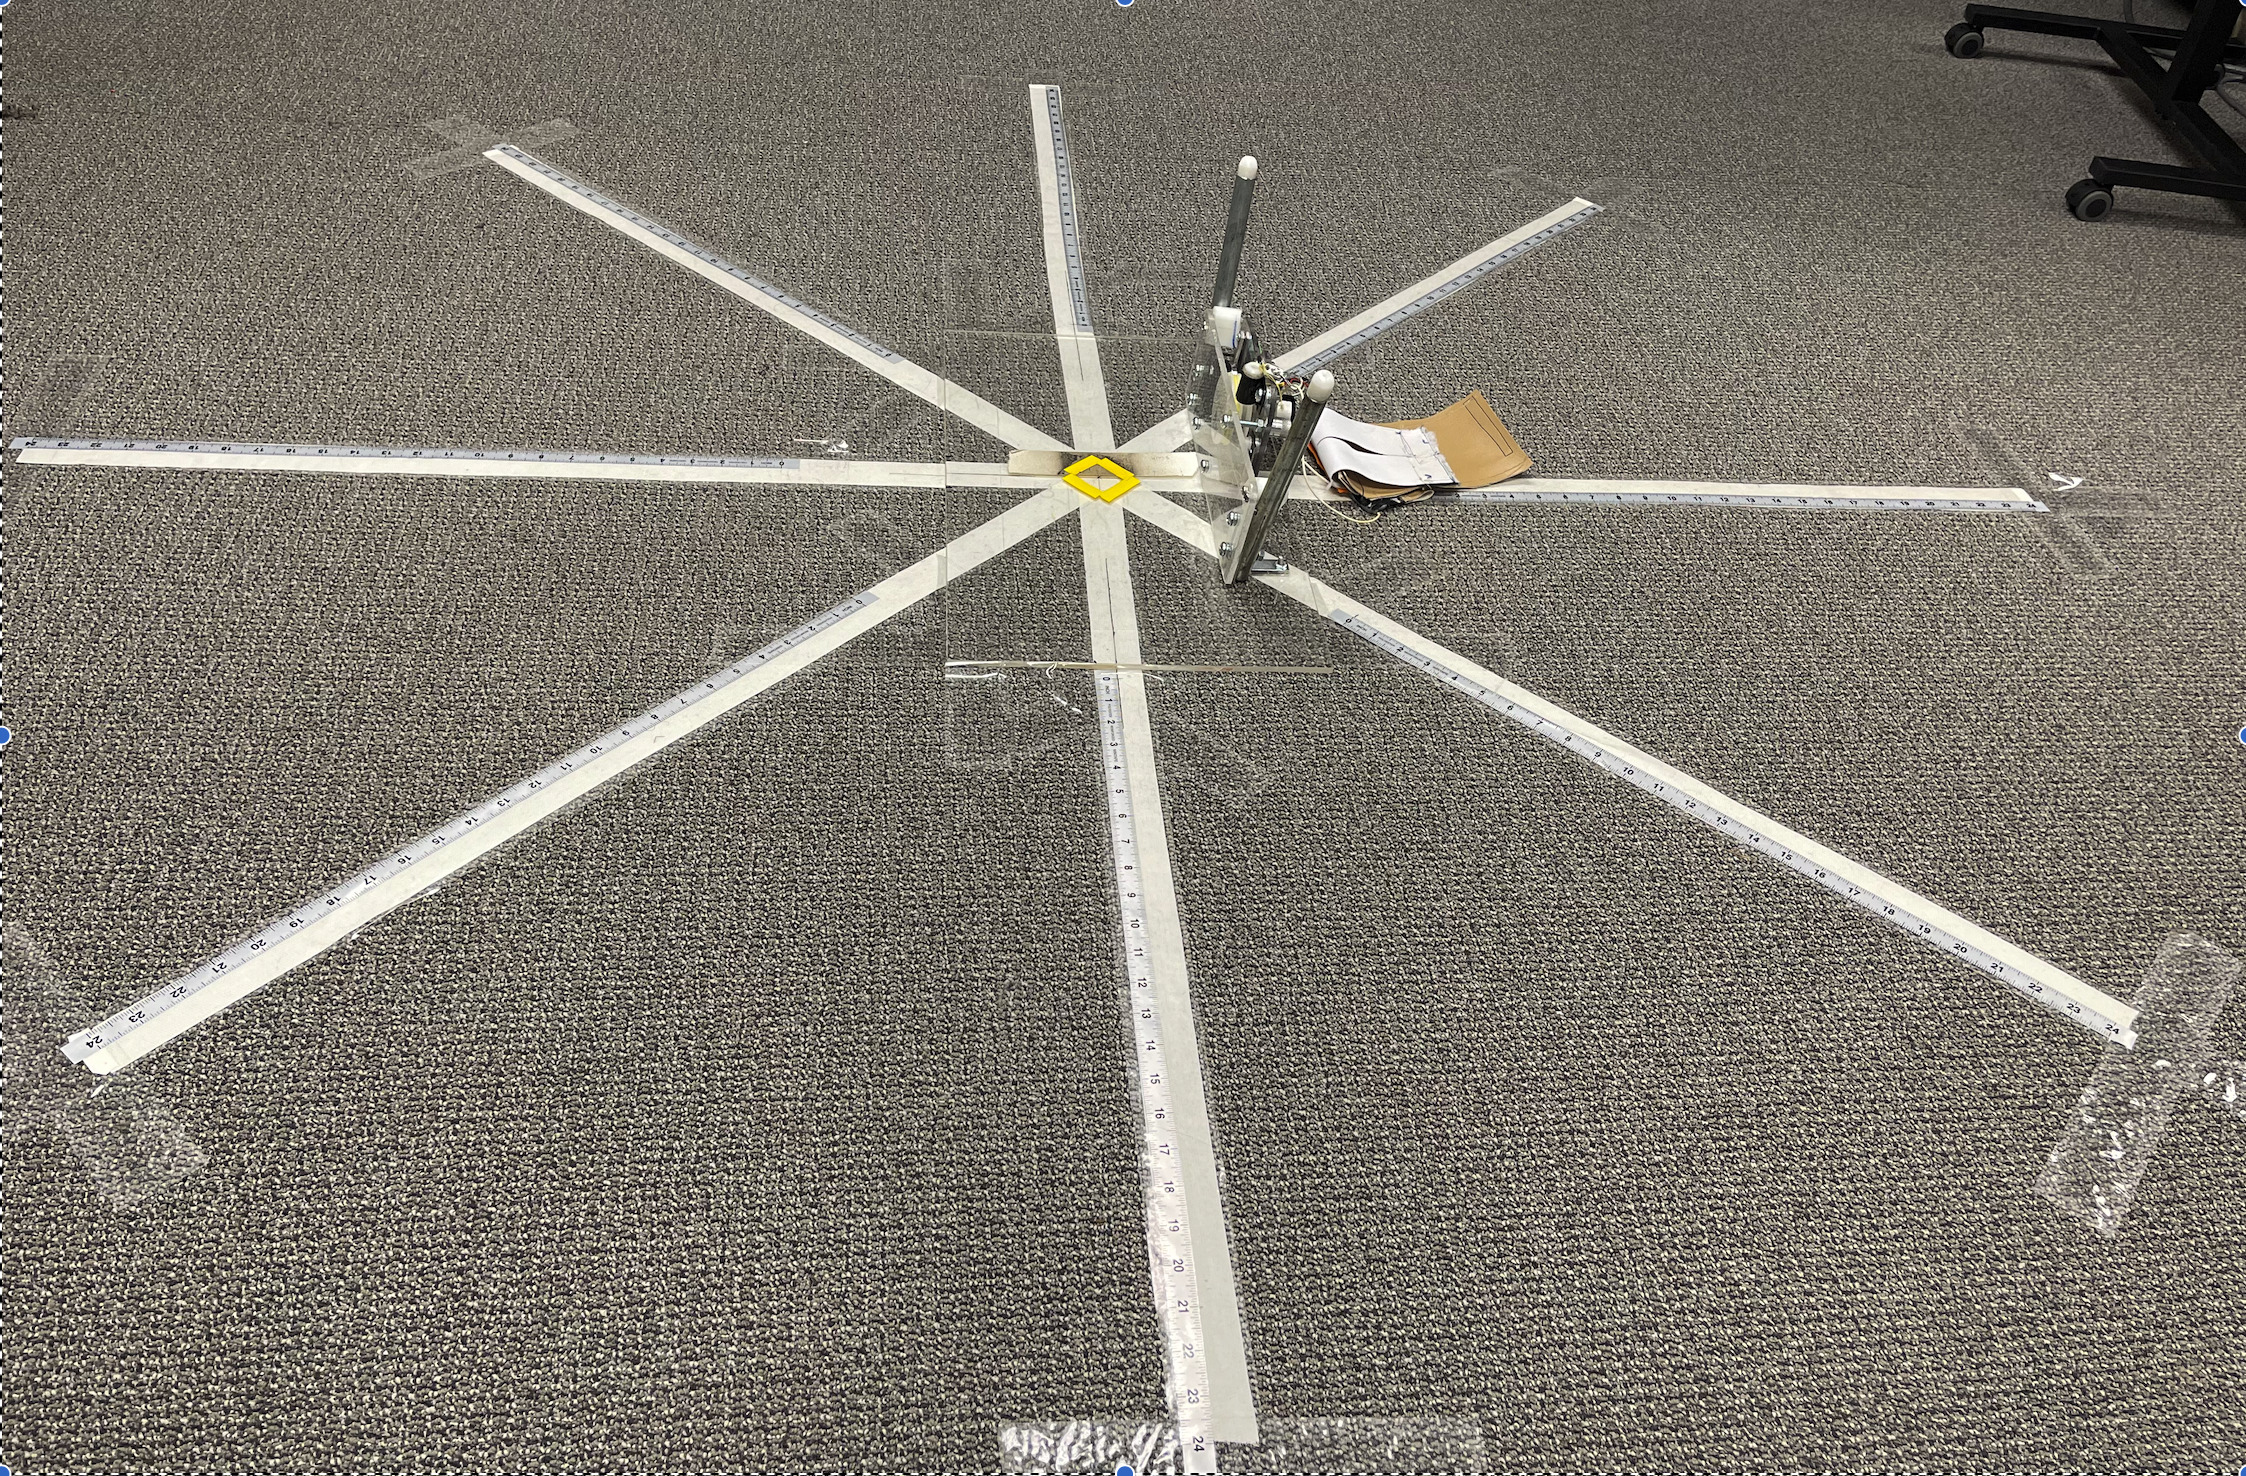
Subjects completed the Lower Extremity Functional Scale (LEFS), University of California at Los Angeles (UCLA) Activity Scale and Visual analog scale (VAS) prior to testing. The LEFS is a 20-question patient-reported outcome measure that assesses an individual’s ability to participate in everyday activities with activities ranked on a 4-point scale from “unable to perform” to “no difficulty” with total scores ranging from 0 to 80. The LEFS has appropriate psychometric properties for assessing lower extremity functional performance.62–64 The UCLA Activity Scale is a 10-point activity scale that evaluates a patient’s activity level from 1 (low) to 10 (high) that has appropriate psychometric properties for assessing physical activity levels.65–67 The pain Visual Analogue Scale (VAS) is a 10-cm line, which represents a continuum from “no pain” to "worst pain imaginable.68 Each participants’ lower limb length was measured from the anterior superior iliac spine to the most distal portion of the medial malleolus with a standard tape measure.8,9 A metric tape measure was adhered on each direction of SEBT.8,69,70 (Figure 2) The distance from the center of the circle to the point where the subjects’ toe touched each line was recorded by the same examiner. The SEBT performance was measured with the traditional tape measure method while the Star Performer™ simultaneously collected and recorded data.
SEBT
The SEBT was performed as described by Olmsted et al.71 In summary, the SEBT was made with four strips of athletic tape 244cm in length. All lines were separated from each other by a 45° angle forming the shape of a star. Directions of anterior, anteromedial, anterolateral, medial, lateral, posterior, posteromedial, and posterolateral were defined by the stance leg. Tape measures were adhered on each direction of the SEBT.
Star Performer™
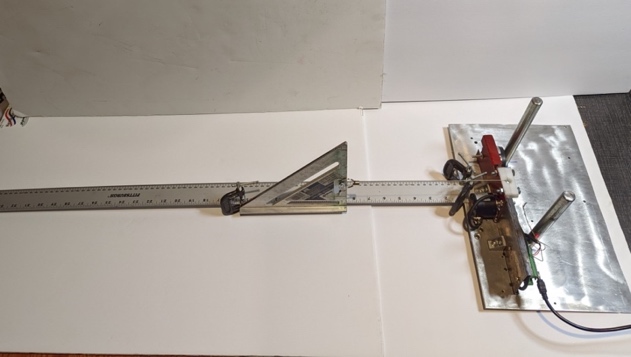
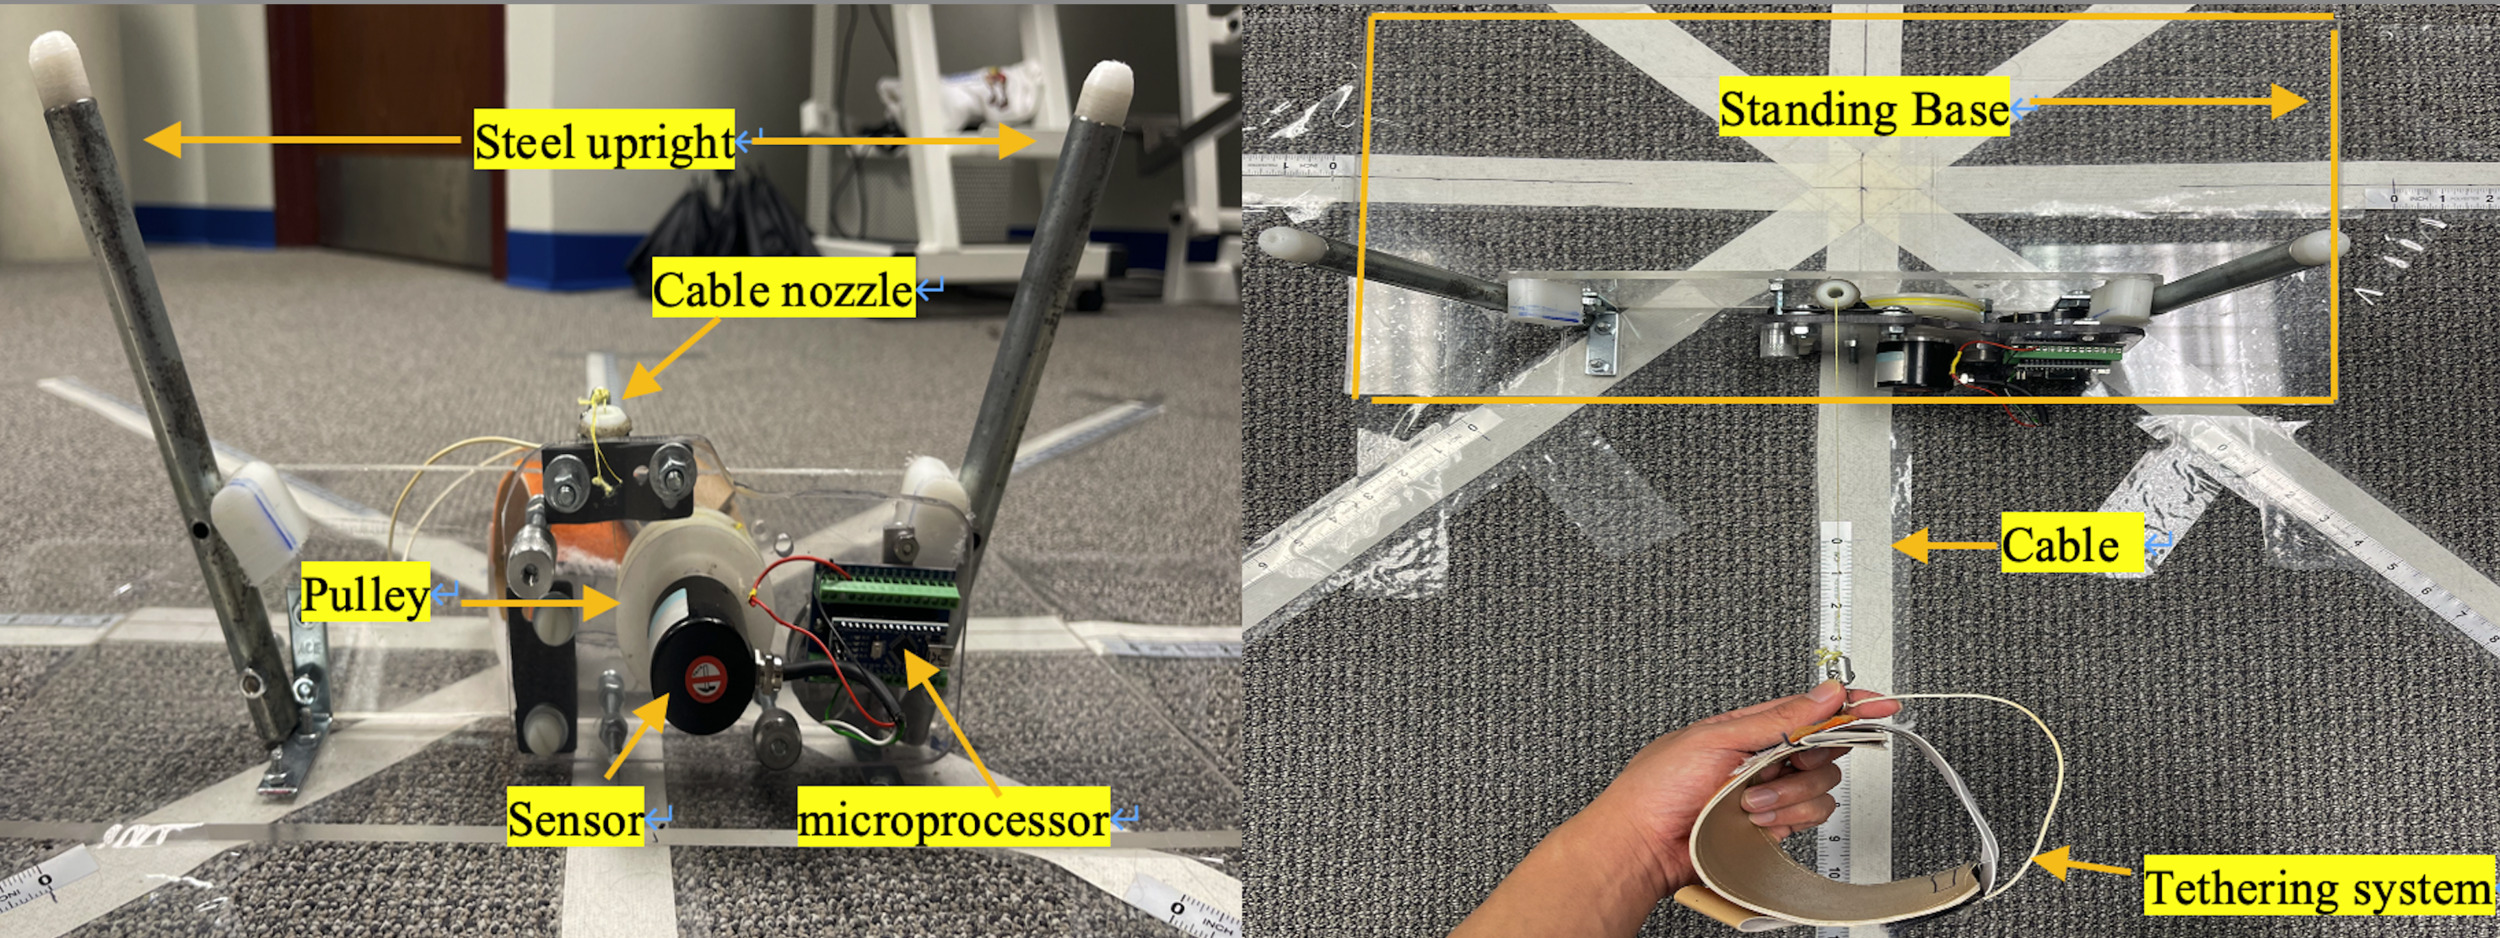
The Star Performer™ (Figure 3) electronically measured the maximum reach distance in all eight directions of the SEBT while collecting real time distance, speed, and acceleration of movement data. The device is composed of a standing base, tethering system, cable, pulley, sensor, and microprocessor. (Figure 3) The Star Performer™ measures and records distance using a custom preprogrammed microprocessor and customized Star Performer software™ with data stored and displayed on a laptop computer. Measurements taken by the Star Performer™ were calibrated and accuracy prior to the study and confirmed using a standard aluminum meter stick. (Figure 4)

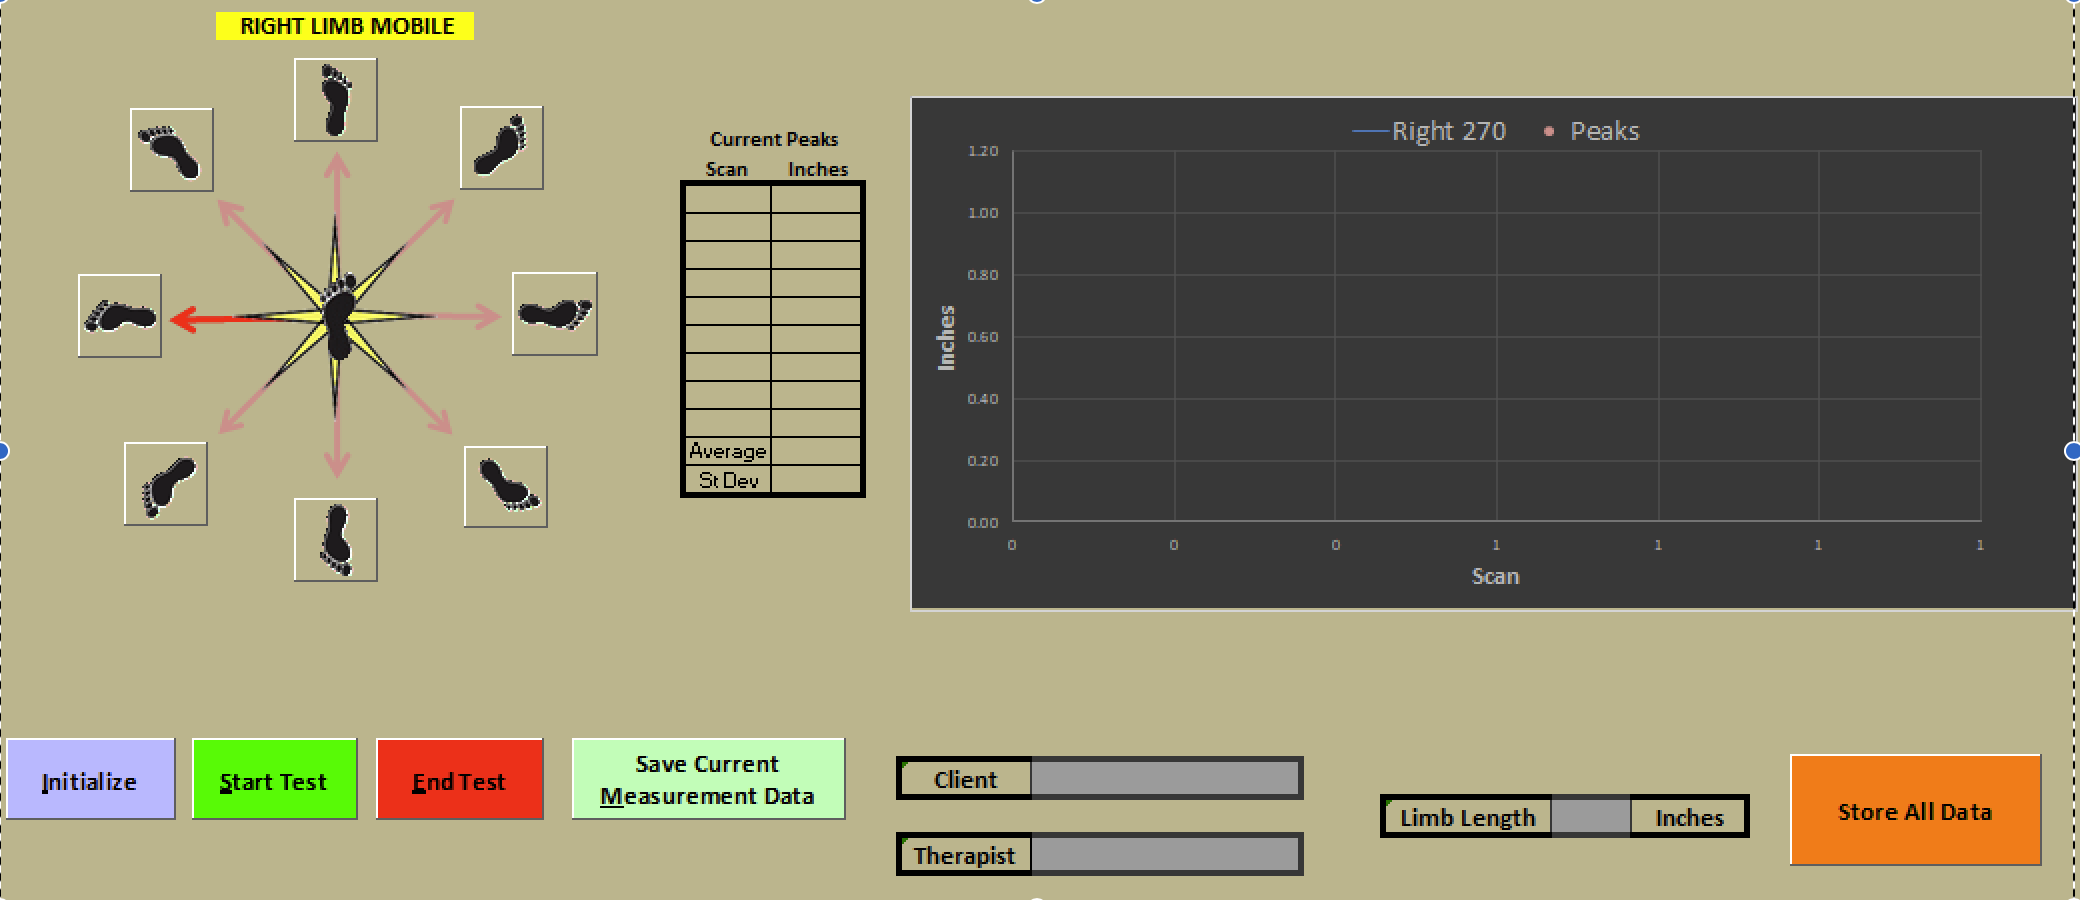
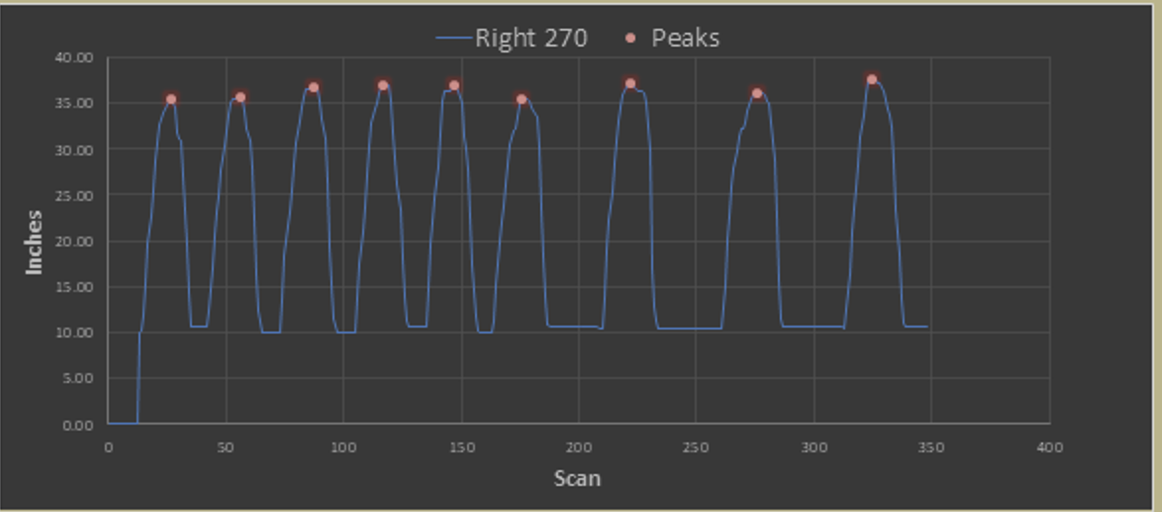
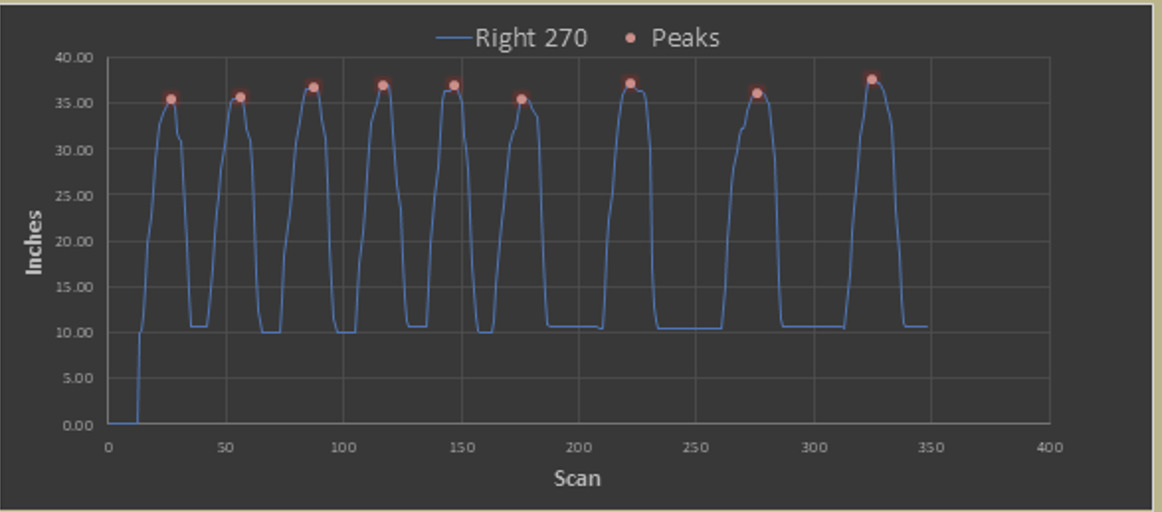
The Star Performer™ records data directly into the Star performer software™ in real time and simultaneously graphs the subjects’ reach during each maneuver. (Figure 5). When the test is completed, the reach distances can be graphed (Figure 6) and a comparison of the bilateral legs’ reaching distances represented in a radar plot (Figure 7).


SEBT and Star Performer™ Procedures
During the test process, the Star Performer™ was performed concurrently with the standard measurements of the SEBT. The Star Performer™ calculates the distance from the lateral ankle to the center of the ground and the tape measure method of SEBT measures from the point where the toe touches the ground to the center of the SEBT. The SEBT was performed twice by each subject, separated by approximately seven days, using established methods on the affected lower extremity.12,13,16,69,70,72–74 Participants were given identical verbal instruction on how to perform the SEBT to ensure consistency in testing methods. The investigator also demonstrated how to perform test. As instructed, participants performed the test barefoot, with the foot positioned by aligning the heel at the intersection point of the eight lines. Participants were asked to maintain a single-leg stance on the test leg while reaching the opposite leg to touch as far as possible along each of the eight directions with the most distal part of their foot. The sequence of the eight directions was determined using a random number generator. To be successful, each attempt must have met the following criteria: 1) participants’ hands remained on their hips and balance maintained while reaches were completed; 2) the reach leg was not to be in contact with the floor for more than one second and 3) the heel of the stance leg remained in position in the center of the grid. If the participant was unable to complete the above requirements as determined by the investigator, the performance in that direction was discarded and the attempt was repeated. As described by prior methods,73,74 each participant was asked to perform six successful practice attempts in each test direction to minimize the influence of the learning effect. Participants were then asked to perform three test trials in each direction, with each trial being separated by five seconds of rest.75 One minute of recovery was given between each reach direction and when switching legs.69 Before analysis the reaching distance on the anterior, posterior, lateral, anterolateral, posterolateral directions of the Star Performer™ was calibrated. The figures and functions of how calibration was done are shown in Appendix A.
Data Analysis
The average reach distances (normalized by leg length) from three successful trails in each direction using both Star Performer™ and tape measure methods were used for analysis. Reaching distances were normalized to leg length by calculating (Reaching Distance / Leg Length) × 100.8,9 A two-way mixed model was used to generate intra-class correlation coefficients (ICC 3,1) of consistency. Interpretation of ICC value was made according to the scale described by Koo et al.76 (i.e., poor reliability 0–0.50; moderate reliability 0.50-0.75; good reliability 0.75-0.9 and excellent reliability 0.9-1). The SEM values were calculated as follows: SEM = SDdiff√(1-ICC) with SDdiff representing the standard deviation of mean difference between two measurements.77,78[ref] The minimal detectable change at the 95% confidence level (MDC95) were calculated as follows: MDC = z-score (95% CI) × SEM × √2.79 The Pearson correlation was utilized between with normalized reaching distances of Star Performer™ and tape measure method during the first visit. The Pearson correlation coefficient (r) was interpreted as indicating weak, moderate, or strong relationships at values of 0.10, 0.30, and 0.50, respectively.80
RESULTS
Demographic information and the average reach distances (normalized by leg length), along with the range (minimum to maximum) measured by the Star Performer™ during the first visit is presented in Table 1. The average reach distances measured by the tape measure method and the Star Performer™ during the first and second visits are presented in the Appendix. Test-retest reliability of normalized distance was good to excellent for each direction of Star Performer™ (ICC3,1= 0.85-0.93) and tape measure (ICC3,1= 0.85-0.93). The results with ICC and MDC95 for normalized distance are shown in Table 2. The correlation between the normalized distance measured by Star Performer™ and tape measure was strong (r= 0.90-0.94), as presented in Table 3.
ICC: Intra-class correlation coefficients; MDC: Minimal Detectable Change; SEM: Standard Error of Mean
DISCUSSION
The primary findings of this study provided evidence for good to excellent test-retest reliability and concurrent validity of the Star Performer™ (normalized by leg length) compared to traditional SEBT measurements methods in individuals with lower extremity injuries in prior six months. The Star Performer™ exhibited smaller MDC95 values of normalized distance, ranging from (2.56-5.37%), compared with the traditional SEBT tape measure method (4.34-5.86%) over a one-week period of time. The results of this study support the use of Star Performer™ as a precise outcome instrument to assess SEBT performance in individuals with lower extremity injuries. Using its computerized device and software, the Star Performer™ addresses the identified inefficiencies of the SEBT and has potential for broader clinical use.
This study found good to excellent test-retest reliability of both Star Performer™ and tape measure method for the SEBT. The ICC values for normalized distance of the Star Performer™ ranged from 0.85-0.93, aligning closely with the tape measure method which ranged from 0.85-0.93 in the current study. Both normalized distance of ICC values from the Star Performer™ and the tape measure method found in this current study were similar with previous studies (Table 4).10,13–16,72 Pierobon et al15 reported ICC values of test-retest reliability from 0.72-0.93 in all eight directions in patients with lateral ankle sprain over a 24-72 hour interval. Five studies all investigated the test-retest reliability ranging from 30 seconds to one week on three directions of SEBT and found ICC values ranging from 0.89-0.99 on anterior direction, from 0.93-0.99 on posteromedial and from 0.51-0.96 on posterolateral direction for those with greater trochanteric pain, ACL injury, chronic ankle sprain, and general lower extremity injuries, as well as a healthy population.10,13,14,16,72 Variation in reliability may be attributed to factors such specific diagnosis, retest interval, and test protocol variation including instruction of leg position, number of practice trials, and rest time.
In the current study, the MDC95 values of normalized distance for the Star Performer™ ranged from 2.56-5.37% and the tape measure method ranged from 4.34-5.86%. The normalized distance for Star Performer™ demonstrated smaller MDC95 values across seven of eight directions compared to the tape measure method. This indicates that the Star Performer™ has reduced measurement error in SEBT over a one-week period compared to the traditional tape measure method. The MDC value offers clinicians the smallest change score that can differentiate between actual clinical changes and variations that might arise from random measurement variability. Visual assessments are inherently prone to human biases and errors. Rapid reaching movements can be challenging for clinicians to accurately observe and measure, leading to potential discrepancies with the tape measure method. Variability in observation positions across the eight directions also causes biases, as maintaining a consistent observation point is impractical.
Comparatively, previous studies have reported varying MDC values of normalized distance in SEBT (Table 5).13–16 Pierobon et al.15 determined MDC95 values of normalized distance in SEBT spanning 8.56-13.36% across all eight directions for lateral ankle sprains assessed between a 24–72-hour interval. Three other studies investigated the anterior, posteromedial, and posterolateral directions.13,14,16 Ferrer-Peña et al.14 reported MDC90 values of normalized distance in SEBT between 2.8-10.4% for greater trochanteric pain syndrome assessed between trials, while Shi et al.16 found MDC90 values of normalized distance in SEBT ranging from 4.5-47.3% for chronic ankle sprains over a one-week interval. Dobija et al.13 indicated MDC95 values of normalized distance in SEBT between 5.92-8.36% for ACL injuries with a 30-second interval between assessments. Previous studies focused on specific diagnoses and examined three of eight directions on SEBT, differing from the current study, making direct comparisons challenging.13,14,16 Variation in MDC values can be attributed to factors such as the specific diagnosis, test protocol, interval between tests, and the chosen cutoff for defining MDC.
The normalized distance of Star Performer™ exhibited a strong correlation (r=0.91-0.94) with the tape measure method across all eight directions of the SEBT. Any discrepancy may be a result from the differences measurement techniques. The Star Performer™ calculates the distance from the lateral ankle to the center of the ground, while the tape measure method measures from the point where the toe touches the ground to the center of the SEBT. This kind of measurement technique difference introduces an error attributable to the subject’s foot size. Although SEBT protocol recommends normalizing the subject’s leg length, from the anterior superior iliac spine to the medial malleolus’s most distal portion, this approach doesn’t account for foot size. Consequently, the Star Performer™ may offer greater accuracy as it excludes the foot during reach distance calculations, ensuring consistent reach endpoints across subjects.
The Star Performer™ not only offers a more precise assessment compared to the traditional SEBT but also enhances the efficiency of data collection and provides real-time interpretation. With the tape measure method, clinicians must use a hands-and-knees position to record each reach distance. Throughout the eight directions of the test, the clinician must change positions multiple times to record the patient’s outcome, making the process cumbersome. The Star Performer™, with its ability to automatically record and output data, effectively addresses this problem. The Star Performer™ requires less time compared to the tape measure method when testing the same subject across eight directions. Furthermore, the immediate output from the Star Performer™ aids clinicians in real-time interpretation. The radial plot of the Star Performer™ provides clinicians with a direct means to contrast the SEBT performance of the affected side against the unaffected side. Additionally, the reach distance graph acts as a valuable visual feedback tool for patients during SEBT training. Beyond its precision, the Star Performer™ stands out as a more efficient and user-friendly tool compared to the traditional tape measure method in SEBT.
LIMITATIONS
This study has limitations. It included only young and active participants with diverse lower extremity injuries, potentially limiting the findings to this specific demographic. Additionally, the test-re-test reliability outcomes are constrained to a one-week timeframe, making them unsuitable for long-term clinical follow-up.
CONCLUSION
This study introduces the Star Performer™, a novel computerized device and software for evaluating the SEBT in patients with lower extremity injuries. The findings demonstrate good to excellent test-retest reliability and strong concurrent validity when compared to the traditional tape measure method used for data collection in the SEBT. The Star Performer™ offers a more convenient, precise, and efficient assessment method for evaluating patients with lower extremity injuries than previous SEBT methodologies.
The authors certify that they have no affiliations with or financial involvement in any organization or entity with a direct financial interest in the subject matter or materials discussed in the article.