
INTRODUCTION
Running is one of the most popular sports practiced worldwide. However, there continues to be a high incidence and prevalence of running-related injuries reported in the literature. On a yearly basis 50%-90% of long distance runners experience a running-related injury.1–5 The need to better understand the biomechanics of running and how this knowledge may inform potential mechanisms of running-related injury is critical to improve the health and well-being of runners.
Evidence has described a significant relationship between running cadence and the risk of injury. A lower cadence has been linked with a higher risk of developing running-related injuries.6,7 Recent research findings show that with a lower cadence, running athletes experience an increase in ground reaction forces (GRFs) and with a higher cadence, a decrease in GRFs.8–10 Kinetic factors such as peak braking force and higher loading rates may increase running-related injury risk.11–15 What is not yet clear in the literature is the relationship between running speed, cadence, and ground reaction forces in experienced runners.
Schulze et al16 demonstrated that running spatiotemporal variables such as stride length, cadence, and step time are related to running speed in healthy recreational runners.6 In that study, recreational runners were asked to run at speeds ranging from 2.8 m/s to 6.7 m/s for 30s at each speed. Runners could opt out at any speed if they felt they could not run at that speed. The inclusion criteria only required that a person be able to run continuously for 15 minutes. Malisoux et al17 presented a dataset of reference values for spatiotemporal and ground reaction force variables in healthy runners. Their study had 860 recreational runners as participants and each runner ran at their preferred speed only. There was no amount of running experience included as an inclusion criterion. No study to date has used a sample of experienced runners to examine the effect of changing speed on both cadence and ground reaction forces. The purpose of this study was to examine the immediate effect of running speed on running cadence and ground reaction forces in a sample of experienced runners. The experimental hypothesis was that an increase in speed would be associated with an increase in cadence and an increase in GRFs. It is integral to understand the relationship between speed, cadence, and GRFs during running to better understand injury risk for the runner.
METHODS
This cross-sectional study was approved by the Regis University Institutional Review Board. Participants were recruited through flyers, emails, and word of mouth. All potential participants were informed of the running speeds encountered in this study and the time commitment. At the time of the data collection session, the participants could ask any questions regarding the research protocol and then, if they agreed to participate, they were asked to sign a consent form as witnessed by a member of the research team.
The inclusion criteria for this study included: 18-50 years old, running at least 15 miles per week for one year preceding study involvement, experience running on a treadmill, willing to run for short intervals for speeds ranging from 10 min/mile to 7 min/mile, no history of congenital or traumatic deformity or previous surgery that resulted in altered lower extremity bony alignment, and no acute injury or illness prior to participation in the study that prevented participants from running at least three consecutive days in the previous three months. Participants were excluded from participating if they did not meet all the inclusion criteria described.
Following their consent, runners completed a web-based survey regarding their running training and running-related injury history. Height, weight, and vitals (blood pressure and heart rate) were measured and recorded. All runners’ vital signs had to be within the allowable ranges for exercise to participate. These ranges are defined by the American College of Sports Medicine as resting heart rate < 120 beats / min, resting systolic blood pressure < 180 mmHg, and resting diastolic blood pressure < 100 mmHg. Each participant was asked to verbally identify their preferred running speed for a typical training run and then were gradually brought to that speed on a fully instrumented treadmill (Bertec Corporation, Columbus, OH). Runners wore their own running shoes and completed six minutes of acclimatization to the treadmill. During the final 30s of the acclimatization run, force plate data were collected at 1200 Hz. Cadence was also counted by one of the researchers. They did so by counting the number of steps in 30 s and multiplying by two.
Once the participant had completed six minutes on the treadmill and indicated they were acclimated to it, the treadmill was slowed to a stop and the research procedure was reviewed. Participants were given the opportunity to stretch and hydrate as they wished. The subject then returned to the treadmill and ran at seven standardized and predetermined speeds in the following order: 2.68m/s (10 min/mile), 2.82m/s (9.5 min/mile), 2.98m/s (9.0 min/mile), 3.16m/s (8.5 min/mile), 3.35m/s (8.0 min/mile), 3.58m/s (7.5 min/mile), 3.83m/s (7.0 min/mile). The sequence of speeds was not random but went from slowest speed to fastest speed. Participants ran for 90 seconds at each speed, and during the final 30 seconds of each running bout, GRFs were collected at 1200 Hz. Temporospatial variables of step time, stance time, and cadence were collected using the embedded force plate. Cadence was also counted during the last 30 sec of each running bout by the same member of the research team. Following data collection at each running bout, the participants were provided a walking cool-down time of 2 minutes. The participants were advised that they could request additional recovery time between running bouts if needed and could self-select to stop the treadmill at any point in the data collection. During each step of the protocol, the runner was asked their rate of exertion on the Borg Rating of Perceived Exertion scale (6-20).18If the rating was greater than or equal to 18, the data collection would be terminated, however no participants exceeded this safety threshold.
The ground reaction force data were filtered using a 4th order, zero lag low pass Butterworth filter with a cutoff frequency of 20 Hz, and footstrike and toe-off events were identified using a 40 N threshold on the vertical ground reaction forces. Measured variables included vertical impact peak, vertical average loading rate, vertical instantaneous loading rate, overall peak vertical force, peak braking force, and braking impulse. These kinetic variables were selected based on studies that have identified these variables as possible risk factors for running-related injuries.13,15 The vertical impact peak is the initial peak of the vertical ground reaction force that typically occurs within the first 50 ms of stance.19 However, the vertical impact peak is not always discernable, and it is important to ensure consistent vertical impact peak estimations in ground reaction force cycles with and without a clear impact peak as vertical average loading rate calculations rely on vertical impact peak timing. Consequently, vertical impact peak was calculated by differentiating the vertical ground reaction force signal with respect to time, then doubling the time of the first peak of this differentiated signal.20 Vertical average loading rate was calculated as the change in vertical ground reaction force divided by the change in time between 20%-80% of the vertical impact peak timing. Vertical instantaneous loading rate was the maximum change in vertical ground reaction force divided by time for two consecutive data points and was equivalent to the first peak of the differentiated vertical ground reaction force signal. Overall peak vertical force was the maximum vertical ground reaction force value during stance, braking peak was the minimum anteroposterior ground reaction force value during stance, and braking impulse was the time integral of the posterior (braking) force period.13,15
Descriptive statistics were calculated for cadence and all ground reaction forces for all runners. In addition to descriptive statistics, general linear modeling was used to compare the effect of speed (eight conditions) on cadence and each of the ground reaction forces as described. All statistical analyses were performed using SPSS Statistics, Version 26 (IBM Corporation, Armonk, New York 10504). An alpha level of .05 was established for all tests of significance with Bonferroni correction utilized as needed. Based on an estimated 20% change between conditions in our primary outcome variable (vertical average loading rate) with standard deviation equal to the estimated change, a sample size of 18 subjects was required to achieve a minimum power of 80% (α=0.05).
RESULTS
No significant differences existed between the right and left limb force data, therefore only the left limb data are reported. Cadence as counted by an examiner was significantly higher than cadence measured through the treadmill at each speed (p<0.001), so only the treadmill force plate cadence data were reported.
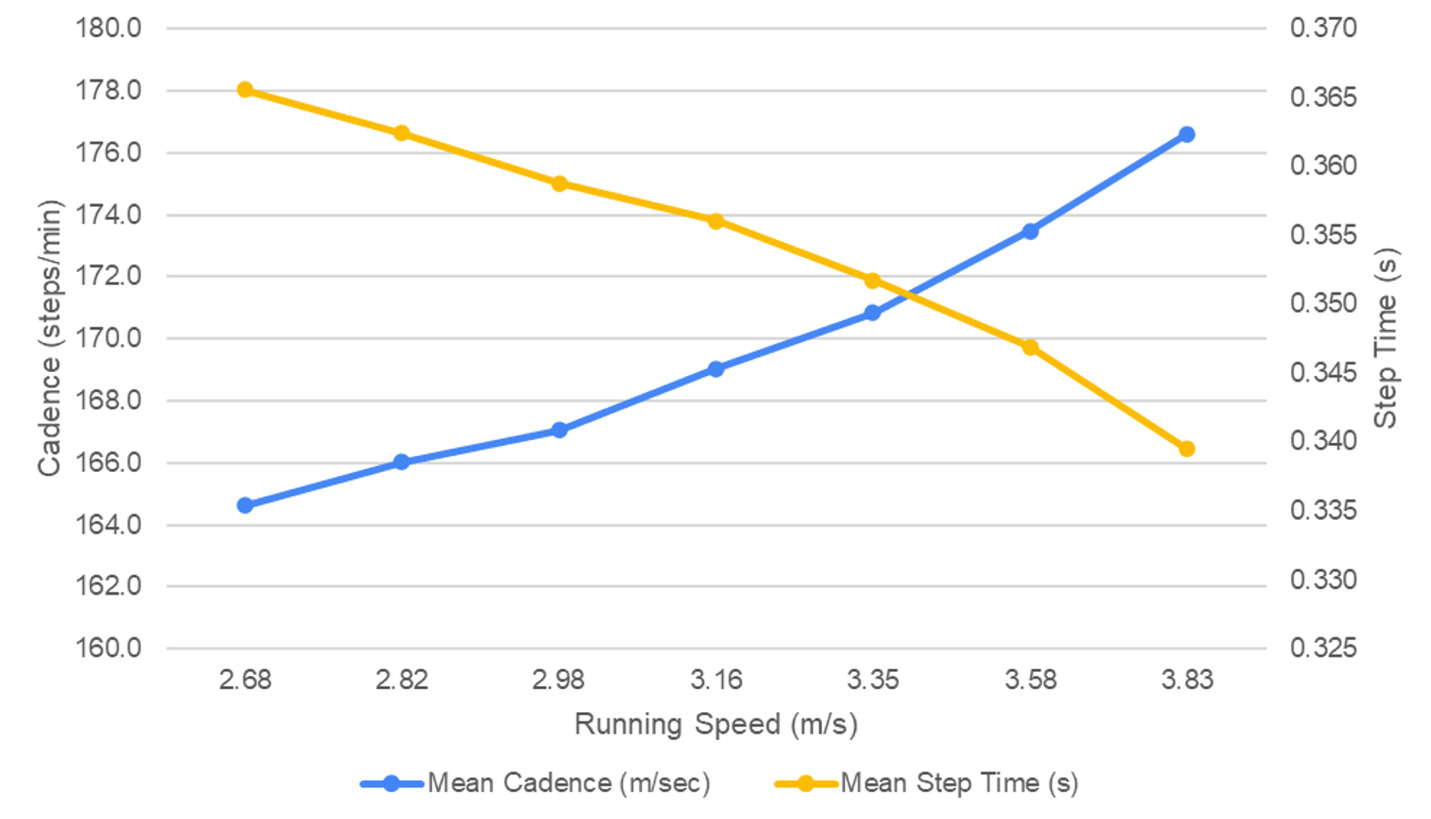
Mean cadence increased as running speed increased. From 2.68 m/s to 3.83 m/s, cadence increased from 169.2 steps/min to 177.9 steps/min. Most pairwise comparisons of cadence and speed were significant at p<.05 except as noted in Table 1. The authors feel it is important to note that while there were significant changes in cadence with increases in speed overall, there were a few individuals (n=8) that did not change their cadence greater than four steps/min from the lowest speed to the highest speed.
All force variables increased from the slowest speed to the highest speed Table 1. From 2.68 m/s to 3.83 m/s, overall peak vertical force increased from 2.325 BW to 2.541 BW, vertical impact peak increased from 1.510 BW to 1.875 BW, vertical average loading rate increased from 36.750 BW/sec to 47.965 BW/sec, peak braking force increased from -.280 BW to -.389 BW, and braking impulse increased from -.020 BW*sec to -.024 BW*sec. As was true with cadence, most pairwise comparisons of force variable and speed were significant at p<0.05 except as noted in Table 1.
As shown the Figure 1, as speed increased from 2.68m/s to 3.83m/s, step time decreased significantly (p<0.001). Stance time also significantly decreased from 0.28s to 0.24s and step time decreased from 0.37s to 0.34s over the eight speeds. Using step time and running speed, stride length was calculated. The mean stride length for all runners increased from 0.98m at 2.68 m/sec to 1.30 m/sec at 3.83 m/sec.
DISCUSSION
The purposes of this study were to investigate the relationship between running speed and both cadence and GRFs in experienced runners. The unique features of this study were that participants were all experienced runners and that all participants ran at all speeds used in the study. These features differentiate this study from that of Schulze et al16 and Malisoux et al.17 It was found that as running speed increased, both cadence and GRFs increased while stance and step time decreased. These results are in agreement with previous studies that have examined running speed, cadence, and GRFs.8,9,16,17,21,22
While running-related injuries are multifactorial, evidence has shown that there is a significant relationship between running cadence and injury risk in runners. Previous studies have related a lower cadence with a higher risk of running-related injuries.6,7,9 A lower cadence has also been associated with higher peak braking force and loading rate.12–15 Evidence has supported that increasing cadence may reduce the GRFs of running, whereas decreased cadence increases these factors.8–10 These findings fill a gap in the literature by providing evidence of the relationship between speed, cadence, and GRFs in runners. As experienced runners increase their speed, cadence increases but also all GRFs increase. These findings suggest that while there is an increase in cadence and decrease in step time at higher running speeds, the increase in GRFs at higher speeds may significantly increase the risk of running-related injury in an experienced runner population.
In this study, a subset of eight runners did not increase their cadence greater than four steps/minute from the slowest to the fastest speeds. Although step length was not directly measured in this study, step length was estimated using speed (m/sec) and step time. Based on the stride length data from all runners, stride length increased from 2.68 m/s to 3.83 m/s. However, the subset of eight runners that had a four step/minute or less change in cadence from the slowest speed to the fastest speed showed a significantly greater increase in their stride length. No relationship was found in GRFs between this subset of runners and the rest of the runners. This lack of significant finding may have been due to a lack of power given the small sample size of runners who did not significantly alter their cadence. What is important about the finding of this subset of runners, is that not all runners respond to change in running speed with a concurrent substantial change in their running cadence.
These results are valuable to the running community because of the implications they hold for training modifications. Runners may consider these findings when assessing a change in training pace. An increase in running speed will naturally lead to an increase in cadence to match the pace change, however, GRFs will also increase with an increase in speed.
There are several limitations to this study including a gender imbalance of 19 male and 11 female participants. In this study, there were no significant differences found between male and female runners for cadence or ground reaction forces at the varying speeds. However, Malisoux et al17 found that women had a lower vertical impact peak and peak vertical ground reaction force than men. Schulze et al16 did not perform gender-specific analyses because more women dropped out as running speeds increased. The lack of significant finding in this study may be related to the sample size of the current study as compared to the Malisoux et al17study. Participants’ leg length or stride length was not directly measured to assess if changes in cadence were proportional to those spatial measures. Malisoux et al17 measured both leg length and step length of participants. They reported a positive correlation between step length and running speed (R2=0.88) but did not report on the leg length data. Schulze et al16 measured stride length and also reported a positive relationship between running speed and stride length. Schulze et al16 did not assess leg length in their participants. Another limitation was that shoe wear was not controlled in this study; runners wore their own preferred shoes. Potentially, differences in shoe style or wear could have affected the runners’ kinematics and ground reaction forces. Our decision to allow runners to wear their own shoes was to provide realistic and meaningful data.
CONCLUSION
The findings of the current study indicate that as running speed increased, cadence, stride length, and ground reaction forces all increased while step time decreased. These findings, consistent with other studies, may have application to the study of running-related injury risk in experienced runners.
Corresponding Author:
Mark F Reinking
Regis University School of Rehabilitative and Health Sciences
Denver CO 80221
Phone: 303-964-6471
Email: mreinking@regis.edu
Fax: None
Conflicts of Interest
The authors report no conflicts of interest