INTRODUCTION
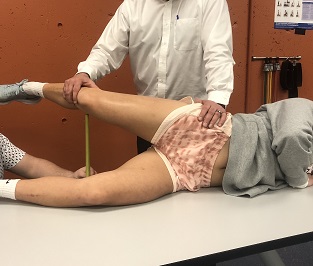
Ober’s test is a widely used flexibility assessment of the iliotibial band (ITB) and tensor fascia latae (TFL) in fields such as physical therapy and athletic training.1 Ilio-tibial band syndrome (ITBS) is thought to be an overuse injury typically brought on by repetitive lower-limb exercise such as running and cycling, and typically presents as lateral knee pain.2,3 Conservative treatments such as stretching are among the first line of treatment for ITBS, and patients often demonstrate limited hip adduction range of motion (ROM).4,5 Ober’s test is often used clinically to assess hip adduction ROM for ITBS patients.1 It is performed with an individual side lying on a table with their hips stacked, where their top leg is placed into a position of hip extension and then passively adducted to the table. A positive test is observed when the thigh remains abducted, whereas a negative test is observed when the thigh falls below the horizontal plane.6
Typically, clinicians use goniometers, digital inclinometers, or a visual assessment to determine whether a patient or athlete presents with insufficient hip adduction ROM during Ober’s test.7 A measuring tape may serve as an alternative means of evaluating Ober’s test, and has been used in clinical practice8 and research.9 The relatively simplistic nature of a measuring tape may lend itself to more precise and reproducible measurement, and it has demonstrated good reliability when evaluating thoracolumbar,10,11 cervical,10,12 and ankle dorsiflexion ROM,13 but its reliability has not been assessed for hip adduction ROM.
If an assessment cannot be evaluated reliably by an individual or group of clinicians, then the collected measurements are of little practical use.14 Given that a measuring tape is sometimes used to assess hip adduction ROM via Ober’s test in clinical8 and research9 settings, the purpose of this study is to assess the intra-rater and inter-rater reliability, along with the measurement precision of assessing hip adduction ROM via Ober’s test with measuring tape. Determining the reliability with which a practitioner can use measuring tape to evaluate Ober’s test along with more traditional methods can inform clinical practice. The hypothesis is that intra-rater and inter-rater reliability of measuring tape assessments will be good.
METHODS
An observational, intra-test and inter-test study with repeated measures was conducted to evaluate the reliability of measuring hip adduction ROM via Ober’s test using a measuring tape, a handheld goniometer, and a digital inclinometer. The project was approved by the university’s institutional review board (IRB # 6028). All participants gave written informed consent prior to participation.
Participants
Thirty-one healthy adults (mean age = 20.45 ± 2.65 years, 17 male, 14 female) (62 hips), aged 18 or older, agreed to participate in the study. Participants were excluded if they had a current lower limb or torso injury, or any condition that would make Ober’s test painful. A minimum sample of 25 participants and thus 50 hips were needed given the expected intraclass correlation coefficient of .9, a power of 80%, and an alpha level of .05.15 Assessing both of a participant’s joints relevant to the measure in question has been previously described in the literature.13,16
Recruitment
Students enrolled in collegiate health and fitness courses were recruited to participate in this investigation. After the objectives were described and the time commitment was clarified, potential participants were invited to schedule an appointment for a data collection session. Participants were screened for potential exclusion criteria in private and gave informed consent at the beginning of the scheduled session.
Data collection
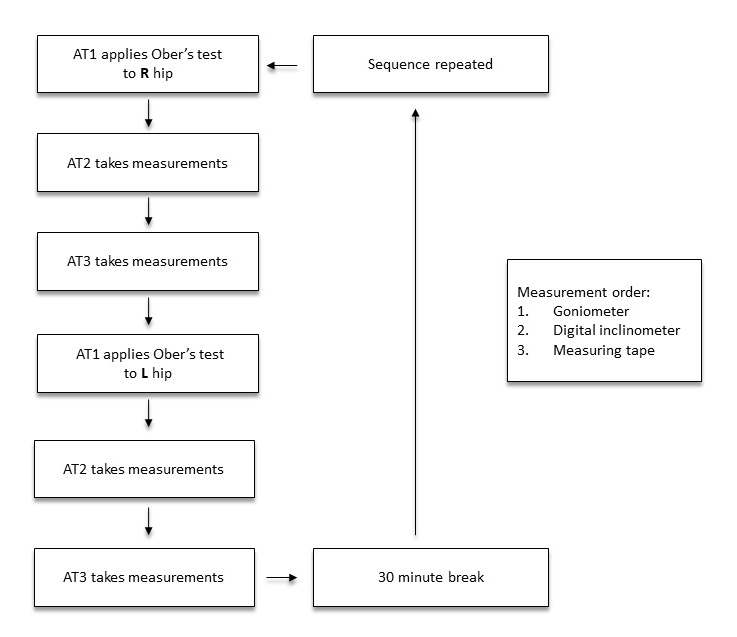
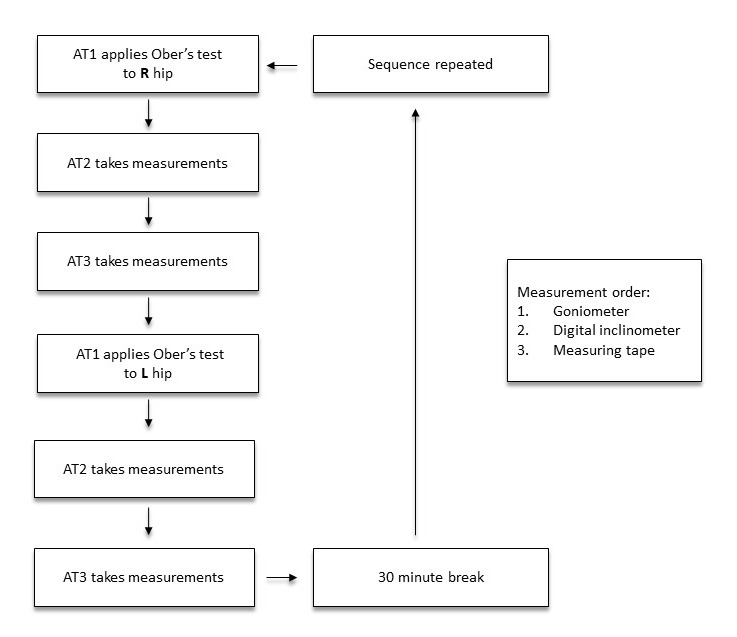
Data collection was conducted between October 1, 2023 and April 30, 2024. Each series of Ober’s test measurements were conducted individually, with two athletic trainers obtaining ROM measures for comparison, a third athletic trainer performing the Ober’s Test but not obtaining ROM measures, and a data scribe in the room at varying times with the participant. The evaluations took place in a private office, atop a treatment table. Each data collection session was comprised of six Ober’s test measurements: An Ober’s test was performed on each hip with a handheld goniometer, a digital inclinometer, and a measuring tape, with relevant landmarks obtained at the onset of each measurement.
Training for Raters
Prior to data collection, all raters participated in a focused training session that aimed to standardize the identification of relevant anatomical landmarks and specifics for placement of the assessment tools (described below). This preparation was designed to reduce inter-rater variability by reinforcing consistent methods of measurement.
Handheld Goniometer
A standard 360 degree plastic goniometer was used to measure the quantity of hip adduction ROM during an Ober’s testing position. The same goniometer was used for all participants. The licensed athletic trainer identified anatomical landmarks for the axis of rotation, moveable arm, and stationary arm via palpation. The axis of rotation was aligned with the ipsilateral anterior superior iliac spine, the moveable arm was aligned with the mid-point of the patella, and stationary arm was aligned with the contralateral anterior superior iliac spine. The measurement was assessed and reported directly to the scribe by the licensed athletic trainer.
Digital Inclinometer
A Baseline Digital Inclinometer (Fabrication Enterprises, Inc., Elmsford, NY, USA) was used to measure the quantity of hip adduction ROM in an Ober’s testing position. Prior to each data collection session, an adequate battery level was confirmed and a calibration check was performed according to the manufacturer’s guidelines. Before each measurement, the device was zeroed against the flat surface of the examination table. The same digital inclinometer was used for all participants. After locating and palpating the lateral epicondyle and the greater trochanter of the femur, and assessing the contours of the lateral thigh, the raters positioned the digital inclinometer on the lateral thigh proximal to the distal muscle belly of the vastus lateralis. The specific position varied between participants to ensure that the inclinometer laid flat against the lateral thigh, minimizing potential error due to contour differences. Each rater was responsible for ensuring uniform contact and alignment of the inclinometer in a way that was replicable for every measurement. The measurement was assessed and reported directly to the scribe by the licensed athletic trainer.
Measuring tape
A standard retractable clinical measuring tape was used to measure the distance between the medial joint line of the knee and the table. The licensed athletic trainer identified the medial joint line of the knee as the mid-point of the medial collateral ligament, using the medial epicondyle of the femur and the medial tibial condyle as anatomical points of reference. The zero point of the measuring tape was placed on the medial joint line as described. The measurement was taken at the perpendicular point of the top surface of the table on the measuring tape.

Blinding and Privacy Measures
To prevent any form of bias or influence between the raters, a blinding procedure was employed; (1) Raters were blinded to each other’s results. No rater had access to or was informed about the measurements obtained during data collection. (2) Measurements were taken in a private examination room, with only one rater present at any given time. This controlled setting minimized distractions and further ensured that raters could not inadvertently observe or communicate results. (3) The research team also used a scribe to record throughout the data collection to ensure raters could not see the other rater’s results.
Procedures
Details of the experimental design are provided in Figure 2. Three licensed athletic trainers were present for each data collection session: Athletic trainer one (AT1) manually guided each participant through each Ober’s test. Athletic trainers two (AT2) and three (AT3) took measurements during each test. Ober’s test is a clinical examination technique used to assess the extensibility of the iliotibial band from its proximal origin at the tensor fascia latae to its distal insertion in to the anterolateral tibia. Participants were first positioned side lying on the left hip, with the right leg on top in order for that hip to be assessed first, the bottom leg flexed for stability, and the hips stacked perpendicularly to the table. Positioned behind the participant, AT1 stabilized the pelvis proximally and supported the lower leg distally. Next, AT1 passively pulled the leg into abduction and extension, before slowly releasing the lower limb toward the table with the top knee flexed to approximately 10 degrees, which has been reported to limit hip adduction ROM measurements compared to an extended knee.17 Next, AT1 identified the point of tissue restriction, indicated by restricted adduction of the thigh, and held the limb at that height and angle for the duration of the measurements that followed, approximately four minutes per leg, per measurement session. During that time, AT2 conducted hip adduction ROM assessments for the right hip using a handheld goniometer, then a digital inclinometer, then a measuring tape, for one trial each. Visual aids were not used in this investigation, in order to maintain the independence of each assessment. While AT2 conducted their assessments, AT3 was outside the room beyond listening distance, in order to keep AT2 and AT3 blinded to each other’s assessments. While AT1 kept the participant in an Ober’s test position, AT2 left the room, and AT3 entered. Next, AT3 conducted hip adduction ROM assessments using each of the three instruments, in the same order. Following this, AT1 instructed the participant to turn over and lay on their right hip, and manually repeated the same Ober’s test procedure on the left leg and hip. During this transition, AT3 left the room, and AT2 re-entered. Next, AT2 conducted a hip adduction ROM assessment on the left hip using each of the three instruments, in the same order. While AT1 again kept the participant in an Ober’s test position, AT2 left the room, while AT3 entered. Next, AT3 conducted the same assessments on the same hip in the same order as AT2. At the conclusion of the final measurement by AT3, participants were asked to leave the assessment area and return after 30 minutes for an identical second round of assessments, and were asked not to exercise during that time. A 30 minute break period was used to minimize the influence of the stretch participants received during Ober’s test in session one on flexibility assessments during session two, which was deemed sufficient based on previous investigations into the time course of acute flexibility increases following a stretching protocol.18
Statistical Analysis
The significance level was set at p < 0.05 with a confidence interval (CI) of 95%. A Kolmogorov-Smirnov test was conducted to examine quantitative data distribution (parametric versus non-parametric). Box plots and histograms were screened for homoscedasticity.19 Differences between the first-second measurement sessions and between raters were evaluated for each hip using paired samples t-tests in instances of parametric or normal data distribution, or a Wilcoxon matched-pairs signed rank test in instances of non-parametric or non-normal data distribution. The percentage change was calculated as ((Mean 1 – Mean 2)/Mean 1) x 100). These analyses were conducted using GraphPad Prism 10.2.3 (GraphPad Software San Diego, CA, USA).
Reliability was calculated using intraclass correlation coefficients (ICCs) via a two-way mixed model to assess intra-rater reliability, using the following equation: (MSR−MSE)/MSR+(k−1)MSE+kn(MSC−MSE).20 A two-way random model was used to establish inter-rater reliability, via the following equation: MSR−MSE(MSR).20 Qualification of correlation strength ascribed to the guide described by Portney & Watkins (2009): (ICC < 0.5 = poor, ICC 0.5 - 0.75 = moderate, ICC > .75 = good).21 Where a Pearson/Spearman correlation measures the linear relationship between two distinct variables, ICC measures agreement or reliability between multiple measurements of the same variable, hence its suitability for establishing intra-rater and inter-rater reliability in a study of clinical measurements.20 Standard error of measurement was assessed to determine precision as (SD x √(1−ICC)), where smaller SEM values may suggest greater agreement between measures. Standard error of measurement quantifies the amount of error present in a measure due to the imprecision of the measurement tool. A clinical assessment tool must have reliably adequate precision in order to be useful. Minimum detectable change was calculated to provide a threshold at which a measurement is likely due to meaningful change versus measurement variability, calculated as: SEM x 1.96 x √2. The 95% limits of agreement (LOA) were calculated, which demonstrates the range of measurement error between the two raters.19 These analyses were conducted using Microsoft Excel 2016 MSO 16.0.4266.1001 (Microsoft Corporation, Redmond, WA, USA)
RESULTS
Descriptive Statistics
The Kolmogorov-Smirnov test revealed that the measuring tape data were normally distributed (p = 0.10), while the handheld goniometer (p = 0.05) and digital inclinometer data (p = 0.00) were not. Box plots and histograms confirmed homoscedasticity across all measurements. Aggregated Ober’s test measurements are provided in Table 1.
Comparison Between Measurement Sessions
Descriptive statistics for trials one and two can be found in Table 2. Given the parametric measuring tape data, paired samples t-test were conducted to assess differences between the first and second measurement sessions for each leg. No significant differences were observed for measuring tape in the right (p = 0.05) or left (p = 0.37) leg.
Given the non-parametric handheld goniometer and digital inclinometer data, a Wilcoxon matched-pairs signed rank test was conducted to assess differences between the first and second measurement sessions. For handheld goniometer, observed values were greater during measurement one compared to measurement two for the left leg (1.31 ± 7.34° vs. -.38 ± 8.08°, p = 0.02) No significant differences were observed for handheld goniometer for the right leg (p = 0.12), or digital inclinometer on the right (p = 0.83) or left (p = 0.74) leg.
Comparison Between Raters
Descriptive statistics for AT2 and AT3 can be found in Table 3. Given the parametric measuring tape data, paired samples t-tests were conducted to assess differences between AT2 and AT3 for each leg. For measurement tape on the right leg, observed values were greater when assessed by AT3 compared to AT2 (20.97 ± 7.42 cm vs. 20.00 ± 6.53 cm, p = 0.01). For the left leg, observed values were also greater when assessed by AT3 compared to AT2 (21.65 ± 5.90 cm vs. 19.35 ± 5.90 cm, p = 0.00)
Given the non-parametric handheld goniometer and digital inclinometer data, Wilcoxon matched-pairs signed rank tests were conducted to assess differences between the two raters for each assessment. No significant differences were observed for the handheld goniometer on the right (p = 0.15) or left leg (p = 0.05), or digital inclinometer on the right (p = 0.40) or left leg (p = 0.27)
Intra-rater and Inter-rater Reliability
Calculated intraclass correlation (ICC) values for intra-rater reliability from measurement 1 to measurement 2 can be found in Table 4. Intra-rater reliability values ranged from ‘moderate’ to ‘good’, with ‘moderate’ intra-rater reliability observed for the handheld goniometer and digital inclinometer on the right leg, and ‘good’ intra-rater reliability observed for the measuring tape on both legs, and the handheld goniometer and digital inclinometer on the left leg.
Calculated ICC values for inter-rater reliability between AT1 and AT2 can be found in Table 5. Inter-rater reliability values were ‘good’ for each measure, on each leg.
Precision and Measurement Error, and Limits of Agreement
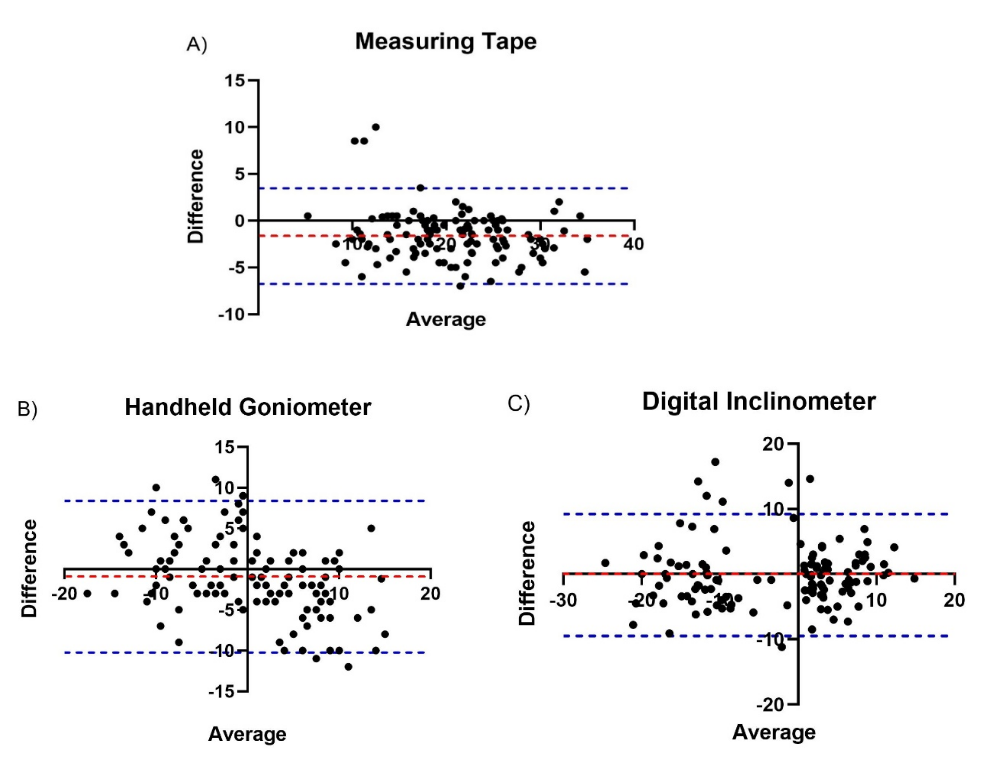
Precision and measurement error statistics can be found in Tables 4 and 5. Bland-Altman plots and the associated bias and confidence intervals can be found in Figure 3. For the the measuring tape, the 95% limits of agreement (LOA) were -7.74 cm to 3.97 cm. For handheld goniometer, the 95% limits of agreement (LOA) were -10.23° to 8.34°. For digital inclinometer the 95% limits of agreement (LOA) were -10.45° to 11.49°.

DISCUSSION
The primary aim of this investigation was to evaluate the reliability of a measuring tape as a means of assessing hip adduction ROM via Ober’s test. To assess consistency between raters, or inter-rater reliability, an athletic trainer measured hip adduction ROM using a handheld goniometer, a digital inclinometer, and a measuring tape, followed by another athletic trainer immediately repeating those measurements. To assess consistency within raters, or intra-rater reliability, those same measurements were repeated 30 minutes later, and each athletic trainer’s first series of measurements was compared to their second. The findings of the present investigation indicate that a measuring tape is a reliable tool for evaluating hip adduction ROM via Ober’s test.
A measuring tape demonstrated good inter-rater reliability, with an observed intraclass correlation (ICC) of .90/.88 (R/L, right leg and left leg, respectively). The handheld goniometer and digital inclinometer also demonstrated good inter-rater reliability, with observed ICC values of .80/.83, and .87/.90 (R/L). These findings are consistent with those previously reported in the literature, where reported ICC values for goniometer and inclinometer Ober’s test assessments between raters have ranged from .73-.91.22,23 It appears that practitioners and researchers can reliably use a measuring tape as an evaluation tool to assess hip adduction ROM, and consistent ratings can be anticipated between multiple trained evaluators.
In addition to good inter-rater reliability, the measuring tape demonstrated good intra-rater reliability, with observed ICC values of .76/.83 (R/L). Handheld goniometer and digital inclinometer demonstrated moderate to good intra-rater reliability, with observed ICC values of .65/.77, and .73/.81 (R/L), respectively. These values suggest lower intra-rater reliability for assessing Ober’s test with these tools in the present investigation compared to previous investigations, where a range of .94-.97 has been reported.22,23 Methodological differences between those studies and the present investigation may explain the apparent discrepancy. While also evaluating the intra-rater reliability of Ober’s test assessments, Kim et al.22 and Melchione & Sullivan23 each had a given rater record two measurements in immediate succession. Alternatively, there was a 30 minute gap between each like measurement for a given rater in the present investigation, and participants were placed into a new Ober’s test for the second session by AT1, likely resulting in greater hip adduction ROM variability on an intra-rater basis. This discrepancy was not observed on an inter-rater basis, likely owing to AT2 and AT3 taking their comparable assessments a few minutes apart, with each participant held in the same Ober’s test position while raters were changing positions. Methodological differences notwithstanding, the current findings appear to support the continued use of handheld goniometers or digital inclinometers for reliable assessment of the Ober’s test. Additionally, these findings appear to support the use of a measuring tape as a reliable assessment. Consistent measurements can be anticipated within multiple trials for a trained evaluator, with moderate to good reliability, although the degree of precision may depend in part on the duration between assessments.
A strength of this investigation was the credentials and experience of the raters. Each athletic trainer was licensed and had at least 12 years of clinical experience, thus, the results of the investigation can be generalized to other experienced professionals. Another strength of this investigation was the blinding of the raters; neither athletic trainer was aware of the values the other had reported. Further, given the design, it is unlikely either athletic trainer was influenced by their own previous measurements, given the amount of time that has passed, and the number of other measurements they had taken on both the participant in question, and others during the interim. A limitation of this study was the use of healthy participants; pertinent injuries or pain, especially in the ITB, may influence measurement reliability, and the generalizability of these findings to a clinical population. Another limitation of this study is the focus on hip adduction ROM and Ober’s test; It is unclear whether a measuring tape can be used to reliably assess flexibility in all logistically feasible muscle groups. Another limitation is that the order of measurements was not randomized; it is possible that altering the sequence of measurements, the leg assessed, or the order in which the respective raters conducted their assessments may have influenced the results. Another limitation of the study is the compressed timeline of the assessments; the entirety of each participant’s measurements were collected in an approximate 30-40 minute time frame. Measurements taken over multiple days may better reflect the manner in which changes in flexibility are often assessed in a therapeutic setting. Another limitation is that one AT held the participants’ leg in the Ober’s test position for approximately four minutes per side, which was a function of the study design, but differs from standard clinical practice; A shorter Ober’s test may influence the consistency of hip adduction ROM assessments.
Conclusions
A measuring tape is inexpensive, simple to use, and widely available. The results of this investigation indicate that it is a reliable tool for evaluating hip adduction ROM via Ober’s test. Thus, it can provide an alternative to traditional tools such as the handheld goniometer and digital inclinometer, offering simplicity without compromising precision. Measuring the distance from the knee to the table likely introduces fewer opportunities for inconsistency compared to traditional assessment tools, and could maintain or even improve reliability of Ober’s test measurements conducted by practitioners, potentially more so for the less experienced. Additionally, this method could allow for assessments to be conducted in settings with limited resources. Future studies should investigate whether a measuring tape can be used to reliably assess flexibility of other joints, and the reliability of a measuring tape as an Ober’s Test assessment tool in clinical populations, such as those with with hip mobility restrictions or ITB pain. Additionally, future studies should examine practical considerations for the use of a measuring tape versus other methods, such as cost and time efficiency.
Acknowledgments
These results were presented in an oral presentation at the New England American College of Sports Medicine Fall Meeting in November 2023
Conflict of interest statement
The authors declare no conflicts of interest.