
INTRODUCTION
Playing baseball at the highest levels is a goal of many young baseball players.1 Only 1% of all individuals that play organized baseball participate at the collegiate or professional level.2
The goal of playing baseball professionally has encouraged athletes to alter training and participation.3 Advanced training and participation including playing baseball on multiple teams per season, pitching in multiple games during a single tournament, exceeding pitch smart guidelines (Major League Baseball [MLB] published guidelines for pitch count limits and required rest between pitching competitions by age group), early participation in showcases, specializing in sport and position, and taking part in baseball specific training have been theorized to enhance performance but may also impact arm injury risk.3–10
Professional pitchers demonstrate an average fastball velocity of approximately 91-93 miles per hour (mph).6 Fastball pitch velocity is a metric used to define effective performance and evaluate pitchers.3 Based on the perceived importance of velocity as a metric related to pitching success, development of velocity is a focus for youth through adult pitchers.11 Biomechanical studies have demonstrated that higher velocity increases the load on the elbow and possibly the injury risk to the upper extremity of pitchers.12
Ball velocity has been associated with many intrinsic and extrinsic factors.13 In pitchers some of these factors can be modified including throwing mechanics, kinetic chain strength, and endurance.13,14 To increase performance, athletes participate in strength and conditioning programs.14 Overhead athletes have demonstrated increased throwing velocity in many sports after general and sport specific strength training.13 Training techniques have continued to evolve by incorporating sport specific movement patterns and tasks.15,16
Over the past two decades, weighted-ball programs have gained popularity in baseball.11 The training has varied including use of light or heavy weight balls for specific training progressions, warm up or cool down, or as an adjunct to training programs.8,11,17,18 These training programs have been equivocally associated with improved velocity. Reinold et al. associated weighted ball training with alteration in shoulder range of motion (ROM), strength, and possible increased injury risk.8,9,17,18 Little is known about the injury risk associated with weighted ball use in the youth through collegiate pitchers, less is known about the injury risk to professional baseball pitchers when using weighted ball as an adjunct to their regular training program.6 The purpose of this study was to describe weighted ball training and injuries and compare injury rates between those professional pitchers using weighted ball training and those that did not use weighted ball training during the 2023 pre- and regular season.
METHODS
Study Design
This study was approved by the Prisma Institutional Review Board (Study Number 4915). The study was designed as a prospective cohort study conducted during the 2023 season on Minor League Baseball (MiLB) pitchers in one Major League Baseball (MLB) organization. The study, intended as a multi-year project used longitudinal sample size calculation based on an injury rate of 33%,19 with an R2 of 0.22,19 to perform a Cox Survival analysis. This is an interim safety analysis after one year of follow up. The Strengthening the Reporting of Observational Studies in Epidemiology for Sport Injury and Illness Surveillance (STROBE-SIIS) was used to inform study reporting.20 Professional pitchers participated in preseason testing (i.e., Spring training) prior to taking part in team sponsored baseball related activities. All data administrators were blinded to hand dominance.2 Pitchers underwent routine physical examination including previous injury history, and injury screening during preseason medical physicals. During routine physical examination per previously documented methods (inclusive of cervical, shoulder, and hip ROM, and hip strength measures)2,21–23 and musculoskeletal screening, pitchers were surveyed on their use of weighted baseball training (described below). Throughout spring training and the MiLB season, pitchers were monitored for athletic exposures and injuries.
Study Participants
Minor League Baseball pitchers, from one MLB organization, were included in this study. Inclusion criteria consisted of 1) currently participating in all baseball related training, practices, and competitions. Exclusion criteria consisted of 1) currently injured or not participating in all training, practices, or spring training competitions; 2) participating at MLB spring training; 3) signed a professional contract in the middle of the season; 4) sustained a traumatic injury, which involved collision with another athlete, the ground, or inanimate object during the season. Pitchers that were not currently participating in weighted ball training (WBT) were included in the non-weighted ball training (NWBT) group; however, they excluded from participating in the study if they had trained with weighted balls in any of the previous three years. The inclusion of WBT to a pitcher’s work out program was voluntary and an individual decision. Inclusion in the WBT group required the athlete attest to continuous and regular use of weighted ball training a minimum of two times per week.
Outcomes Assessment
Weighted Ball Training
Pitchers were surveyed in spring training on their history and use of weighted ball and their associated training habits. Pitchers were questioned if they used weighted ball training (yes/no). If answered yes, pitchers were furthered questioned on their specific training habits including use as a warmup strategy, performance training (i.e., increase velocity), and/or as a recovery strategy (i.e., post throw). As is conventional a range of ball weights in training programs and published studies were reported by this cohort of professional pitchers.
Athlete Exposure definition
An athlete-exposure (AE) was defined as one athlete participating in one practice or competition where a player was at risk of sustaining an injury.24 Baseball exposure was defined from the beginning of preseason (i.e. spring training) to the end of the MiLB season.25 Pitching appearance exposure was defined as a pitcher throwing at least one pitch within a game.19 Innings pitched exposure was defined as obtaining at least one out (i.e., 1/3 of an inning) within a game.19
Injury Definition
An injury was defined as an injury to a tendon, ligament, nerve, muscle, or bone that occurred during any baseball team sponsored activity or event,26 was followed by at least one day of missed practice or games, and received medical attention from a medical professional.2 If a player was unavailable to play for injury prevention reasons (i.e., has reached league or individually determined pitch or innings count limits), then their absence was not considered as an injury.25 Injuries were defined by the Orchard Sports Injury Classification system and injuries stratified by region: shoulder/clavicle, upper arm, elbow, forearm, core and lower extremity.27 All injuries and illness were recorded, and time loss was taken into account for overall exposure.28 Only injuries of non-traumatic origin were included as the outcome of interest for statistical analysis. Traumatic injuries and illness with associated time-loss were used to clarify participation. Injury severity was further classified by time loss of one to six days (TL1) from participation in practice of games, time loss of 7-27 days (T7-27), and time loss of 28+ days (T-28).28
Initial Injury
An initial injury was defined when it was the first injury, and until the pitcher had fully recovered, cleared by the sports medicine team to return to competition, and played for at least two weeks of competition.29
Outcomes of Interest
For the primary analysis, the outcome was sustaining an overuse injury during the season. The secondary analysis outcome was sustaining an arm (shoulder or elbow) or core injury during the season.
Further Variables Collected
Further variables collected were determined through clinical reasoning amongst the study team and a detailed review of the relevant literature. These variables included: pitching role (i.e., starter versus reliever),30 number of pitching appearances,31,32 innings pitched,33 and fastball pitching velocity.34–36
Statistical Analyses
Prior to data analyses, missing data were assessed for missing data prevalence, patterns of missingness, and mechanisms of missingness (Appendix 1). Missing data were low (<1%), with no discernable missing data pattern, a complete case analysis was performed. The study, intended as a multi-year project, documented a sample size of 357 pitchers to perform a Cox Survival analysis.
Epidemiological Calculations: All epidemiological information were calculated for the entire cohort (i.e., all pitchers) and stratified by weighted ball training. Overall injury rates (i.e., all injuries suffered throughout the season) were calculated for athlete exposures, pitching appearance exposures, and innings exposures, all reported per 1000 exposures. Overall injury prevalence was also calculated. Initial injury rates were calculated per 1000 athlete exposure days and initial injury prevalence was also determined. Injury rate and prevalence 95% confidence intervals were determined through 2000 bootstraps.37 Categorical data with a zero outcome were calculated through the Clopper-Pearson method.
All analyses were performed in R version 4.02 (R Core Team (2013). R: A language and environment for statistical computing, using the dplyr package for cleaning and coding, the survival package for survival analyses, and the survminer and ggplot2 packages for data visualization.
All statistical code can be obtained through the Open Science Framework link (https://osf.io/ha5qk/). Due to agreements with the MLB organization, no data, nor synthetic, data can be shared.
RESULTS
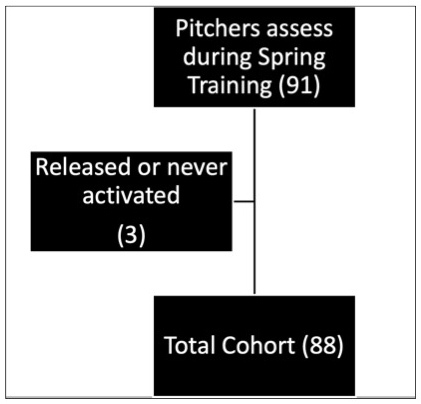
A total of 91 pitchers were assessed at the beginning of spring training. Excluding those that were released in spring training, and pitchers never activated from the injured list, 88 pitchers were included (Figure 1). Table 1 describes the demographics and clinical measures of the cohort and both groups of pitchers: pitchers who used (WBT) and did not use weighted balls in their training (NWBT).
Of the 88 sample pitchers, 52% reported using weighted ball training and 48% did not use weighted ball training. All pitchers that participated in weighted ball training reported use of a variety of sized overweight balls (range- 4 to 9 ounces in weight) but denied using underweight balls. Pitchers reported that the size/weight of the ball chosen was based on availability not training protocol. Pitchers that used weighted ball training appear similar to those that did not use weighted ball training when visualizing their demographics, workload, pitching velocity, and physical measures of ROM and strength (Table 1). Of pitchers that used weighted ball training (both in and off season), 21% reported using weighted balls for warm up, 2% for recovery, and 77% to impact performance through velocity training. The average number of exposure days for pitchers who used weighted ball training was 176.0 (41.2) days and pitchers that did not use weighted ball training of 187.0 (26.0) days. A total of 15,942 athlete exposure days were collected over the course of the MiLB season.
A total of 28 injuries were suffered by pitchers during the minor league baseball season. Of the 28 injuries reported (Upper extremity = 20; Trunk/Core = 8; Lower Extremity = 0), all were non-contact. Pitchers that used weighted ball training suffered eight more injuries at a 1.1 greater injury rate per 1,000 athlete exposure days, 7.8 greater injury rate per 1000 pitching appearance exposures, and 3.3 greater injury rate per 1000 innings pitched exposures compared to pitchers that did not use weighted ball training (Table 2). Pitchers that used weighted ball training demonstrated an arm injury rate of 11.8 arm injuries per 1000 pitching game exposures, pitchers who did not use weighted ball training demonstrated an arm injury rate of 7.5 arm injuries per 1000 pitching game exposures. Pitchers that used weighted ball training demonstrated a trunk injury rate of 5.9 trunk injuries per 1000 pitching game exposures, pitchers who did not use weighted ball training demonstrated a trunk injury rate of 2.1 trunk injuries per 1000 pitching game exposures. Additionally, the burden of injury (time-loss) in the pitchers that used weighted ball training were almost two times higher than in pitchers that did not use weighted balls in training (Table 2).
DISCUSSION
The most important finding of this study is that more than 50% of minor league pitchers demonstrated consistent use of weighted ball training. This preliminary study demonstrates some concerning trends regarding the frequency and burden of injury between groups. A total of 28 non-contact injuries were suffered by pitchers during the minor league baseball season. The pitchers that used WBT suffered eight more injuries in an average of 11 fewer exposures compared to pitchers that did not use WBT. Pitchers that used weighted ball training on average missed almost twice as many days of play as those that did not use weighted ball training. These trends are vital to the literature based on the hypothesized frequency of WBT, potential risks, and benefits of the velocity performance training at the various levels of baseball.13 The available studies have documented some benefits of training with weighted balls including increased velocity as a direct outcome of this training.7–9,13 Others studies have highlighted the potential for increased arm (shoulder and elbow) injury risk and time-loss from participation in weighted training.7–9,13 Some biomechanical reports suggest that increased pitching velocity may increase elbow varus torque and elbow injury risk.12,38,39 This evidence may suggest that WBT provides both the benefit of improved performance and the hazard of increased injury risk by increasing velocity.
The established professional pitchers in this cohort using weighted ball training displayed a concerning pattern of time loss injuries with a 15% difference in injury prevalence (WBT =39% (95% CI: 26-52%; NWBT= 24% (95% CI:13-39%). There were no differences when comparing within starting and relief pitchers and workload was similar when comparing appearances or innings pitched between training cohorts. This is concerning as weighted ball training was primarily used to impact performance through velocity training (77%) within this cohort sample, without subsequent cross-sectional performance improvements. It should be noted that previous season pitch velocity prior was not collected within this sample, not allowing assessment of potential pitch velocity increases, nor mechanisms underlying injury or performance.
The most frequent non-contact injuries sustained in the pitchers was a similar frequency of elbow injuries (n=11; 17% vs. 7%) when comparing WBT to NWBT pitchers, respectively. Nine shoulder injuries were reported. However, the most surprising finding was the number of core injuries sustained by our pitchers. Eight core injuries were reported over the course of the season with six occurring in the WBT versus two in the NWBT cohort. While these findings were not significantly different it is concerning that greater than 1/3 of the injuries sustained by pitchers in the WBT group were core injuries.
Forty-four of the 45 professional pitchers reported multiyear weighted ball training during both the off season and throughout the regular season. It was not logistically feasible to collect post weighted ball training program ROM in either the WBT or NWBT cohort. Direct comparison with previous articles collecting the influence of WBT on external rotation ROM data is not possible.
Numerous studies have previously reported the use of weighted balls in programs focusing on velocity enhancement and warm up for competition.6–9,13,17,18,40 These studies document a range of ball weights from 2-32 ounces and a variety of sets and repetitions.6–9,13,17,18,40 The variability in training protocols, research study designs, and athlete populations creates difficulty in determining the best available program for each pitcher to maintain both optimal performance and health.6,8 The evidence of injury risk in relation to weighted ball use is limited.8 However, in the only other study to prospectively follow pitchers that used weighted ball training throughout the baseball season, pitchers that used weighted balls reported a 25% increase in arm injuries.8 The comparison of professional pitchers training with and without a weighted ball program demonstrates the variety in personal goals and implementation. Based on these early results, it appears that self-selected weighted ball training prior to and throughout the season may increase the pitcher’s injury risk both to the upper extremity and in addition to the athlete’s core.
Strengths of the Study
The strengths of the study include the establishment of a group of pitchers within one professional baseball organization that demonstrated similar demographics, seasonal pitch workload, pitching metrics, ROM, and strength. This similarity combined consistently available athletic trainers to monitor and verify athletic exposure, injuries, and time loss from sport afford high quality and consistent data collection.
Study Limitations
It is important to highlight the limitations of this study. The results of the initial analysis were felt to be important because of the number and types of injuries reported in this cohort. For this reason, the most significant limitation is that this preliminary study is underpowered. The current power, apriori methods and statistical plan limited the outcomes to epidemiological information for the entire cohort (i.e., all pitchers) and stratified by weighted ball training. This is the initial year of a multiyear study; therefore, additional data may change the ultimate findings and recommendations of the study. Each athlete self-selected their individual ball weight, training duration, and volume. These parameters may not have been consistent throughout every training session as the most consistent report from pitchers influencing ball weight was equipment availability at the time of training. In addition, it is critical to highlight that the variability of the workload and training parameters may significantly influence the true impact of this training on the potential injury risk of the individual athletes.
CONCLUSION
The results of this study add to the body of knowledge regarding weighted ball training highlighting the frequency of use, type and burden of injuries in professional pitchers. The information provides initial understanding of the magnitude of training and potential injury risk in professional pitchers. The percentage of pitcher injuries in the WBT was 39.1% versus 23.8% in the NWBT group. The percentage of days lost in the WBT group was 39.0% versus 24% in the NWBT group. This preliminary analysis was significantly underpowered and therefore, the injury rate and days was similar between groups. The most surprising findings include the number of core/trunk injuries documented and the increased time away from sport in the WBT cohort. Additional follow up is needed to clarify these findings.
Conflicts of Interest
The authors listed above do not have any conflict of interests with the subject of this article.