INTRODUCTION
Basketball is a sport that requires large volumes of high-intensity changes of direction, jumps, and sprints, which pose an increased risk of lower limb injury.1 Knee injuries account for 16.3% of the total number of injuries sustained in adolescent competitive basketball athletes.2 The anterior cruciate ligament (ACL) injury incidence rate per 1,000 athlete-exposures in basketball are 0.06 and 0.16 for high-school and collegiate or semi-professional level players, respectively.3 Athletes intending to return to sport commonly elect an anterior cruciate ligament reconstruction (ACLR) procedure to attempt to restore the structural stability of the knee.4 However, approximately one in three young athletes will suffer a second ACL injury after returning to sport.5,6 Though it has been shown that following a recommended ACLR rehabilitation timeline and achieving satisfactory performance benchmarks reduces the risk of reinjury,7–11 there is still a lack of consensus on test selection to identify reinjury risk.12
In the clinical setting, force plate technology has been used to examine kinetic performance(s) during jumping tasks. Vertical jump testing can identify persistent lower limb asymmetries in athletes after ACLR, even after satisfactory clearance of conventional strength and horizontal hop testing.13–18 Unfortunately, it is unclear in the literature which of the suggested vertical jump tasks and the hundreds of available assessment metric combinations are relevant to basketball athletes after injury.19 To add greater complexity to clinical decision-making, the previously recommended 90% limb symmetry for other rehabilitation test benchmarks is not applicable to vertical jump tasks as between-limb asymmetries scores will have large variability with repeated testing in the uninjured athletic population.20–23
Therefore, the purpose of this study was to examine the jump performances of high school and collegiate male basketball athletes in the final stages of ACLR rehabilitation to 1) establish referenceable between-limb symmetry referenceable scores and 2) identify metrics that best detect between-limb asymmetry during common vertical jump tasks.
MATERIALS AND METHODS
Study Design
This was a retrospective cohort study among high school and collegiate male basketball athletes undergoing rehabilitation after ACLR. A-priori sample size was derived from similar research examining asymmetry performances of athletes undergoing ACLR rehabilitation during a series of jumping tasks.14 An effect size of -0.95 of the metric concentric impulse was selected as this metric demonstrated statistically significant differences between lower limbs for all jumping tasks. An alpha of 0.05 and a power of 0.8 were selected to determine a sample size of 15 for our study per the referenced table.24 The Rocky Mountain University of Health Professions and University of Wisconsin Institutional Review Boards approved the waiver of informed consent per the maintenance of database retrieval standards of the IRB committee.
Participants
The UW Health database was queried between March 2019 and April 2023 to identify patients who underwent primary ACLR using either patellar tendon autograft, hamstrings tendon autograft, or quadriceps tendon autograft procedures and who completed force plate jump testing from two UW Health hospital-based locations in Madison, Wisconsin. Participants met the following inclusion criteria: (1) aged between 14 and 25 years at the time of study participation, (2) male population, (3) completed an isokinetic knee extension test at 60°/sec, and (4) patient intended to return to competitive basketball after surgeon’s clearance. Participants were excluded if they met the following criteria: (1) lower limb surgery six months prior to ACLR, (2) concomitant cartilage injury requiring surgical correction, and (3) pain limiting the participant’s ability to complete the jumping tasks.
Procedure
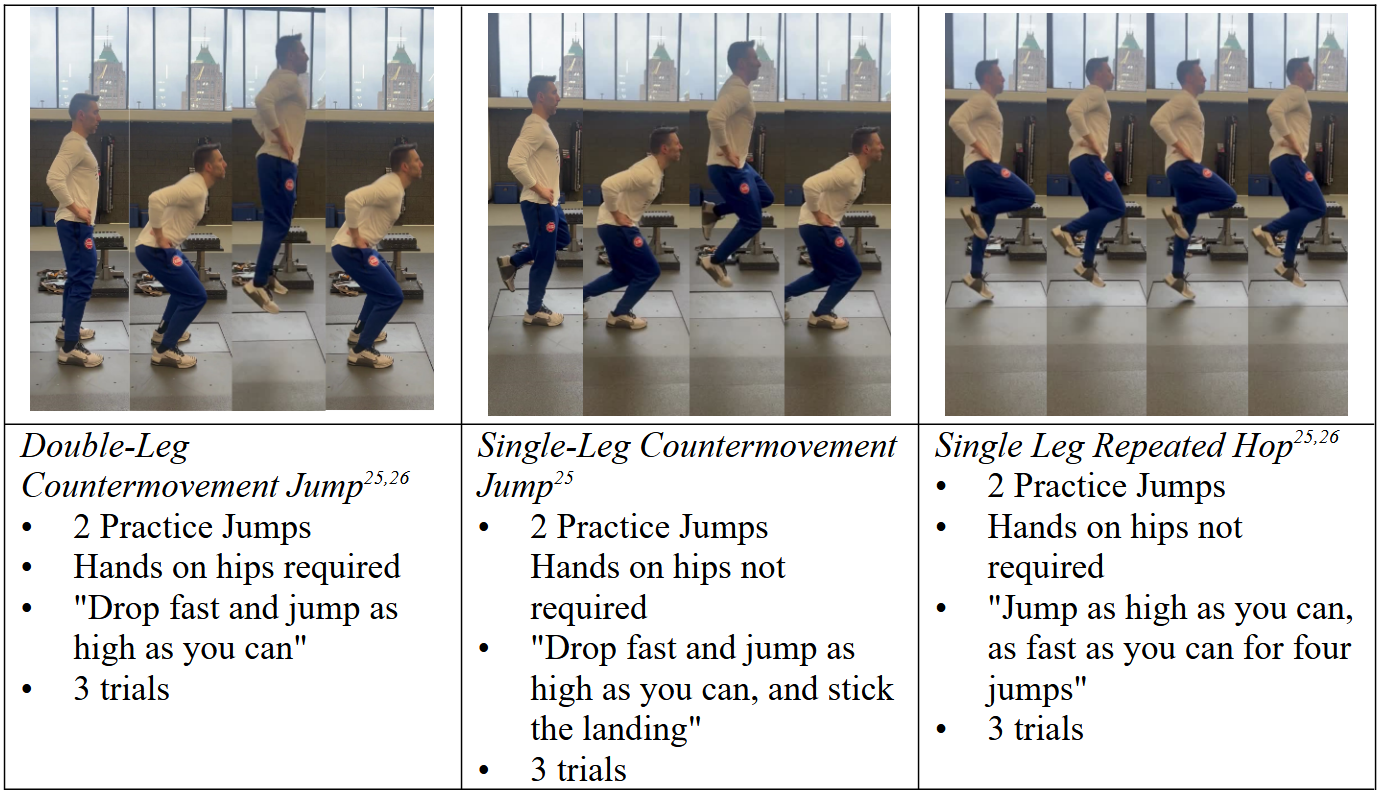
Data were collected from two rehabilitation centers of a hospital system. The data examined were of the participant’s most recent assessment of jump performances and isokinetic testing on record within that system. The recording clinician provided verbal instructions on how to execute the jumping task. Jump testing was performed using in-ground, dual force plates sampling at 1,000Hz (AMTI Watertown, MA).25 Participants completed the jumping tasks in the following order: [1] Double-Leg Countermovement Jump (DL-CMJ), [2] Single-Leg Countermovement Jump (SL-CMJ), [3] Single-Leg Repeated Hop (SL-RH). The procedure order and description of each jump task are in Figure 1. Each test was completed first by the uninvolved limb. Table 1 presents the metrics examined in this study, which were based on previous literature that found statistically significant lower-limb asymmetries during jumping tasks in uninjured and injured athletes.

Quadriceps peak torque was tested using an isokinetic dynamometer (Biodex System 4 Pro; Biodex Medical Systems) with hips and knees flexed to 90° with straps secured over the participant’s thigh and hips, the femoral condyles aligned with the axis of rotation, and the distal pad was affixed to distal shank about 5cm proximal to the medial malleolus. The uninvolved limb was completed first with three submaximal trials at 50%, 75%, and 90% of maximum effort. Testing then consisted of five consecutive maximum efforts of extension and flexion at 60° per second. Participants were provided with standardized verbal encouragement.
Double-Leg Countermovement Jump (DL-CMJ)
Participants were asked to place their hands on their hips with one foot on each force plate, hold still until given the verbal cue to jump, and “drop fast and jump as high as possible.” Participants were given two practice jumps and three recorded trial jumps.
Single-Leg Countermovement Jump (SL-CMJ)
Participants were not required to keep their hands on hips but were asked to place one foot on a force plate with the free leg bent at the knee behind the subject, hold still until given the verbal cue to jump, and “drop fast and jump as high as possible,” and maintain landing for two seconds. Participants were given two practice jumps, and three recorded trial jumps on each leg.
Single-Leg Repeated Hop (SL-RH)
Participants were not required to keep their hands on hips but were asked to place one foot on a force plate with free leg bent at the knee behind the subject, hold still until given the verbal cue to jump, and to “jump as high as you can as fast as you can for four jumps.” Participants were given two practice trials and three recorded trials for each leg.
STATISTICAL ANALYSIS
Descriptive statistics were used to report demographic data and jump metrics. The normality of the distribution of data was determined using the Shapiro-Wilk test after removal of data outliers demonstrating p<0.05.35 Further analysis examined the average score for each jump test, metric, and quadriceps peak torque. Limb symmetry index (LSI) was calculated for each metric with the following formula36:
LSI=SurgicalLimbNonsurgicalLimbx100
Independent samples t-tests were performed to determine the differences in LSI of each metric between participants who had a quadriceps peak torque LSI of less than 90% and greater than 90%. A p<0.05 was chosen as statistically significant. Cohen’s d values were calculated and classified as small (<0.2), moderate (0.5), and large (>0.8).37 Analysis was computed via Intellectus Statistics software 2023 (7th ed, Intellectus Statistics).
RESULTS
This study reviewed the jumping performances of 49 male basketball athletes in the final phases of rehabilitation after ACLR with demographics and isokinetic quadriceps testing outcomes presented in Table 2.
Referenceable lower limb symmetry scores for metrics of the jumping tasks are summarized in Table 3. The referenceable LSI jump performance data provides clinicians with the perspective of differences between athletes who have and do not have satisfactory quadriceps strength as defined as >90% LSI. Clinicians are encouraged to also reference the coefficient of variation for each metric when discerning rehabilitation progress as determinations by LSI alone may mislead athlete progress.
A comparison of jump metrics between athletes above and below 90% quadriceps peak torque LSI is presented in Table 3. Statistically significant differences in LSI scores during the DL-CMJ were found in Eccentric Rate of Force Development (RFD), Concentric Impulse, Concentric Impulse 100ms, Contact Time, and Peak Take-Off Force. Statistically significant differences in LSI scores during the SL-RH were found in Flight Time:Contact Time and Jump Height. No significant differences in LSI scores were found between SL-CMJ testing groups.
DISCUSSION
This study provides referenceable lower limb symmetry data during jumping tasks of high school and collegiate male basketball athletes in the final phases of rehabilitation after ACLR. Additionally, jump performances were compared between jumping tasks and quadriceps strength scores to identify metrics that exhibit the highest sensitivity for between-limb asymmetry.
Normative symmetry data for jumping tasks has been provided for other athletic populations after ACLR, but to the author’s knowledge, there is no comprehensive reference for the basketball population after ACLR.14,18,27–29,31,34,38 Referenceable symmetry measures are available for the healthy basketball population, but the metrics selected are limited to jump height, peak force, or peak power alone.39–41 More robust symmetry metrics are available for healthy collegiate and amateur basketball players, but these studies have limited sample sizes (<15 male subjects).30,42
Select jump characteristics were not restored at the time of final testing when athletes also demonstrated a quadriceps peak torque LSI of less than 90% relative to athletes who scored greater than 90%. The symmetry performances during the DL-CMJ and SL-RH are consistent with previous findings in other athletic populations, which showed residual deficits even after clearance to return to competition.14,18,27–29,31,33 To improve the clinical efficacy of detecting asymmetries during force plate jump testing, these findings lend to the clinical recommendation of assessing multiple jumping tasks and metrics.
Interestingly, no asymmetries were found in this study between groups during the SL-CMJ. Statistical trends were noted in this study; however, the findings are not in agreement with other athlete performances after ACLR. Kotsifaki et al. compared 26 male athletes after return to sport clearance after ACLR to controls and identified significant differences in Jump Height and Flight Time:Contract Time values during an SL-CMJ.14 The following year, Kotsifaki published the performance results of 126 professional and recreational male athletes at the time of return to sport clearance after ACLR compared to controls and only noted a significant difference in the metric Concentric Impulse during the SL-CMJ.13 Another investigation group examined various single-leg jump performances in collegiate athletes about seven months after ACLR and found that the Jump Height during the SL-CMJ was more discriminative in asymmetry detection than horizontal hopping performances.28 Differences in the findings of this study could be attributed to the comparison between ‘weaker’ and ‘stronger’ quadriceps groups rather than comparing to a control group. Additionally, the act of a SL-CMJ is a trainable skill and can improve with practice. The cohort in the current study was of a relatively younger population compared to the previously referenced athlete groups who presumably have more years of sport and strength training experience.
The examination of the performances of groups based on quadriceps peak torque was chosen as isokinetic dynamometry is established as a gold standard in assessing knee strength in the ACLR literature and has been shown to be more sensitive in detecting between-limb asymmetries than other performance tests, such as hopping for distance and leg press output following ACLR.7,43,44 Additionally, significant relationships between isokinetic peak torque of the quadriceps single-leg jump performances in male field-sport athletes in the final stages of ACLR rehabilitation have been demonstrated. O’Malley et al. showed at 6 months post-ACLR a strong relationship between quadriceps peak torque LSI and SL-CMJ Jump Height LSI, while Crotty et al. demonstrated at 9 months post-ACLR a significant relationship between quadriceps peak torque LSI and single-leg drop jump Flight Time:Contraction Time LSI.33,45 A 90% quadriceps strength LSI cutoff between groups was established in this study per previous ACLR research and content expert consensus.7,9,20,21 However, though previous studies demonstrate a significant relationship between isokinetic measures and jump testing, this study reveals that isokinetic testing does not consistently align with jump test findings for all jumping tasks. Therefore, it can be presumed that these tests measure different physical qualities and jump testing can supplement a testing battery for this population.
The findings from this study reinforce findings of other studies that a 90% LSI demonstrates an inconsistent relationship to all metrics and jumping tasks for this population, lending to the author’s discouragement of this benchmark as a proxy for jump symmetry criteria.21–23 Therefore, effort was made to reference the standard deviations and coefficient of variation of the jump metrics to help guide practitioners when jump performances do not satisfy traditional LSI thresholds.
LIMITATIONS
The retrospective design limits the strength of the results by increasing the risk of selection bias and the dependency on the accuracy of medical records. The data selected for analysis were from the participant’s last recorded jump performance, but the timeline of completion of rehabilitation and successful return to basketball rates were unknown. The average postoperative test may have limited asymmetry findings as greater asymmetries may have been found with earlier testing. Only males were included from a single institution, limiting generalizability to other populations. There was no established rehabilitation protocol lending to potentially differing outcomes. For example, an LSI score of >100% on a test could infer successful rehabilitation; however, undertraining of an uninvolved limb may skew results. Future research should also include allometric scoring relative to body weight to establish meaningful cutoffs. Longitudinal research is needed to compare against uninjured control groups and to analyze the relationship between graft type and performance outcomes. Lastly, the effort of the athlete performing the jump testing could be standardized by utilizing the metric peak eccentric velocity to establish a threshold and the inclusion of psychological readiness outcome measures.
CONCLUSION
Basketball athletes in the final phases of ACLR rehabilitation who exhibit more significant quadriceps strength asymmetry demonstrated greater asymmetry during double-leg and single-leg reactive jumping tasks but not during single-leg countermovement jumps. These inconsistencies highlight the importance of implementing a battery of jump tests during rehabilitation to ensure adequate restoration of the several physical qualities required of basketball athletes. Additionally, the referenceable data provided demonstrates large variability between jump tasks and assessment metrics, encouraging clinicians to conduct jump testing in series throughout rehabilitation instead of relying on a single jump performance or metric threshold to determine return to sport readiness.
Corresponding Author
Christopher Hart, PT, DPT, SCS, CSCS
6201 2nd Ave, Detroit, MI 48202
Phone Number: (608) 751-8355
Fax Number: (313) 747-8667
Email: cshart14@gmail.com
Conflicts of Interest
The authors report no conflicts of interest.