Introduction
Running has become a widely popular activity due to its low economic cost, minimal equipment requirements, and well-established health benefits, such as improved cardiovascular and neurological functions, weight control, and reduced risk of heart disease.1–6 However, this increasing participation has been accompanied by a significant rise in running-related injuries (RRI). Reported musculoskeletal injury rates range from 30% to 79% per 100 at-risk runners, with incidence estimates varying from 7 to 59 injuries per 1000 running hours.7,8
Injuries in running can be broadly classified as either acute, such as muscle tears, strains, sprains, or superficial skin injuries, or overuse injuries, with the latter accounting for approximately 80% of RRI.6–11 Common overuse injuries include patellofemoral syndrome, iliotibial band friction syndrome, medial tibial stress syndrome, Achilles tendinopathy, and plantar fasciitis; these conditions typically arise as a consequence of excessive repetitive loading.10,12–14 Although intrinsic factors like sex, race, and skeletal structure have been widely investigated as contributors to injury risk, biomechanical factors, particularly those related to running technique, remain relatively underexplored despite being estimated to contribute up to 40% of RRI.14
In the context of running biomechanics, researchers have examined a variety of kinematic variables to assess their relationship with injury occurrence. Depending on the plane of motion and the lower extremity joints evaluated, researchers have identified several variations associated with specific injuries.15 Variables such as foot strike pattern, foot progression angle, pelvic drop, hindfoot eversion, tibia angle in response to loading, peak knee flexion during the stance phase, overstriding, vertical displacement of the center of mass, trunk inclination, and knee window have all been reported to have potential links with RRI.16
Kinematic evaluation involves assessing both the displacement and angular movement of different body segments during running, typically through measurements of position, velocity, and acceleration in both linear and angular forms.17 Although 3D motion capture is considered the gold standard in biomechanical research, its complexity and high cost have led to an increased use of 2D motion analysis with conventional video cameras. While 2D analysis has demonstrated reliability and validity for evaluating lower limb movements in the sagittal and frontal planes, it does face limitations when capturing movements in multiple dynamic planes.17–19
The application of 2D video analysis has enabled evaluations in larger groups of athletes; however, its practical use in clinical settings remains challenging. The necessary equipment, such as cameras, tripods, high-contrast markers, and controlled environments, along with the potential influence of artifacts and software constraints, increases both the complexity and cost of the process. Although perfect reliability (K = 0.81-1) has been demonstrated under certain conditions, the validity of 2D analysis compared to 3D motion capture can vary significantly18,19 One proposed solution to these limitations is the Automated Video Analysis for Dynamic Systems program, which facilitates the manual digitization of high-contrast markers in video recordings, thereby aiding in the quantification of continuous kinematic data.20 Another approach to streamline the kinematic analysis involves converting quantitative measurement into qualitative or categorical assessments, which could offer a quick and practical tool for clinicians. The challenge with this method lies in ensuring the reproducibility and reliability of the qualitative categorization of kinematic variables. It is critical to identify which variables can be consistently evaluated across different evaluators and testing sessions. In this regard, previous work by Souza et al., has made initial progress by categorizing some kinematic variables as the foot strike pattern.16
Building on these insights, the purpose of this study was to evaluate the reliability of the main kinematic variables of running, assessed categorically using 2D video analysis, in amateur runners aged 18 to 55 years. Establishing that these variables can be consistently and reliably categorized is crucial for enabling physical therapists and athletic trainers to accurately assess running techniques and tailor individualized training programs. Furthermore, demonstrating robust inter-rater reliability in this evaluation approach could serve as the foundation for future advances, including the development of automated video analysis systems that streamline and enhance clinical assessment of running biomechanics.
Methods
Participants
Thirty-three recreational runners (both genders; age 18-55 years; body mass index 18.5-30.0 kg/m2) from Santiago, Chile, were recruited via social media and local university outreach. Recreational runners were defined as individuals who had been running for more than three months, without competitive purposes, with a running frequency equal to or greater than three times per week and a maximum volume of 40 kilometers. Participants with musculoskeletal lower limb injuries in the prior six months or surgery in the prior two years were excluded.
The study was conducted following the principles of the Declaration of Helsinki and was approved by the ethics committee of Universidad de los Andes, Chile (CEC2021020). Participants were instructed about the assessment, its purpose, and the procedures to be performed. Before the test, all participants signed an informed consent form, outlining the assessment activities, as well as the benefits and risks they might face, with the latter minimized by the researchers. The information provided by the participants was processed under strict confidentiality to prevent any moral harm. Additionally, volunteers were free to withdraw from the research at any time, and their decision was respected.
Variables
Measurement protocol
Before recording, proper camera installation was carried out to ensure video recording with adequate resolution and image sharpness.21 Two Apple® phones, iPhone 11 and iPhone 13 models were used, with the following characteristics: 1080p HD resolution at a capture frequency of 60 frames per second (FPS). The cameras recorded in the horizontal plane, without the use of lenses such as wide-angle or fisheye, to avoid peripheral distortion, as the focal length is shorter. They were positioned with a stable tripod along with a level on the tripod to orient the cameras in space and avoid manual adjustment.21 Cameras were positioned at an approximate distance of two meters from the runner, with the final height and exact distance being fine-tuned to each volunteer’s anthropometry, following the protocol by Roche for both planes.21 Both cameras were synchronized to obtain simultaneous recordings in both planes and enhance the analysis of the variables. This was done using intermittent red light, which did not obstruct the camera lens, blinking three times before turning it off. To maximize image quality, natural or LED light was favored. Two ring lights were used just behind the camera, allowing light to bounce as much as possible onto the camera and avoiding flickering effects.21
Before the evaluation, the volunteer’s anthropometric variables (body mass, height, and body mass index) were recorded. For body mass, a digital scale (Eufy®) was used, and height was measured using a measuring tape. Additionally, the dominant limb was recorded, determined by a step-up and step-down test on a 30 cm high step.22 Each volunteer then performed a 10-minute warm-up at a self-selected running speed, below the test speed, to adapt to the treadmill conditions for comfortable execution,23 making it as similar as possible to normal conditions. After the warm-up, 3x3 cm markers with distinctive colored tape were placed on the dominant lower extremity at the following anatomical points: posterior superior iliac spines, greater trochanter, lateral femoral epicondyle, mid-thigh, mid-tibia, lateral malleolus, heel, and forefoot superiorly. This was done to improve perspective during video analysis.
Subsequently, recording began and continued for two minutes while the volunteer ran at a self-selected speed. Following the run, the volunteer walked on the treadmill for three minutes to gradually return to a resting state. Afterwards, evaluators conducted a series of lower limb stretches, including those targeting the quadriceps, hamstrings, and gastrocnemius.
The final video for each participant, synchronized from both camera planes, contained 20 running cycles for analysis. To facilitate detailed observation, evaluators were permitted to reduce the video playback speed by 10-25% using iMovie.
The kinematic analysis was performed through purely visual inspection, without the use of any specialized motion analysis software. Three independent rating entities were established for this process:
-
A consensus group (reference standard): this entity comprised a physical therapist with eight years of experience in biomechanics and three fifth-year physical therapy students with specialized training. Through collaborative review and discussion based on established literature, this group reached a definitive categorization for each variable (Table 1, Table 2). Their final decisions served as the reference standard for this study.16
-
An independent physical therapist: a specialist in sports with at least three years of experience working with amateur runners.
-
An independent athletic trainer: also, a specialist in sports with a minimum of three years of experience with amateur runners.
The 33 videos were compiled into a folder and shared with the two independent evaluators via AirDrop. Each analyzed the nine kinematic variables without knowledge of the ratings from the other evaluator or the consensus group. This blinded evaluation process was implemented to mitigate a priori bias. Subsequently, pairwise inter-rater reliability was calculated to compare the ratings among all three entities (consensus group vs. physical therapist, consensus group vs. athletic trainer, physical therapist vs. athletic trainer).
Sample size
The sample size was calculated using the Liao study, employing a 95% confidence level (alpha 0.05) and 80% power (beta of 0.2), resulting in a minimum required sample size of 32 individuals.24
Statistical Analysis
After analyzing the recordings, the agreement between the results obtained by the consensus group and those provided by external evaluators was determined. Concordance referred to how closely the observations on the measured variables matched each other and, therefore, did not assess the validity or certainty of the variables.25 Since all mentioned variables were measured categorically, the Cohen’s kappa coefficient and weighted kappa were calculated based on the number of categories to analyze inter-rater agreement using STATA 14/IC software (STATA CORP. LTA, USA). This coefficient is interpreted at different levels depending on its magnitude, including weak (< 0.40), moderate (0.40-0.60), strong (0.61-0.80), or perfect (0.81-1) categories.25,26
Results
A total of 33 recreational runners were included in the final analysis. The demographic and anthropometric characteristics of the sample, including age, sex, and body mass index, are detailed in Table 3.
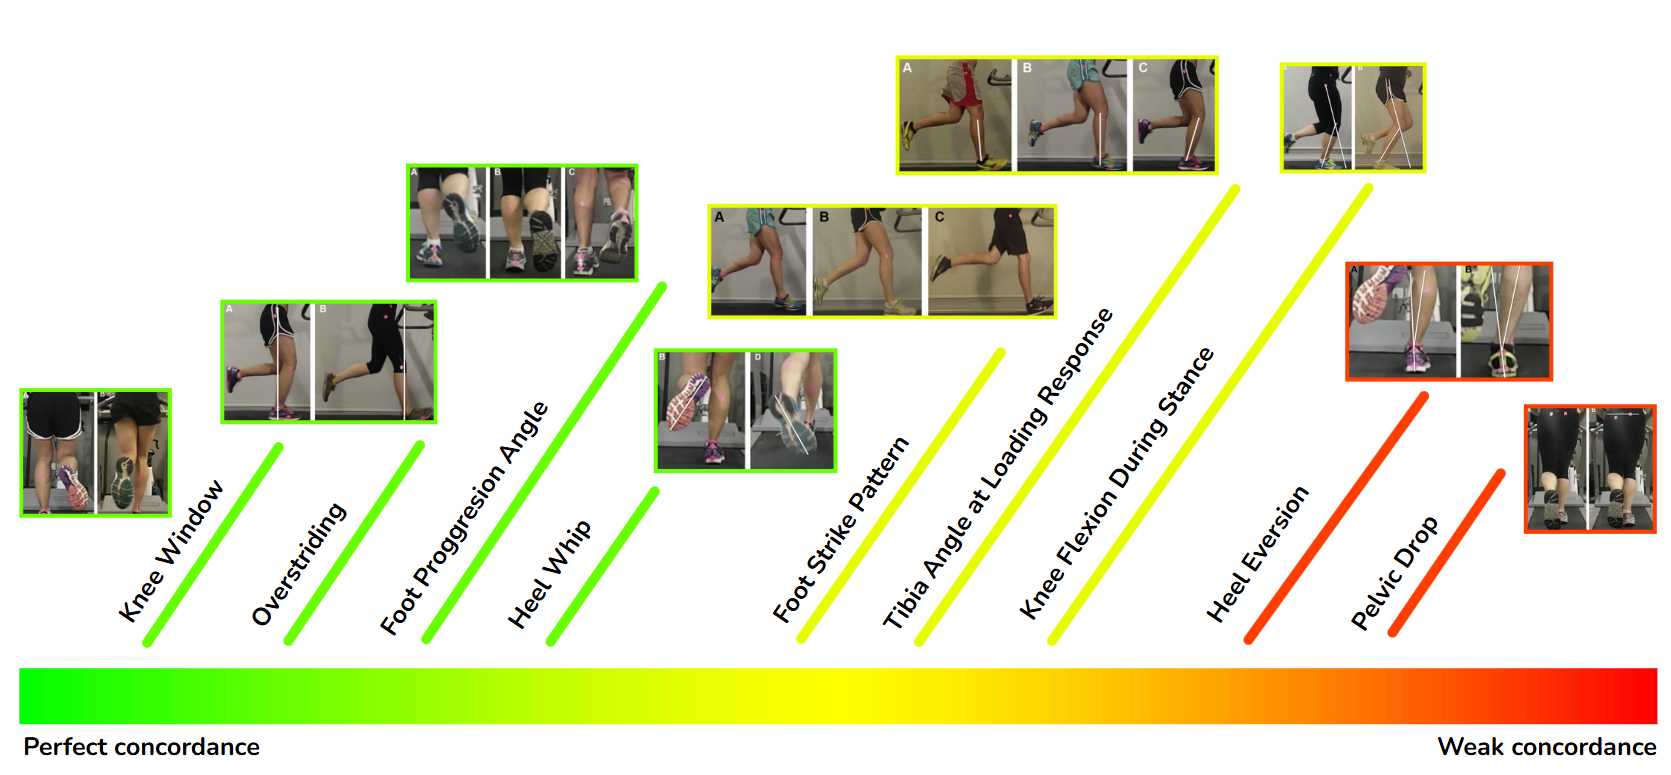
The pairwise inter-rater reliability for the nine kinematic variables is presented in Table 4 and summarized visually in Figure 1. The analysis revealed substantial to almost perfect agreement for several variables. Specifically, the variables with the highest concordance across the rater pairs were the knee window (K = 0.847, 0.847, 0.835), overstriding (K = 0.920, 0.780, 0.857), foot progression angle (K = 0.847, 0.654, 0.792), and heel whip (K = 0.780, 0.847, 0.835). In contrast, the variables demonstrating the weakest and most inconsistent agreement were pelvic drop (K 0.257, 0.047, 0.597) and rearfoot eversion (K 0.604, 0.236, 0.604).

A direct comparison between specific rater pairs, presented in Table 5, highlights that the agreement between the consensus group and the independent physical therapist was particularly high, achieving strong to perfect concordance for seven of the nine variables.
Discussion
Running-related injuries are common among amateur runners, and while 3D motion capture is the gold standard for biomechanical analysis, its cost and complexity limit clinical use. In contrast, 2D video analysis offers a more practical alternative, yet its reliability for categorically evaluating key kinematic variables remains unclear. Therefore, this study aimed to address that gap by assessing the inter-rater reliability of this approach. The primary finding was that the analysis of running kinematic variables on a treadmill through 2D video is a reliable tool for implementation in the clinical setting, aligning with other studies that identify it as a useful instrument in certain contexts.3,7,18,27 However, according to the current findings, its reliability is affected by the variables assessed and the preparation and experience of the evaluators.
An analysis of the data did not support the hypothesis that one observational plane is inherently more reliable than the other. Instead, the findings indicate that reliability is a function of the specific kinematic variable in question. This is demonstrated by the mixed results within each plane (Table 5). At first glance, the sagittal plane presented challenges, as only overstriding (K = 0.920, 0.780, 0.857) achieved high reliability across all rater comparisons. This seems to contrast with literature suggesting sagittal plane kinematics are easier to assess.28 However, this interpretation is incomplete. When the analysis is limited to the expert consensus group and the experienced physical therapist, all four sagittal plane variables achieved strong-to-perfect agreement. This highlights that rater experience may be a more critical factor than the plane of view. Similarly, in the frontal plane, variables such as knee window showed high reliability, while others like pelvic drop were consistently unreliable regardless of the rater. Therefore, the evidence suggests that clinicians should focus on the known reliability of individual variables rather than assuming an entire observational plane is reliable.
Focusing on the successful assessments, four variables demonstrated consistently high inter-rater agreement: knee window, heel whip, foot progression angle, and overstriding. Among these, the knee window stood out, achieving perfect agreement (K = 0.847, 0.847, 0.835) across all three rater comparisons. These variables likely performed well because they represent distinct, easily observable events with clear visual cues, making them suitable for categorical, even dichotomous, judgment.
In contrast, variables such as foot strike, peak knee flexion during stance, and tibia angle at loading response demonstrated weak and inconsistent inter-rater concordance. The poor performance of these variables can be attributed to several factors. Firstly, assessing them often requires identifying a single precise frame within a rapid movement, a task that is inherently challenging in standard 2D video. Secondly, a polytomous scale (multiple options) may introduce more subjective ambiguity than a simple binary choice. The lower agreement for these variables underscores the limitations of visual 2D analysis for capturing subtle, transient kinematic events.
A central theme emerging from these contrasting results is the profound impact of the measurement scale. The data suggests that using a dichotomous (yes/no) scale is a powerful strategy for increasing reliability in 2D analysis. Even when a variable had quantitative undertones (like the degree of heel whip), the binary classification proved effective. This practical observation is supported by statistical theory; dichotomizing variables, particularly around the median, creates a robust classification that is invariant to data transformations and less sensitive to asymmetric distributions, which in turn enhances the stability of agreement coefficients like Kappa.27,29
The analysis of rearfoot eversion yielded poor and inconsistent reliability (K 0.604, 0.236, 0.604), suggesting its assessment via 2D video is not advisable for clinical use. This low agreement is likely attributable to the inherent difficulty of capturing a complex, tri-planar motion from a single frontal plane view, a limitation previously highlighted by Souza et al.16 The challenge is compounded by the foot’s natural abduction in the transverse plane (12° to 18°), which can obscure a true posterior view and introduce significant observational bias.30
Pelvic drop exhibited the lowest concordance of all variables measured (K 0.257, 0.047, 0.597), confirming its unsuitability for clinical evaluation with this method. This poor performance directly illustrated a central theme of this study: the negative impact of complex rating scales. The assessment of pelvic drop requires a multi-category judgment combined with an estimation of movement magnitude, in contrast to the simple, dichotomous variables that proved more reliable. This finding reinforces the conclusion that combining multi-category scales with quantitative estimations severely hinders observational consistency in 2D analysis.29
Rater expertise emerged as a critical factor influencing measurement reliability. The consensus group and the experienced physical therapist achieved strong-to-perfect agreement on seven of the nine variables, whereas comparisons involving the athletic trainer only reached this level for four. This disparity suggests that reliability is closely linked to academic training in biomechanics and clinical experience in movement analysis, which was a competency profile that distinguished the physical therapist and the consensus group. Consequently, the findings support a two-tiered classification for the clinical applicability of these variables. A core group (foot progression angle, heel whip, knee window, and overstriding) proved robust enough for reliable assessment regardless of the rater’s background. In contrast, the reliability of other key variables, namely foot strike pattern, peak knee flexion during stance, and tibia angle at loading response, was highly dependent on evaluator expertise. This finding for foot strike is especially noteworthy, as it contradicts previous research suggesting it should be a universally reliable measure.3 In the present study, these three variables consistently yielded weak to moderate concordance in evaluations involving the athletic trainer, while achieving strong agreement exclusively between the expert raters (Table 5). Therefore, while some variables are broadly applicable, the clinical utility of this latter group is contingent upon assessment by practitioners with demonstrable expertise in 2D kinematic analysis.
The findings of this study identify a core set of variables that demonstrated high inter-rater concordance, suggesting their suitability for reliable clinical categorization. While this high concordance serves as a strong indicator of inter-rater reliability, it is critical to acknowledge that reliability does not inherently establish the method’s validity. In other words, consistent agreement between raters does not guarantee that the 2D assessment accurately reflects the true biomechanical event. Therefore, to progress from a reliable method to a validated clinical tool, the essential next step is a direct comparison of this 2D analysis approach with the gold-standard 3D motion capture. Such a study is required to confirm the method’s accuracy and support its future development for widespread clinical application.
Limitations
Despite the rigorous methodology employed, this study has several limitations. 1) Minor inaccuracies in camera synchronization may have occurred. Although a reflective light marker was used to facilitate frame-by-frame alignment, perfect synchronization between cameras cannot be fully guaranteed. 2) The posterior view was susceptible to perspective errors, as the natural medial-lateral displacement of a runner on a treadmill can affect the precision of ankle and foot kinematic measurements.21 3) The treadmill’s sidebar periodically obstructed the view of the greater trochanter marker, potentially compromising the assessment of the overstriding variable. Future research should utilize equipment that allows for an uninterrupted sagittal view. 4) Marker visibility was occasionally compromised by participant clothing that lacked sufficient contrast. While participants were instructed to wear dark attire, non-adherence in some cases suggests that stricter clothing protocols are needed to optimize marker detection. 5) Despite detailed protocols, variability may have arisen from subjective differences among raters in identifying the precise video frame for analysis. 6) Finally, although some studies mentioned not finding significant differences when studying kinematic variables on a treadmill versus pavement,31 the present study does not replicate the usual external conditions of overground running. However, this method remains a standard approach for conducting assessments in a controlled environment.27
Future directions
To make this type of assessment accessible to various types of evaluators without compromising reliability, as mentioned earlier, future interventions should include pre-training for less experienced evaluators to ensure better results. This approach is consistent with the results of Reinking et al., where minimal differences were observed between experienced and inexperienced evaluators in the analysis of kinematic variables running in 2D video, and all evaluators underwent a three-hour training session before conducting the video analysis.32 Following this same line, it would be suggestive for future studies to examine whether differences in the analysis of variables between evaluators are modified with the addition of training, aiming for greater concordance between less experienced and experienced evaluators. Additionally, it is important to mention that the creation of a standardized measurement instrument is recommended for replication by different research centers, thereby obtaining comparable results across different studies. Additionally, recording with cameras with an image capture rate greater than 60 FPS is suggested to improve the observation of the exact frame in which the variable is analyzed, especially for peak knee flexion in the stance phase and tibia angle in response to load. Furthermore, it is suggested that the variables to be evaluated be purely qualitative and dichotomous, not requiring assessment of exact angles of movement as mentioned earlier and not having more than one category. For example, in the case of this study, it would be prudent to modify the categorization of the pelvic drop variable to define the absence or presence of this pattern27 or provide greater clarity through illustrative images of the alternatives.
Conclusion
The current findings support using categorical assessments of running kinematic variables via 2D video analysis for some variables assessed in running gait analysis. However, to transform this method into a reliable tool that enables valid comparisons across studies, standardization of measurement conditions is essential. The current results reveal significant variability among evaluator groups, underscoring that reliability depends on both the specific variables assessed and the expertise of the evaluators. Notably, variables such as foot progression angle, heel whip, knee window, and overstriding achieved perfect agreement, suggesting their potential as robust indicators in this evaluation context.
Conflicts of interest
The authors report no conflicts of interest.
Acknowledgments
We would like to express our gratitude to Badir Zara for offering the facilities and supporting the participant assessments, and to Rodrigo Guzmán Venegas and Óscar Valencia Cayupán for their valuable methodological guidance and suggestions.