
INTRODUCTION
Velocity-based training (VBT) is a method of resistance training in which movement velocity is used to prescribe and monitor training load, rather than relying solely on a fixed percentage of one-repetition maximum (1RM).1 VBT is effective2 and reliable3 to optimize neuromuscular training stimuli4; especially when the set is stopped at a velocity loss of 10%-20%.5 This threshold is enough to characterize the first repetitions of each set, reduce fatigue between sets, and maintain training quality.6 A reduction in total training time, lower neural fatigue and muscular damage, and improvements in muscle strength, sprinting, and jumping are among the benefits of VBT.7,8 Some studies have used the rating of perceived exertion (RPE) to monitor the load during VBT.9–11 However, these investigations asked for the RPE when the set was finished, which entails the athlete performing the full set although they may not have an appropriate load. Therefore, the question arises as to whether an alternate method can help control the intensity from the first repetition to be able to stop the set (avoiding undue fatigue) and modify the load if necessary.
Elastic bands (EB) are increasing in popularity12–16 owing to their ease of use, portability, and cost-effectiveness. Resistance training with EB is similar to traditional methods (e.g., free weights and machines) in terms of strength and health-related gains.17 However, monitoring intensity during elastic resistance training in VBT is challenging in clinical and field settings due to the lack of validated, practical tools. Traditional methods such as 1RM testing or linear velocity transducers are often impractical, expensive, or inappropriate in certain populations. As a result, clinicians and practitioners may lack effective ways to personalize training, particularly when using EB. Fortunately, previous studies have used the OMNI-Resistance Exercise Scale for EB (OMNI-RES EB) to estimate the dosage of intensity during VBT with EB.18–20
The OMNI-RES EB is a perceived exertion scale specifically developed and validated for use with elastic resistance, due to the variable load that occurs throughout the range of motion when using EB, making it a potentially valuable tool in both clinical and performance settings.21 However, RPE validations for monitoring the intensity during resistance training with EB have commonly used a traditional approach, meaning that exercises were performed at a moderate-controlled pace and that the RPE was reported immediately at the end of each set.21–24 Despite these types of scales being used in the literature, they have not yet been validated for this specific application (i.e., VBT with EB). Consequently, this can lead to misinterpretation of effort, incorrect load adjustments, and potentially suboptimal training stimuli.12 In clinical settings, such inaccuracies could compromize individualization of training, delay progression, or increase fatigue risk due to improper intensity control. Therefore, assessing perceived exertion from the first repetition during VBT with EB may lead to improvements across all these variables. This approach also offers a simple and practical solution for monitoring effort and adjusting load in real time, particularly in settings where equipment or time is limited.
Although previous studies have analyzed perceived exertion during the first repetition using constant external loads (e.g., weight plates),25 the specific application of the RPE to VBT with EB is relatively recent, and the potential utility of the first-repetition RPE in this context has not yet been examined. Therefore, the purpose of this study was to determine whether the OMNI-RES EB is an appropriate tool for monitoring exercise intensity during squats performed at maximal intended velocity and with a 10% velocity loss during elastic resistance training within a VBT framework. Sex, physical activity level, and relative strength, as well as their reliability between sessions, were considered. It was hypothesized that the RPE obtained during velocity-based elastic band resistance training would be a valid tool to monitor load from the first repetition, regardless of participants’ sex, relative strength, or physical activity level.
METHODS
Study Design
A quasi-experimental design was used to validate the OMNI-RES EB across a wide range of intensities during squats performed at maximal intended velocity (VBT), with the descent standardized so that the thighs reached a position parallel to the ground. Participants performed five sets using different EB configurations to load the bar at 40%, 55%, 70%, 85%, and 100% of 1RM measured in the standing position; the order of the sets was randomized (i.e., sealed envelopes). Homogeneous rests of five minutes were allowed between sets. Between sets, subjects rested seated in a separate room while two researchers adjusted the resistance band tension to the next randomized intensity. Each set was stopped when a minimum of 10% intra-set velocity loss was achieved. Mean propulsive velocity (MPV) and RPE were recorded in the first repetition. The kilograms in the standing position, number of repetitions, heart rate, and MPV and RPE for the last repetition were recorded immediately after the last repetition. All the procedures were conducted according to the tenets of the Declaration of Helsinki and were approved by the Ethics Committee of the University of Valencia (Spain) (H20190325095509).
Subjects
An announcement was placed on the information boards of the Faculty of Physical Activity and Sports Sciences at the University of Valencia (Spain) to recruit participants. A convenience sampling method was employed based on voluntary participation. Subjects had to have had ≥ six months of experience in resistance training and be familiar with squat exercises to be included. Twenty-six students agreed to participate. However, participants who had suffered any type of muscle, ligament, or tendon injury one year before the study were excluded (n=2). The consumption of ergogenic or nutritional aids was not allowed at any time. The participants did not exercise at high intensity involving the lower limbs ≥24 hours before each test. Each participant provided informed consent prior to participation.
Procedures
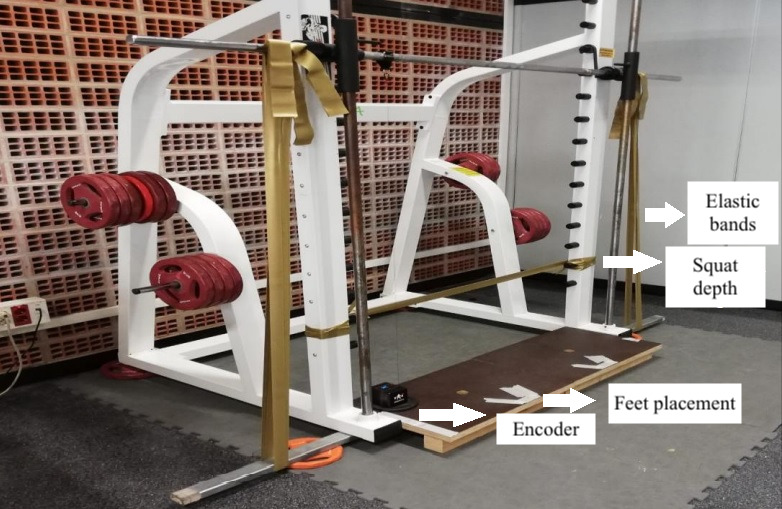
A Smith machine (Powerline, PSM14X, Body-Solid, Chicago, IL, USA) was used for this study. EB (CLX bands, TheraBand® Hygenic Corporation, Akron, OH, USA) were used to load the barbell. A digital scale (Salter, Model 9179 SV3R, Barcelona, Spain) and an adjustable strut with a range of 95–170 cm (Model 30011, Piher, Logroño, Spain) was used to weigh the bar (20 kg), together with the resistance provided by the bands. The bar was placed at a height corresponding to the standing position of each participant to measure the total weight used by the participant at the highest point. Additionally, each participant’s squat range of movement was measured with a manual goniometer (Baseline®, New York, NY, USA) to identify the individualized squat depth,26,27 which corresponded to the position where the thighs were parallel to the ground and was marked with a horizontal band. The eccentric phase was executed in two seconds and the concentric phase was executed as fast as possible. The setup for the study is shown in Figure 1.
Two familiarization sessions were employed to conduct the anthropometric measurements and evaluate the 1RM load. Anthropometric measurements were obtained with a height rod (IP0955; Invicta Plastics Limited, Leicester, England) and a bioelectrical impedance scale (Body Composition Analyzer BF-350; Tanita Corporation, Tokyo, Japan). BMI was calculated as weight [kg]/(height [m]).2 Additionally, four sets (40%, 55%, 70%, 85%, and 100% 1RM) were performed in a straight order in both sessions for the participants to gain more experience with the RPE scales and procedures. After 72 h, two experimental sessions (test-retest) were conducted to assess the validity and reliability of the measurements.
1RM Calculation
After a standardized 10-minute warm-up, the weight for 1RM was indirectly calculated through a fatigue test with submaximal loads with weight plates. O’Connor or Epley28,29 formulas were used when 8 to 9 repetitions or between 10 and 12 repetitions were performed, respectively. These formulas have been previously validated in different populations.30
Heart Rate Measurement
Heart rate monitors (Polar FT1, Polar Electro, Tampere, Finland) were attached to the chest of each participant.
Movement Velocity Measurement
A linear position and velocity transducer (Speed4Lift, Madrid, Spain) was used to measure the MPV (see Figure 1). This instrument has shown good validity and reliability.31
Perceived Exertion Measures
The RPE for active muscles during the squat exercise was measured using the OMNI-RES EB.21 A detailed explanation of the scale was provided to the participants. The participants were asked to answer on a scale of 10 points (from 1 to 10). One researcher encouraged the subject to perform each concentric repetition at their maximal intended concentric velocity, while another researcher recorded the RPE values verbally reported by the subject. The subject had continuous visual access to the OMNI-RES EB chart to report perceived exertion, as well as to a tablet displaying the MPV for each repetition.
Relative Strength
The relative strength ratio was measured by dividing the 1RM load (in kilograms) by body weight (in kilograms). A value of one indicated that a subject was only able to lift a load corresponding to their body weight. Relative strength cut-offs were based on criteria commonly used in resistance training literature.32 The participants were stratified according to normal relative strength (i.e., 1.0-1.5, n=10) and high relative strength (i.e., >1.5, n=14). None presented poor relative strength levels (<1.0). These values are very similar to those reported in other studies involving healthy, physically active individuals.33
Physical Activity Level
The quantity of physical activity was measured with the Global Physical Activity Questionnaire (GPAQ). As suggested by the World Health Organization (WHO),34 weekly physical activity levels were assessed as i) high (≥3000 MET-minutes/week, n=12), associated with additional health benefits; ii) moderate (≥600 to <3000 MET-minutes/week, n=12), sufficient for general health benefits, with 600 MET-minutes/week corresponding to the minimum level recommended by the WHO for adults; and iii) low (<600 MET-minutes/week, n=0), not meeting the minimum recommended by the WHO, and associated with increased risk of chronic diseases.
Statistical Analyses
Statistical analyses were performed using commercial software (SPSS version 26.0, IBM Corp, Armonk, NY, USA). All variables were checked for normality using the Shapiro–Wilk test. All variables presented a normal Gaussian distribution, except for heart rate at 85% 1RM and RPE. The heart rate at 85% 1RM was transformed into a normally distributed variable,35 and the RPE was considered a non-normal variable. Results are reported as mean ± standard deviation (SD). The level of significance was set at p ≤ 0.05.
A three-way mixed ANOVA of repeated measures was used to assess the influence of each intensity (40%, 55%, 70%, 85%, and 100% 1RM), relative strength level (medium [1.0–1.5] and high [>1.5]), and physical activity level (moderate [(600 to < 3000 MET-minutes/week] and high [≥3000 MET-minutes/week]) on concurrent physiological (heart rate) and mechanical variables (weight used and repetitions performed until 10% velocity loss). A four-way mixed ANOVA of repeated measures was used to assess the influence of each intensity (40%, 55%, 70%, 85%, and 100% 1RM), repetition (first and last repetition), relative strength level (medium [1.0–1.5] and high [>1.5]), and physical activity level (moderate [(≥600 to <3000 MET-minutes/week] and high [≥3000 MET-minutes/week]) on MPV (concurrent mechanical variable). Additional pairwise comparisons were conducted using Bonferroni correction to test for differences. For the effect size analysis, partial eta squared values (ηp2) were calculated and interpreted as low (<0.04), moderate (0.04-0.13), and large (>0.13). As a reference, previous studies analyzing the concurrent validity of perceived exertion scales in resistance training with EB reported ηp2 values ranging from 0.26 to 0.45 for EMG data analyzed using a multivariate contrast (exercise*intensity), and from 0.59 to 0.81 for RPE values analyzed for the effect of intensity alone.21,22
For the non-normal variable (RPE), the Friedman test was used instead of the ANOVA. The Wilcoxon test was performed to test for differences between intensities (40%-100% 1RM) and repetitions (first repetition and last repetition [10% velocity loss]). The Mann-Whitney test was employed for between-group analyses (i.e., sex, relative strength, and physical activity level). Since the post-hoc intensity*group interaction cannot be measured with nonparametric tests, separate Wilcoxon Tests were conducted among each group (e.g., male and female or normal relative strength and high relative strength) for the RPE.
Internal consistency was assessed using the intraclass correlation coefficient (ICC), coefficient of variation (CV= [SD of observations/mean of observations] × 100), and Pearson correlations.
RESULTS
A total of 24 participants (16 men and 8 women; age: 23.5 ± 3.2 years; body mass index: 23.5 ± 2.4 kg/m2; body fat percentage: 14.1 ± 5.3%; one-repetition maximum (1RM): 102.7 ± 26.2 kg; relative strength (1RM/bodyweight ratio): 1.46 ± 0.26) completed all the required sessions.
All the concurrent variables, including the RPE, significantly varied among the different percentages of 1RM (from 40% to 100% 1RM) (RPE: χ2= 185.73, p< 0.001; Z ranging from -3.067 to -4.332, p= 0.001; number of repetitions: F= 157.95, p< 0.001, ηp2= 0.90; weight used: F= 482.64, p< 0.001, ηp2= 0.97, MPV: F= 371.36, p< 0.001, ηp2= 0.96; heart rate: F= 19.10, p< 0.001, ηp2= 0.53).
The level of physical activity (intensity*physical activity level) did not influence the analyzed parameters (RPE: U ranged from 53.500 to 70.500, p= 0.264-0.909; number of repetitions: p= 0.470; weight used: p= 0.840, MPV: p= 0.097; heart rate: p= 0.249).
On the other hand, the relative strength (intensity*relative strength) significantly influenced the weight (F= 10.99, p= 0.001, np2= 0.39) and MPV (F= 8.84, p< 0.001; np2= 0.34), but not the number of repetitions (p= 0.120) or heart rate (p= 0.405). There were only significant differences in the RPE of the first repetition between participants with normal and high relative strength at 55%, 85%, and 100% 1RM.
The sex (intensity*sex) showed an influence on the weight lifted (F= 4.36, p= 0.034, ηp2= 0.20) and heart rate (F= 4.53, p= 0.011, ηp2= 0.21), but not in the number of repetitions performed (p= 0.249), MPV (p=0.173) and RPE (U= 37.00-63.00, p= 0.064-0.935).
Finally, the reduction in the MPV from the first to the last repetition (intensity*repetition: F= 60.26, p< 0.001, ηp2= 0.78) was significantly influenced by the relative strength of the participants (intensity*repetition*relative strength: F= 3.83, p= 0.023, ηp2= 0.18). However, this did not happen vary with the sex (intensity*repetition*sex: p= 0.589) and physical activity level (intensity*repetition*physical activity: p= 0.391). Tables 1, 2, and 3 present the descriptive and post-hoc inferential results for each dependent variable.
Internal consistency analysis of all measured variables across the two sessions showed good to excellent relative reliability (ICC > 0.75),36 and acceptable absolute reliability (CV< 30%).37 Furthermore, a moderate to very strong relationship was observed between concurrent mechanical and physiological variables and RPE (Table 4). All parameters showed significant reliability (p< 0.001).
DISCUSSION
The present study aimed to validate the application of the OMNI-RES-EB to monitor intensity during velocity-based training (VBT) with EB. This is the first study to corroborate the application of RPE from the first repetition of a set to monitor the practical implementation during VBT with EB. Additionally, the reliability of the RPE and the potential influence that the sex, physical activity level, and relative strength of the participants may have on the perceived effort was assessed. A robust relationship between the mechanical (i.e., MPV), physiological (i.e., heart rate), and perceptual (i.e., OMNI-RES-EB score) variables was encountered, which confirms the main hypothesis. These results indicate that RPE is an easy-to-use tool for VBT when access to devices such as encoders or linear velocity transducers is limited.
Concurrent Validation and Reliability of the Application of the OMNI-RES EB during Velocity-based Training (VBT) with Elastic Bands (EB)
Supporting the stated hypothesis, the RPE and mechanical concurrent variables elicited significant differences at each load (40%-100% 1RM), yielding even higher ηp2 values than those reported in previous concurrent validity studies of resistance training with EB,21,22 where the RPE was analyzed based on the last repetition of each set. The main implications for this finding, considering the large effect sizes, are that participants reported largely different values of the first-repetition RPE for each % 1RM, reinforcing the RPE construct validity. Despite not showing significant differences in heart rate between intensities, probably due to the short duration,38 the RPE is a sensitive tool to infer differences between intensities, as is the case of linear velocity transducers.1 Furthermore, the internal consistency analysis and the high correlation between the RPE and MPV in the first repetition show that the RPE is a valid and reliable method to prescribe the load with only one repetition. In this regard, the greater the load used, the greater the RPE (and the lower the MPV) (Table 4).
Physical Activity Level
This analysis did not show significant differences when the physical activity level was considered for either the RPE or other concurrent variables. This is consistent with the results of other studies that used the ACSM recommendations39 or training experience (i.e., >6 months of resistance training)40 to classify subjects according to their physical activity levels. Although there were differences in the number of repetitions performed by the more experienced participants (>2 years) and their lesser counterparts41 at a given RPE in the first repetition, a recent meta-analysis showed no significant differences regarding the resistance training level.42 In the current research, the questionnaire employed to assess the physical activity level (GPAQ) is considered a limitation since it measures the MET-minutes during a week, which can be obtained with activities different from resistance training.
Sex
The MPV (at 40% and 85% 1RM) and load (at all intensities) showed significant differences between the sexes, while RPE did not. These data reinforce the idea that perceptual parameters are not influenced by sex,42 unlike what happens with mechanical variables (i.e., MPV and load). Although there were no significant differences, females achieved a lower RPE for the same load than males, and more repetitions at low intensities (17.63±4.41 vs 16.81±3.27 [40% 1RM]). This ability of women to perform more repetitions when fatigue appears has been widely studied in both aerobic and resistance training.43,44
Relative Strength
Like MPV, RPE was also a sensitive tool for subjects with normal and high relative strength (i.e., there were differences between each intensity). Consistent with the findings of other studies,41 the higher the relative strength in resistance training, the fewer repetitions performed. In the current study, significant differences in 55% and 70% 1RM in the number of repetitions performed until 10% velocity loss between subjects with normal relative strength and their higher counterparts were observed. In contrast, Hernández-Belmonte et al.33 did not find significant differences in repetitions when performed until volitional failure between subjects with different relative strength ratios. Interestingly, Table 2 shows significant differences in the RPE at 55%, 85%, and 100% 1RM when the relative strength was considered. In this regard, subjects with higher relative strength presented lower RPEs at the first and last repetition (approximately at 10% velocity loss). Thus, relative strength appears to influence the RPE values of the first repetition, suggesting that the RPE should be applied differently according to the participant’s strength level. However, long-term resistance training interventions considering relative strength are needed to determine the number of familiarization sessions needed for each type of participant.
Beyond group comparisons, the practical value of using the first-repetition RPE deserves further consideration. The use of the first-repetition RPE offers a practical and time-efficient alternative for prescribing and adjusting training loads, particularly in settings where traditional 1RM testing or velocity-based monitoring devices are not feasible, e.g., training with elastic bands. While estimating 1RM can improve load selection, it requires structured testing and does not allow for real-time adaptations during training sessions. This is especially valuable when using EB, where the actual external load is difficult to quantify due to variable resistance across the range of motion. Although the first-repetition RPE may be slightly less precise than technological tools, it represents a low-cost and accessible method that supports individualized load prescription without requiring additional equipment or extensive testing protocols. The first-repetition RPE enables immediate adjustment of load at the beginning of each set, minimizing unnecessary fatigue and improving session efficiency compared to the last-repetition RPE. However, future studies should evaluate whether these specific features of the first-repetition compared to last-repetition RPE translate into better adaptations.
This study has some limitations. (i) The 1RM was calculated through an indirect test using weight plates to load the bar and the study sets were performed using the same load achieved with EB in the standing position; (ii) there was a small sample size, with half as many women as men. Therefore, the results obtained from the subgroup analyses must be interpreted with caution, as the sample size was further reduced within each subgroup; and (iii) although previous studies with similar characteristics have also employed only one exercise,45,46 future studies may consider validating the OMNI-RES EB during VBT using different types of exercises and other participant profiles such as older adults. Although participants were instructed to not look at the bar before performing and, therefore, could not see the actual weight to use, and they listened to music with headphones to avoid getting audible information from the researchers, it was impossible to fully conceal from the participants the band tension on their shoulders while they first held the bar before performing. Therefore, a potential influence of placebo expectations47 on the RPE, even in trained individuals, cannot be ruled out.
CONCLUSION
The RPE of the first repetition is a relevant and reliable parameter that can be used in VBT with EB in a similar way to linear velocity transducers. Once adjusting for the relative strength (regardless of physical activity level and sex) of the subject, the training load for VBT with EB can be prescribed using the RPE of the first repetition.
Acknowledgements
The authors would like to acknowledge all the participants and the research assistants supporting the data collection. Specifically, we would like to thank Víctor Llorca for his help during data collection.