
INTRODUCTION
Soccer is one of the most popular sports worldwide, with more than 260 million soccer players as of 2006.1 Of the 38 million players registered with national soccer associations and federations, 21 million are under the age of 18; additionally, many children and adolescents play soccer.1 Soccer is a high-intensity sport that requires sprinting, high-speed running, cutting, and jumping,2,3 and has a high risk of injury.4 A recent systematic review revealed that the injury incidence in adolescent soccer players is higher than that in adults, at 2.5–9.0/1,000 h in adults and 2.0–19.4/1,000 h in adolescents.5 To reduce the injury risk in adolescent soccer players, the adolescent characteristics associated with injury occurrence need to be clarified.
Adolescents undergo significant physical and biological changes.6 During adolescence, peak height velocity (PHV) occurs when height increases by 8–10 cm/year7,8 and coordination skills and movement patterns can be affected.9,10 The timing and tempo of growth vary among individuals, with the reported age at PHV ranging between 10–17 years for boys and between 9–14 years for girls.6,11 Thus, chronological age has limited utility in assessing maturity.12 In a previous study, sex-specific equations were developed using anthropometric measurements to predict the age at which PHV occurs.12 These equations can be used to determine the maturity offset, which represents the difference between the chronological age at the time of measurement and the predicted age at the PHV. To reduce the injury risk in adolescent soccer players, the adolescent characteristics associated with injury occurrence need to be clarified. When maturity offset is used in adolescent soccer players, greater injury incidences have been reported around the age of PHV, compared with pre-PHV13 or adolescence (12–19 years).14 The PHV status may have important implications for injury prevention.15
Jump tasks are frequently performed in soccer3 and are often used as screening tests for high-risk landing profiles,16,17 with the drop vertical jump (DVJ) being one of the most commonly used screening tools.16,18 For the DVJ, the participants dropped off the box and immediately perform a maximal vertical jump, and the landing mechanics were analyzed.17,19 Increases in jump-landing forces during the DVJ task are associated with a high risk of lower-limb injury.18,20 However, in adolescent soccer players, the effects of maturity status on jump-landing force remain unclear. Peak vertical ground reaction forces (PVGRFs) have been reported to be greater at pre-PHV than at circa-PHV, which refers to the period around the time of an adolescent’s fastest rate of growth in height, or post-PHV with single-leg hopping.21 Conversely, it has been reported that the PVGRF is greater in the circa-PHV group than in the post-PHV group, and no significant differences were observed between the pre- and circa-PHV groups in single-leg countermovement jumps.22 Hence, the relationship between maturity status and jump landing force during DVJ in adolescent soccer players has not been clarified.
Jump performance, such as jump height and hop distance, in adolescent soccer players has been shown to gradually increase from pre-PHV to post-PHV.21,22 Few studies have compared jump performances at different maturity stages21,22; therefore, the relationship between maturity status and jump performance remains unclear. In addition, jump performance indicators such as the reactive strength index (RSI) have been reported to have a strong relationship with agility23 and to be a better measurement of jump performance outcomes than height24; however, they have not been well investigated. Thus, understanding the relationship among maturity status, landing force, and jump performance in adolescent soccer players is important for maturity-based injury prevention and training guidance. Furthermore, whether both classification methods, classification by maturity offset and classification by chronological age, can be used to classify adolescents based on their maturity status remains unclear. Implicating that only classification by maturity offset detects differences in landing force and jump performance during DVJ in different maturity groups may lead to suggestions for accurate classification methods for adolescents where individual differences exist.
Therefore, the purpose of this study was to compare landing force and jump performance during DVJ in adolescent male soccer players based on classifications by maturity status and age. A hypothesis was formulated that landing forces would be higher in the circa-PHV group than in the pre-PHV and post-PHV groups and that jump performance outcomes would improve in the order of pre-PHV, circa-PHV, and post-PHV. It was also hypothesized that classification by maturity offset would detect differences in landing force and jump performance outcomes during DVJ in different maturity groups, but not by classification by chronological age.
METHODS
Participants
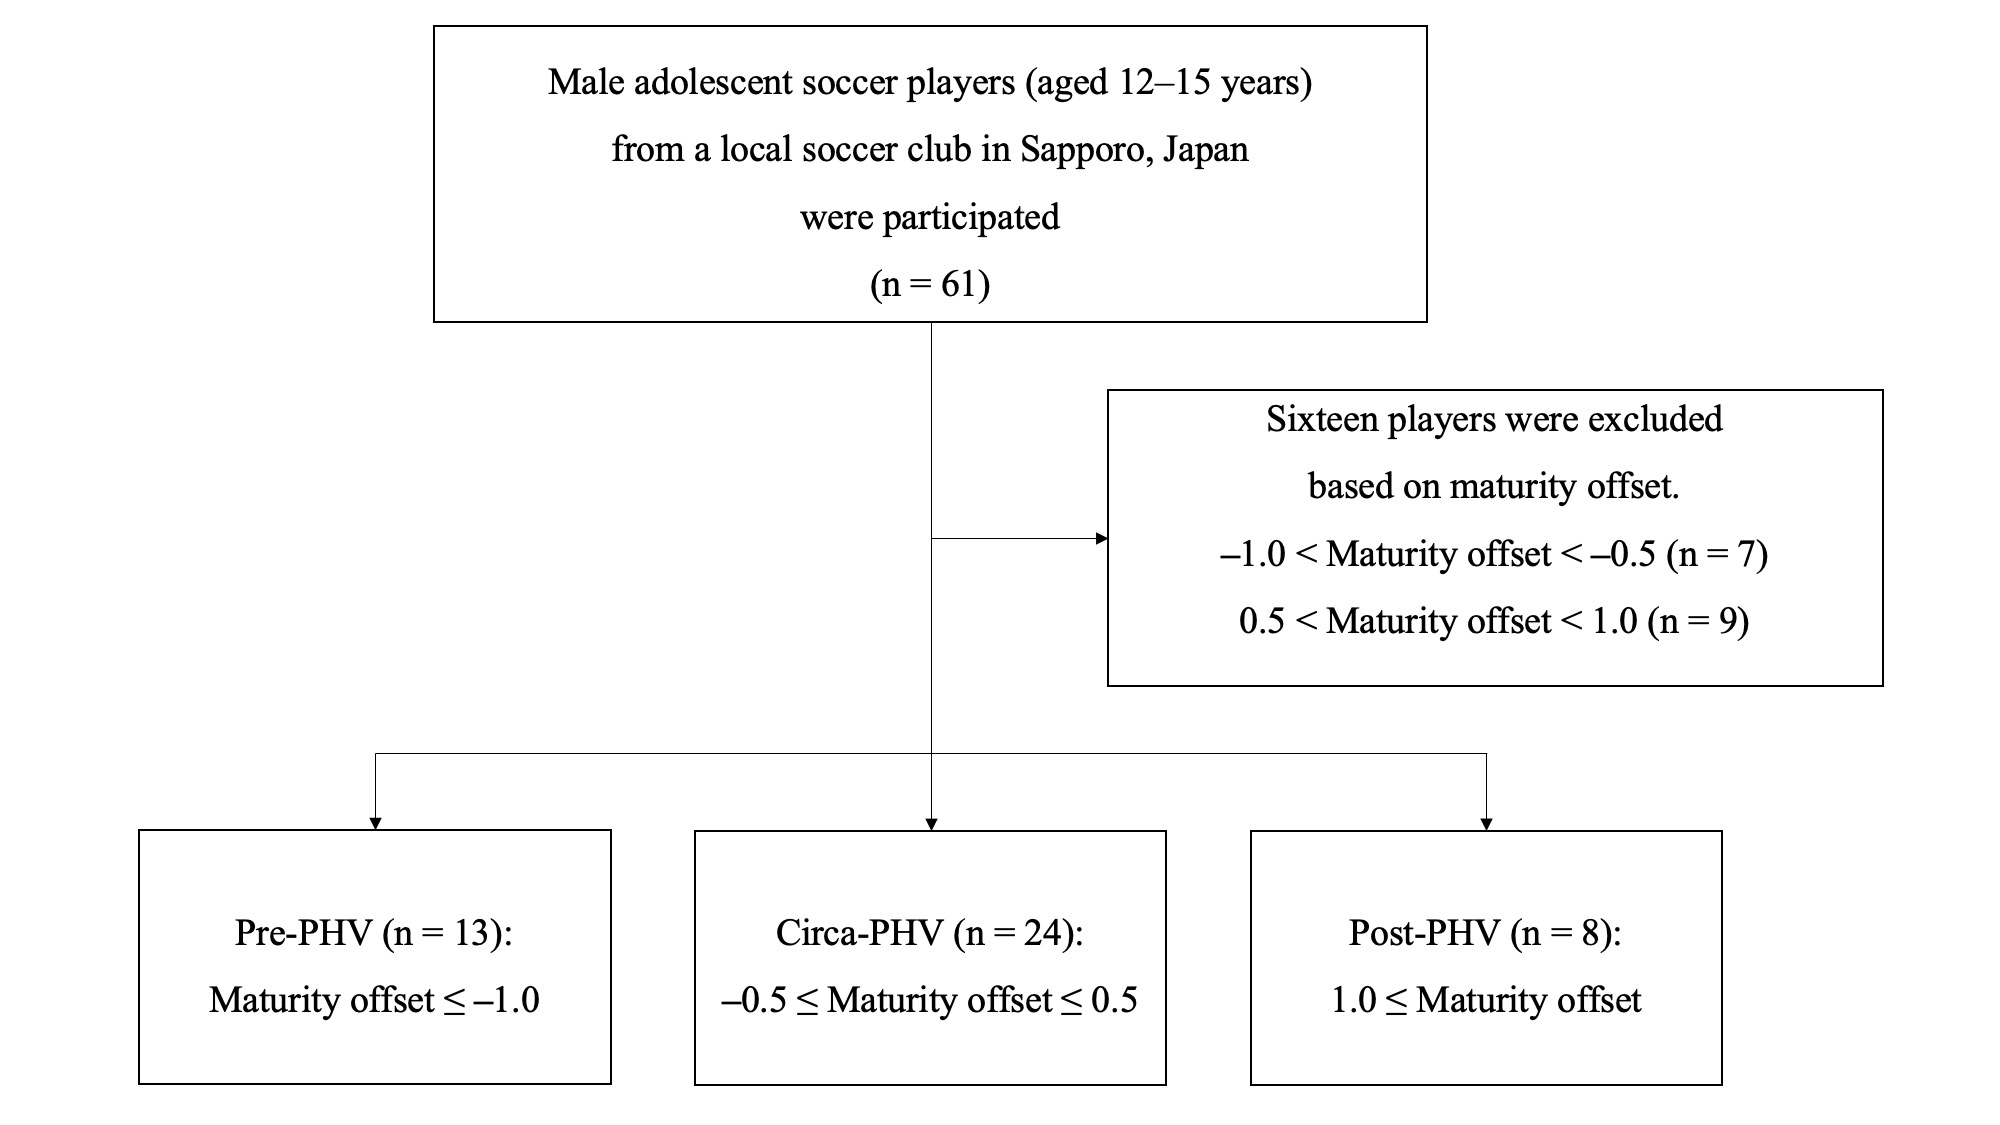
Sixty-one male adolescent soccer players belonging to a local soccer club in Sapporo, Japan were recruited to participate in this study. Sample size was calculated a priori using the G*Power software version 3. 1. 9. 7 (University of Kiel, Kiel, Germany) with an alpha level of 0.05, a beta level of 0.8, and an effect size of 0.56 based on data from a previous study25 that showed differences in the PVGRF, indicating that 36 participants were required. The inclusion criteria were male adolescent soccer players aged 12–15 years from a local soccer club in Sapporo, Japan. The exclusion criteria were any history of lower limb surgery,26 any current lower limb injuries,27 or inconsistent participation in the team practices and/or games due to musculoskeletal injury.28
All procedures were performed in accordance with the ethical standards of the Institutional Research Committee and the guidelines of 1964 Helsinki Declaration and its later amendments. This study was approved by the local institutional ethics committee (approval number: 20-64), and participants’ assent and parental consent were obtained before the study.
Classification by maturity offset and chronological age
The participants’ height and sitting height were measured barefoot using a stadiometer.29 Sitting height was defined as the distance from a flat sitting surface to the top of the head at a height of 40 cm.29 Body mass and lean body mass were measured using a digital scale with the participants barefoot and wearing light clothing.30 These anthropometric measurements were recorded the to the nearest 0.1 cm or 0.1 kg.12 Leg length was estimated by subtracting sitting height from height, as described in previous studies.29,31–33 The participants were divided into three groups based on the maturity offset, which was determined and predicted by age at PHV and calculated from age, height, body mass, sitting height, and leg length using the following equation12:
Maturity offset = –9.236 + 0.0002708 (× (leg length × sitting height))
+ (–0.001663 × (age × leg length)) + (0.007216 × (age × sitting height))
+ (0.02292 × (body mass/height × 100))
Maturity groups were divided into pre-PHV (maturity offset ≤ –1.0), circa-PHV (–0.5 ≤ maturity offset ≤ 0.5) and post-PHV groups (1.0 ≤ maturity offset).21,22 Of the 61 participants, seven with –1.0 < maturity offset < –0.5 and nine with 0.5 < maturity offset < 1.0 were excluded because the equation used to calculate maturity offset has a standard error of approximately ± 0.5 years.12 Therefore, these values may fall within a margin of error that makes classification uncertain. A flowchart summarizing participant inclusion and exclusion is presented in Figure 1. Thus, 45 participants were ultimately included for further analyses (age 13.5 ± 0.9 years, height 161.1 ± 9.0 cm, body mass 50.3 ± 8.7 kg). The chronological age classification was based on the participant’s age in months. Participants were divided into the three following groups: younger (n = 15, age = 12.7 ± 0.6 years), middle (n = 15, age = 13.4 ± 0.5 years), and older (n = 15, age = 14.5 ± 0.6 years).

DVJ measurement
Prior to DVJ measurement, the participants were instructed to run for five minutes at a comfortable speed as a warm-up activity.34 Participants stood on top of a 30-cm box to start the DVJ test20,35 and kept their hands at ear level during the DVJ test.36 The oral instruction for DVJ was as follows: drop off the box without jumping up and then jump as high as possible.36 To get familiar with the DVJ task, participants were allowed to practice as much as they wanted.35 The ground reaction force data were measured using a force plate (Ex-Jumper, DKH Co., Ltd., Japan), and the ground reaction forces were collected at a sampling rate of 1,000 Hz. Three successful trials were collected, and an average of the three trials was used for the statistical analysis.35,36
Data analysis
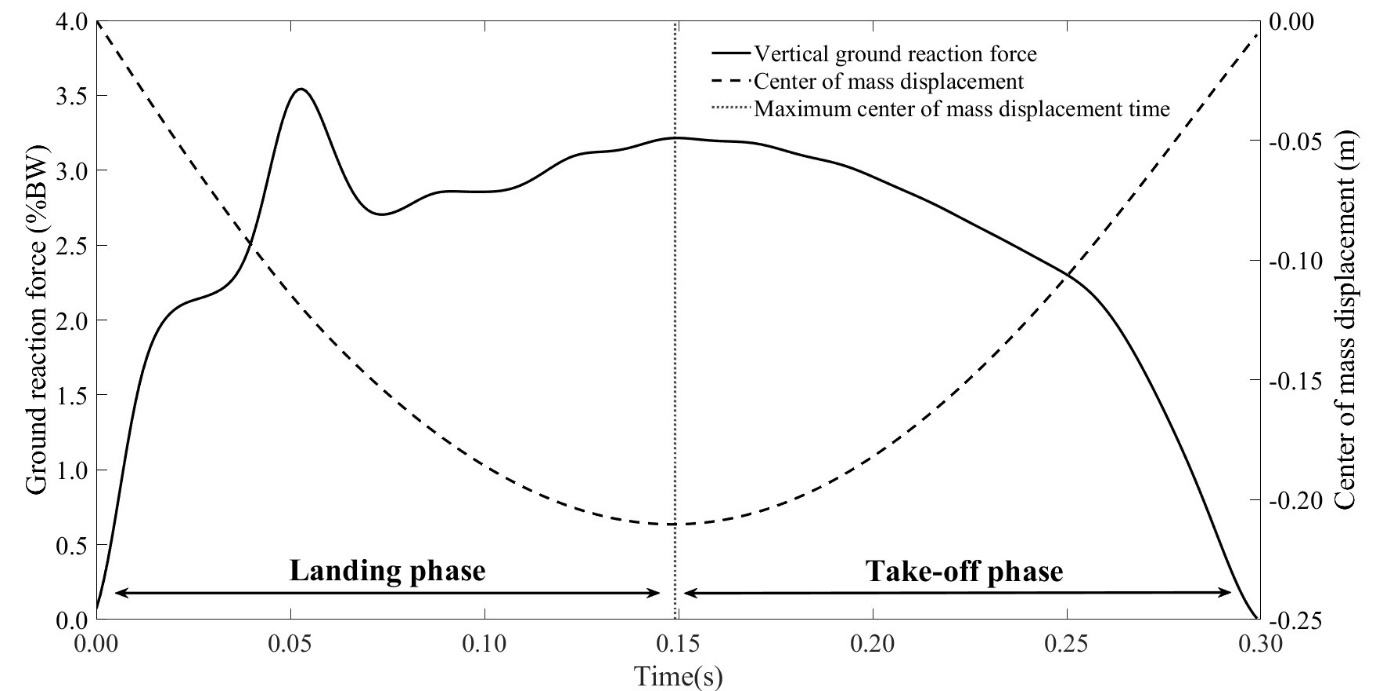
The ground reaction force data were filtered using a low-pass fourth-order Butterworth filter with a cut-off frequency of 50 Hz and were obtained from the initial contact to toe-off. Initial contact was defined as the point at which the vertical ground reaction force exceeded 15 N, and toe-off was the point at which the vertical ground reaction force fell below 15 N.35 The acceleration of the center of mass (COM) from initial contact to toe-off was calculated by dividing the vertical ground reaction force by the body mass based on Newton’s equation of motion (ma = F). Subsequently, the COM displacement from the initial contact to toe-off was calculated by double integration of the acceleration of the COM.17,35 The ground reaction force data were divided into two phases based on the maximum COM displacement (Figure 2), which was defined as the time from the point of initial contact to the maximum COM displacement, and the take-off phase was defined as the time from the maximum COM displacement to toe-off.17
The landing force outcomes were the PVGRF, time to PVGRF, and loading rate during the landing phase.17,37,38 The time to PVGRF was defined as the time from initial contact to PVGRF.37 The loading rate was calculated by dividing the PVGRF by the PVGRF time.38 Jump height, contact time, RSI, PVGRF, and power during the take-off phase were the jump performance outcomes.17,39 Jump height was calculated based on flight time,17 and contact time was defined as the time from initial contact to toe-off.35 The RSI was calculated by dividing the jump height by the contact time,17 and power was calculated by dividing the work in the take-off phase by the time in the take-off phase.39
Statistical analysis
The assumption of normality of all data was checked using the Shapiro–Wilk test. A one-way analysis of variance or Kruskal–Wallis test was performed to determine the existence among the group differences for all outcome measures, and post hoc analyses were performed using the Bonferroni test. Cohen’s d effect size was calculated by dividing the difference in means between groups by the pooled standard deviation to assess the magnitude of the group differences. Effect sizes were classified into six categories based on the absolute value of Cohen’s d: trivial (d < 0.20), small (d = 0.20–0.59), moderate (d = 0.60–1.19), large (d = 1.20–1.99), very large (d = 2.00–3.99), and extremity large (d ≥ 4.00).40 Statistical analyses were performed using SPSS software version 26 (IBM Corp., Armonk, N.Y., USA). The significance level was set at an alpha level of p < 0.05.
RESULTS
Anthropometric data of the participants are presented in Table 1, which showed significant differences among the groups in terms of age, height, body mass, BMI, lean body mass, and maturity offset.
Regarding landing force outcomes, no significant differences were noted in the PVGRF (p = 0.190), time to PVGRF (p = 0.122), and loading rate (p = 0.255) during the landing phase among the maturity offset groups (Table 2). However, for jump performance outcomes, jump height was significantly higher in the post-PHV group (32.87 ± 4.18cm) than in the pre-PHV group (25.17 ± 4.85 cm, p = 0.001, d = 1.75). RSI was higher in the post-PHV group (1.33 ± 0.31 m/s) than in the circa-PHV (1.02 ± 0.23 m/s, p = 0.021, d = −0.49) and pre-PHV groups (1.00 ± 0.29 m/s, p = 0.024, d = 1.16). Power was also significantly higher in the post-PHV group (40.40 ± 6.31 W/kg) than in the circa-PHV (33.59 ± 5.50 W/kg, p = 0.037, d = 1.23) and pre-PHV groups (33.15 ± 7.78 W/kg, p = 0.045, d = 1.04). There were no significant differences in PVGRF (p = 0.199) during the take-off phase or contact time (p = 0.433) among the groups.
A significant difference was observed in jump height, with the older group having significantly higher values (31.74 ± 3.36cm) than the younger group (24.97 ± 4.81cm, p < 0.001, d = 1.63) (Table 3). However, there were no significant differences among the groups in terms of landing force and performance outcomes other than jump height (p = 0.227–0.683).
DISCUSSION
This study aimed to compare the landing force and jump performance in the DVJ among adolescents in terms of maturity offset and chronological age. The main findings were that landing force outcomes (PVGRF, time to PVGRF, and loading rate) were not significantly different among the different maturity groups; however, jump performance outcomes (jump height, RSI, and power) were significantly higher in the post-PHV group. Furthermore, classification by maturity offset detected more differences in jump performance outcomes than classification by age.
No significant differences were found in PVGRF, time to PVGRF, or loading rate as landing force outcomes among the different maturity groups. A previous study showed a greater PVGRF in the circa-PHV group than in the post-PHV group during landing after a single-leg countermovement jump in adolescent soccer players.22 The authors suggested that a rapid increase in height in the circa-PHV group affected the shock absorption landing force. However, this previous study utilized a single-leg landing task, which requires a higher level of shock absorption capacity and results in greater ground reaction force compared to double-leg landing.41 Furthermore, previous studies have compared PVGRF during landings from different heights across maturity groups,21,22 whereas the PVGRF for landing was compared at the same height of 30 cm in the present study. Given these methodological differences in jump tasks and height, direct comparisons should be interpreted with caution, which may partly explain the discrepancy in the findings. Further research using comparable DVJ protocols is warranted to better clarify the relationship between landing mechanics and maturity status.
The jump height was higher in the post-PHV group than in the pre-PHV group, which is consistent with the findings of previous studies reporting that jump height increases with maturation22,42 and supports the hypothesis of this study. In addition, RSI and power were significantly higher in the post-PHV group than in the pre-PHV and circa-PHV groups. As this is the first study to compare the RSI and power in the DVJ among different maturity groups, no direct comparison with previous studies were possible. The RSI was calculated by dividing jump height by contact time.24 Therefore, the pre-PHV group with a lower jump height showed a lower RSI than did the post-PHV group. However, the circa-PHV group, which did not differ in jump height from the post-PHV group, exhibited significantly lower RSI values than did the post-PHV group. At the age of the PHV, the rate of bone growth is faster than that of muscle growth43 and a rapid increase in height affects coordination and movement patterns.9,10 The remarkable physical changes in the circa-PHV group may have affected RSI in the DVJ. This finding supports the hypothesis that growth-related disruptions in musculoskeletal coordination and neuromuscular timing, which often described as ‘adolescent awkwardness’,44 may have affected movement patterns of circa-PHV group. Furthermore, a previous study reported a moderately positive relationship between power and RSI during jump tasks,24 while in the present study, a strong positive correlation was observed (r = 0.946, p < 0.001). Therefore, the RSI and power were higher in the post-PHV group than in the pre-PHV and circa-PHV groups. The PVGRF during the take-off phase or contact time of the DVJ did not significantly differ among the groups, which is similar to the results of a previous study.35
In the maturity offset classification, significant differences were noted in jump height, RSI, and power. However, in the chronological age classification, the only significant difference was in jump height. Maturity offset is an outcome of the difference between the age at measurement and the predicted age at PHV.12 The timing and tempo of PHV vary greatly among individuals, and the age at PHV in boys is 10–17 years.6 Therefore, chronological age is limited in its assessment of age at PHV12; hence, the maturity offset can reflect the characteristics of age at PHV. Thus, maturity offset may be considered a useful indicator for classifying adolescents based on maturity status rather than chronological age.
This study has some limitations. First, it utilized a cross-sectional design; therefore, additional longitudinal studies are required to clarify the effects of rapid height increase with age at PHV. Second, the sample size of the post-PHV group was relatively small (n = 8). Although the total required sample size (n = 36) was met based on power analysis, the imbalance in participant distribution across maturity groups, such as pre-PHV (n = 13), circa-PHV (n = 24), and post-PHV (n = 8), may have influenced the results. Third, kinematic measurements were not performed in this study. To determine differences in movement patterns, a multidimensional assessment using three-dimensional motion analysis, surface electromyography, and a force plate is necessary. Finally, the regression equation used to calculate the maturity offset was created based on the morphological data of European children12; however, it has been reported that the age at PHV appears to be one to two years earlier in Japanese children than in Europeans.45 Therefore, it remains unclear whether the regression equation used in this study is applicable to Japanese adolescents.
The findings of this study have practical implications for sports physical therapists working with young athletes, particularly when considering training strategies based on differences in jump performance across maturity groups. Pre-PHV athletes exhibited lower jump heights, suggesting the need to focus on developing fundamental movement skills during this stage of heightened neuroplasticity.46 In circa-PHV athletes, a lower RSI suggests reduced neuromuscular efficiency due to growth-related disruptions in coordination and timing, although jump height was comparable to that of post-PHV athletes.44 Thus, training in circa-PHV athletes should aim to reduce ground contact time and improve neuromuscular function. Post-PHV athletes demonstrated the highest performance metrics and may be effective with advanced plyometric and power-based training.46 Therefore, maturity-based classification for young athletes suggests appropriate and effective interventions and provides a practical framework for applying these findings in both clinical and sports settings to enhance performance and reduce injury risk.
CONCLUSIONS
Landing force outcomes, such as PVGRF, time to PVGRF, and loading rate, were not significantly different among the maturity groups. However, jump height, RSI, and power, which are jump performance outcomes, differed significantly among the three groups classified by maturity offset. Jump height was significantly higher in the post-PHV group than in the pre-PHV group, and RSI and power were significantly higher in the post-PHV group than in the pre- and circa-PHV groups. In the chronological age comparison, the only significant difference was in jump height, with the older group exhibiting higher values than the younger group. These results suggest that maturity status may not be associated with landing force but with jump performance in male adolescent soccer players. Classification by maturity offset rather than by age revealed that maturity status may be related to jump height and reactive strength index and power.
Acknowledgement
The authors thank everyone who contributed to this study. The experiments complied with the current laws of the countries where they were conducted.
Disclosure statement
The authors have no conflicts of interest to declare.