Introduction
The development of eccentric hamstring strength (EHS) within elite footballers (soccer players) has been well documented as a vaccine for reducing injury risk.1,2 Importantly, within literature and practice there has been movement away from the notion of strength preventing injury, and although risk is reduced, injury can still occur due to other etiological factors.3,4 Understanding how strength profiles of footballers effect the extent, or the location of injury sustained is not well understood.
Literature highlights the benefits of eccentric hamstring strengthening, with current work highlighting the need to integrate the Nordic hamstring exercise as part of injury prevention approaches in team sports.3,5–8 Specifically, across all levels of football (soccer) where Nordics are regularly integrated within training programming, hamstring injury occurrence has reduced.7 This has led to practitioners utilizing Nordic hamstrings strength as a key marker in their readiness testing9 prompting discussions with regards to player management and potentially training prescription/game availability based on hamstring status gathered from the specific test. Interestingly, Opar et al.9 highlight that athlete’s pre-season eccentric hamstring strength status did not correlate with resultant hamstring injury. When discussing any literature associated with hamstring strength profiling and injury, practitioner context is key. In this systematic review and meta-analysis,9 there was no exploration of follow-up testing data utilized, thus the review was unable to identify whether any changes in the strength status of the hamstrings occurred, which has been identified as a key aetiological factor related to injury.4,10
Key metrics often utilized in practice and referred to throughout literature to quantify eccentric hamstring strength are peak force (PF), average force (AF), asymmetry and relative strength (RS).9,11,12 It is important for practitioners to understand the reliability of these individual metrics and context to their meaning.12 Literature cites PF as the most reliable and widely utilized metric within studies utilizing the Nordbord,12,13 with other metrics such as PT, AvF and average torques (AvT) demonstrating reduced reliability.12 Ascertaining this value during the Nordic assessment requires the athlete to lower their body gradually to the ground, while pulling through the ankle braces.9 With the point of PF being defined prior to the athlete no longer being able to hold their bodyweight while lowering, or alternatively at the point where the most force is required to hold the athlete when lowering. The Nordic exercise protocol has been shown to result in increases in strength and muscle architectural adaptation.14 Although, changes specifically to tendon strength and integrity are not well described, evidence details that white tissue within tendons takes longer to adapt to training exposure.15 Hamstring tendons, like all muscle tendons, amortize and transmit the force of the muscular contraction.16 Consequently, this raises the question that if the Nordic hamstring exercise predominantly increases muscular force with limited effect on tendon strength, would this make a stronger athlete more vulnerable to a tendon related injury? Importantly, literature describes that the eccentric strength of an athlete decreases up to 30% during game play,4,10 although the forces experienced remain consistent. With the capacity of the muscle being reduced and the forces muscle can absorb becoming less, this potentially places more demand on the tendon. Exposure to a greater force, therefore, could be the potential cause of increased injury severity. Thus, there appears to be a heightened need to monitor fatigue related strength changes in players. If a player sustains a tendon injury, it often signifies a greater time out due to injury, because of the slower healing rates associated with tendon injuries.16 Potentially resulting in an effect on the performance of the team17 and escalating further cost implications to the club.
With practitioners placing greater emphasis on readiness testing to provide insight into the physical status of players in preparation for training and competition,18 understanding the influence muscle strength has on injury type and extent may provide insight into development of conditioning protocols to help mitigate injury risk.18–20 Metrics utilized to quantify eccentric hamstring function are well established and provide an overview of the muscle status.4,9,10,21 Therefore, the purpose of this study was to investigate the effect of eccentric hamstrings strength (EHS), on the resultant injury sustained, graded utilizing the British Athletic Muscle Injury Classification, diagnosed via MRI.22,23
Methods
Participants
Ninety-five elite male professional footballers across the English Premier League, Championship, League 1 and the Scottish Premier League from seasons 2022-2023 and 2023-2024 were included, (age 23.2±3.39 years, height 180.40±7.93 cm, weight 81.09±5.75 kg). Only non-contact injuries sustained by players were included within the present study. Players were eligible to take part in the study if they were in full training, free from injury and available for competitive selection at the time of eccentric hamstring strength testing. All participants provided written informed consent for retrosp1ective use of their eccentric hamstring strength data pre-injury and subsequent injury diagnosis. All consent and utilization of data was in accordance with department and faculty research ethics committees (STEMH), and in accordance with the Helsinki Declaration (2013).
Experimental Design
The NordBord (Vald Performance, Newstead, Queensland, Australia) was utilized for the assessment of each player’s EHS. All players were familiar with the NordBord testing, as it formulated part of their weekly readiness to train assessment, which was completed on match day -2 (MD-2) and match day +2 (MD+2). Prior to any readiness testing all participants completed a standardised warm up, which included, 10 minutes cycling at submaximal intensity, followed by directed dynamic stretching focussed on the quadriceps, hamstrings, gluteals, and gastrocnemius. All testing was completed between 10am and 12pm, accounting for the effect of circadian rhythm.21
Reliability of the Nordbord has been previously described within contemporary literature.8,9,12 The protocol requires players to kneel on a padded board, with the ankles secured immediately superior to the lateral malleolus by individual ankle braces that were attached to custom made uniaxial load cells (Delphi Force Measurement, Gold Coast, Australia) with wireless data acquisition capabilities (Mantracourt, Devon, UK). Following the standardised warm up, previously described, participants completed one set of three maximal repetitions of the bilateral Nordic hamstring exercises. Instructions to each of the players were to gradually lean forward at the slowest possible speed while maximally resisting this movement with both limbs while holding the trunk and hips in a neutral position throughout and the hands held across the chest. Participants were widely exhorted to provide maximal effort throughout each repetition. A trial was deemed acceptable when the force output reached a distinct peak (indicative of maximal eccentric strength), followed by a rapid decline in force when the participant was no longer able to resist the effects of gravity acting on the segment above the knee joint.11,24
The eccentric hamstring strength profile was identified in relation to the date the injury was sustained and collated retrospectively. Due to the timing of the readiness testing events throughout the season, all eccentric hamstring muscle testing was completed within 48 hours of sustaining the injury. Once the injury had been sustained the eccentric hamstring strength profile was extrapolated from the online platform Vald Hub (Vald Performance, Human Measurement Technologies, Newstead, Queensland, Australia). Metrics utilised for analysis included Peak Force (PF), Peak Torque (PkT), Average Force (AvF), Average Torque (AvT), Maximum Impulse (MI), Impulse Symmetry (IS), PF symmetry (PFS) and PkT symmetry (PkTS). In addition, the relative strength (RS) of each player was profiled utilizing the following equation: body weight (kg)/combined force (left limb PF + right limb PF). All injuries identified for analysis were diagnosed via MRI and graded utilizing BAMIC.22,23 Severity of injury is graded from 0 to 4 with location identified with a, b or c (a = myofascial, b = musculo-tendinous and c = intra-tendinous).
Data & Statistical Analysis
A univariate repeated measures general linear model quantified main effects of grade of injury, level of player and muscle injured on bilateral eccentric hamstrings strength parameters of PF, PkT, AvF, AvT, MI, IS, PFS, PkTS and RS. The assumptions associated with the statistical model were assessed to ensure model adequacy. To assess residual normality for each dependant variable, q-q plots were generated using stacked standardized residuals. Scatterplots of the stacked unstandardized and standardized residuals were utilized to assess the error of variance associated with the residuals. Mauchly’s test of sphericity was completed for all dependent variables, with a Greenhouse Geisser correction applied if the test was significant. Partial eta squared (η2) values were calculated to estimate effect sizes for all significant main effects and interactions. As recommended by Cohen,25 partial eta squared was classified as small (0.01–0.059), moderate (0.06-0.137), and large (>0.138). All statistical analyses were completed using PASW Statistics Editor 29.0 for Windows (SPSS Inc, Chicago, USA). Statistical significance was set at p ≤ 0.05, and all data are presented as mean ± standard deviation.
Results
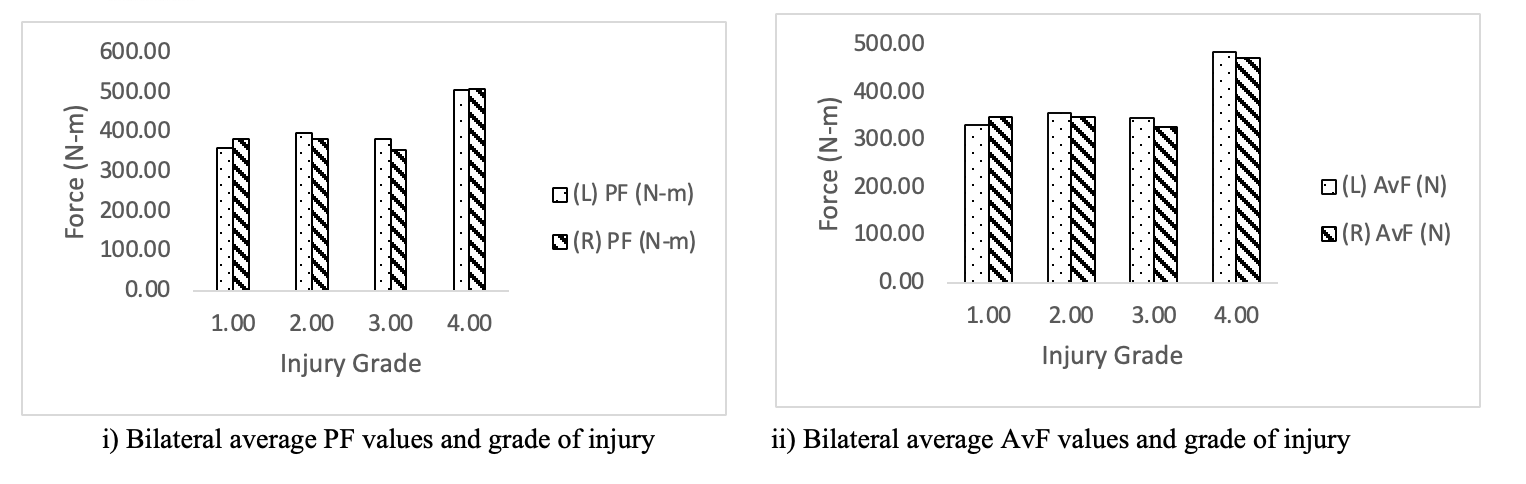
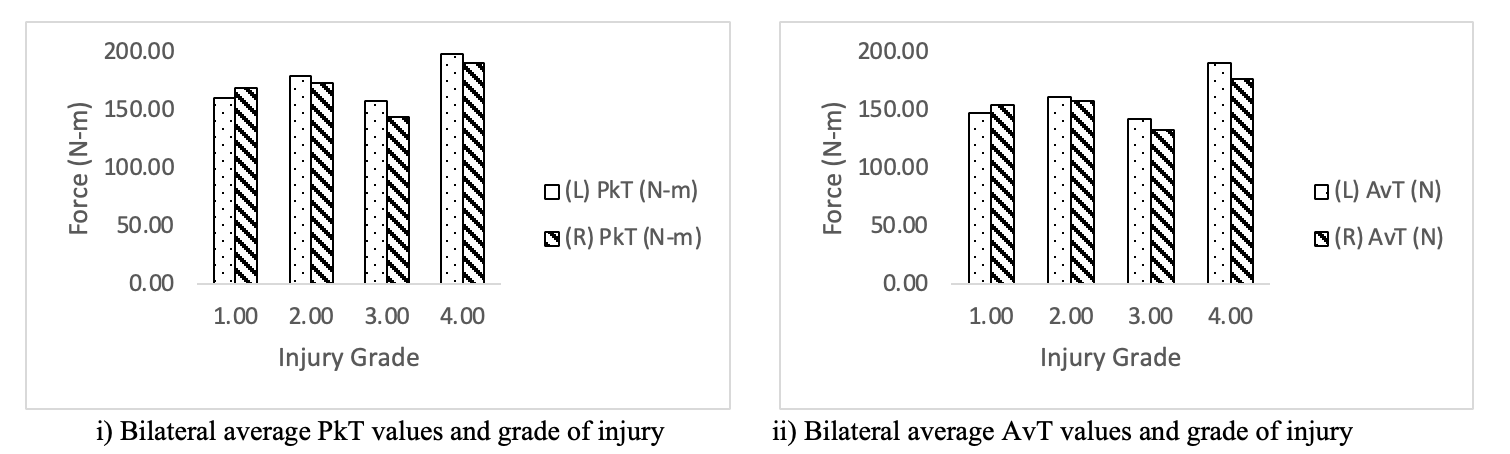
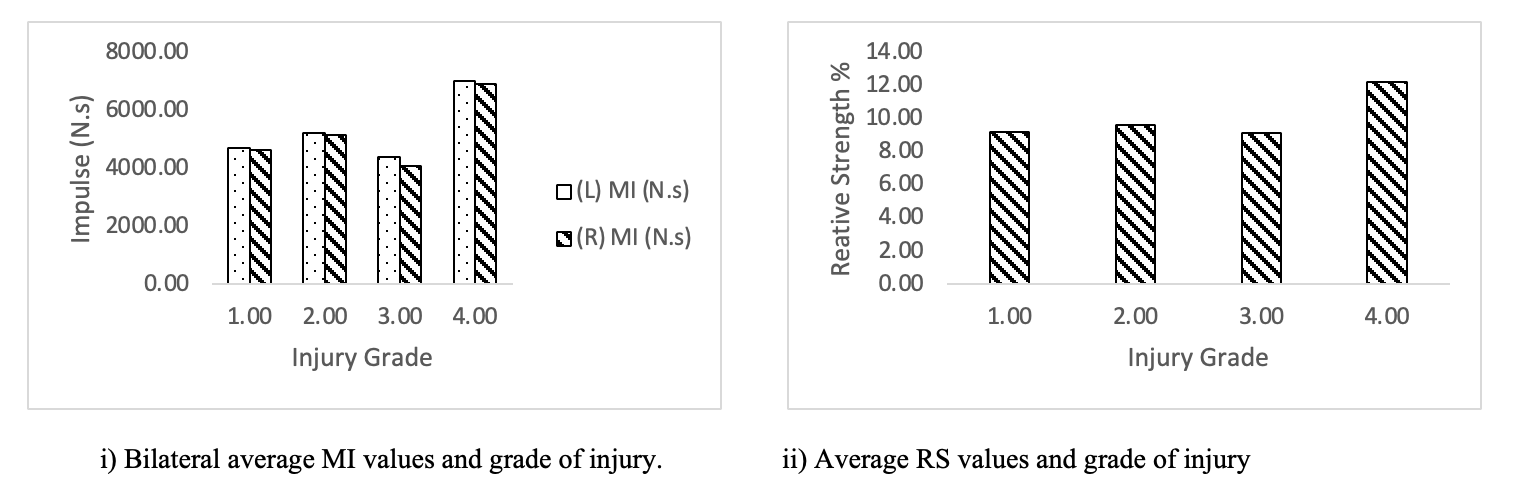
Table 1 displays the mean eccentric strength metrics in relation to the grade of injury sustained by the player. Further to this, Table 2 highlights the mean eccentric strength metrics relative to the location of the injury, graded by the BAMIC post MRI scan.
Table 3 displays no significant main effect for grade of injury, level of player and muscle injured on any of the bilateral eccentric hamstring strength parameters of PF, PkT, AvF, AvT, MI, IS, PFS, PkTS and RS.
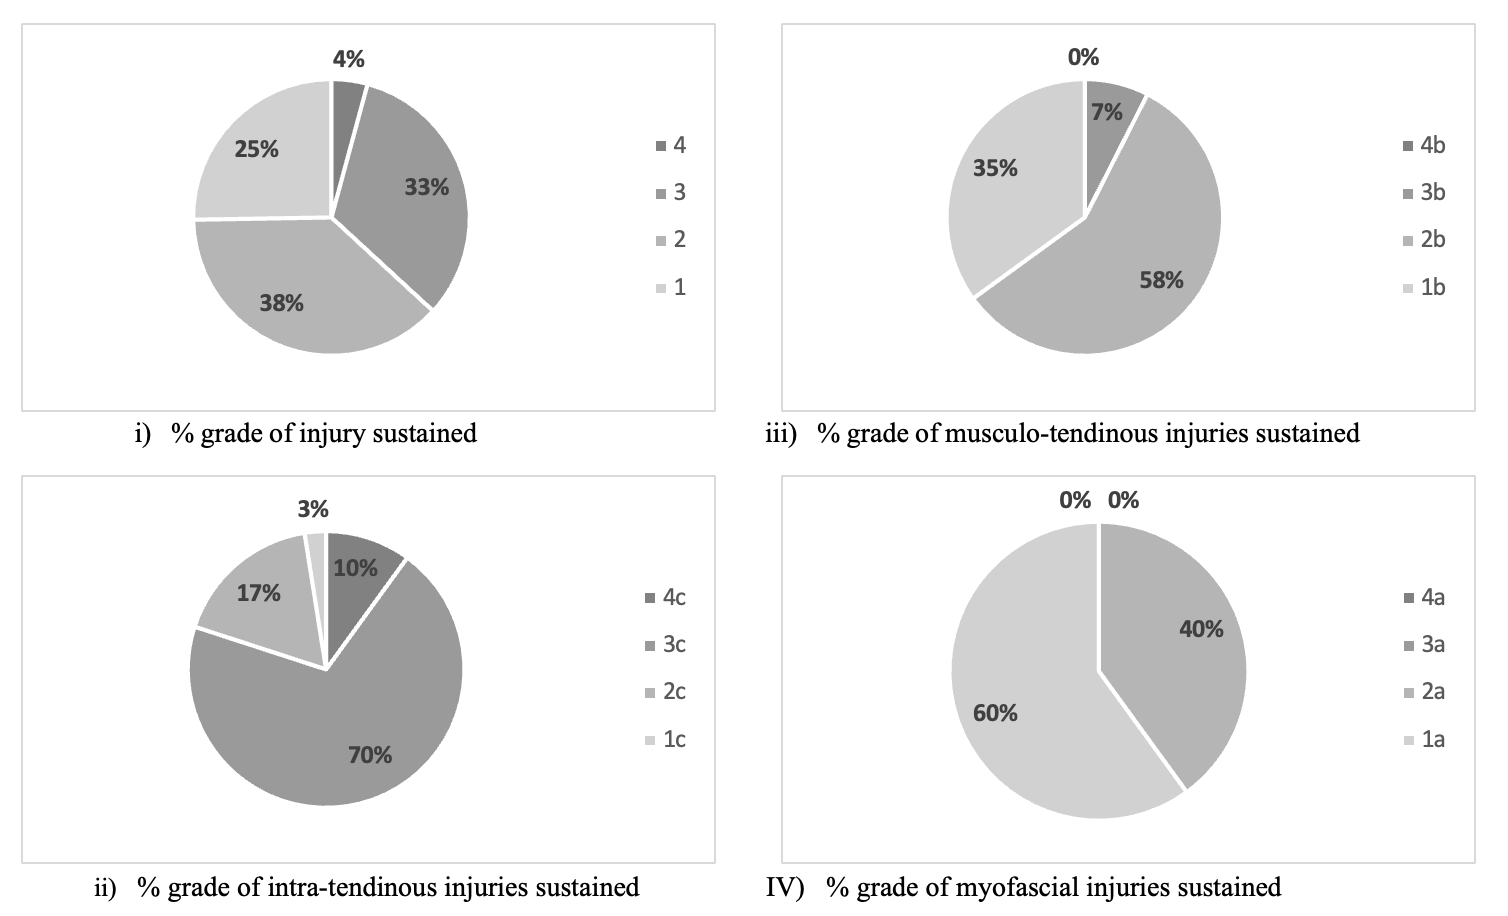
Descriptive statistics for the 95 elite footballers are displayed below, identifying the percentage representation of injuries sustained in relation to grade and location and the severity of injury against eccentric hamstrings strength metrics. Figures 1-3 below, details the grade of injury against eccentric hamstrings strength metrics of PF, AvF, PkT, AvT, MI and RS.


Figure 4 highlights the grade of injury in relation to the location of the injury sustained (a, b or c). Displaying 42% of all injuries were Grade 3 or 4, of the intra-tendinous injuries sustained 80% of them were grade 3 or 4, 83% of all Musculo-tendinous injuries were Grade 1 or 2 and 100% of myofascial injuries were Grade 1 or 2.
.png)
Discussion
The current study investigated the effect of eccentric hamstrings strength (EHS), on the resultant injury sustained, graded utilising the British Athletic Muscle Injury Classification, diagnosed via MRI. Main findings of this study highlight that EHS across all metrics of PF, PkT, AvF, AvT, MI, IS, PFS, PkTS and RS had no effect on grade of injury, level the player competed at, or the site of injury. Despite this, the descriptive statistics displayed some interesting findings, which the authors feel is pertinent to highlight to practitioners working within football.
Descriptive statistics within the present study detail that among the 95 injuries analyzed, 40 (42%) were intratendinous. These injuries often result in significantly longer healing and rehabilitation time.23 Further to this, only eight out of 60 (13%) of Grade 1 and Grade 2 injuries were intratendinous, in comparison to 32 out of 35 (91%) within Grades 3 and 4. The significance of this has serious implications for practitioners and clubs, in relation to player availability, cost of injury and the effect both can have on team performance. The nature of these injuries results in greater time loss, due to slower healing rates observed in tendon related injuries.16 Current literature documents clearly the effectiveness of eccentric strengthening programs on hamstring injury risk.15 Although, fails to conclusively detail the effect of these approaches on the adaptations seen in white tissue (tendon) in comparison to muscle belly. Further work is required in this area, to ensure that practitioners ensure a more global approach to injury risk reduction strategies within the hamstrings. Avoiding the pitfalls of a unilateral approach that one exercise will help reduce hamstrings injury risk, as detailed within literature.5–7
Evidence highlights that the ‘injury risk reduction conundrum’ faced by practitioners within football clubs continues, as hamstring injuries continue to have an exponential rise year on year.26 As a consequence, this highlights a potential gap between the current evidence base and practice. It is difficult to conclude whether this gap exists because of compliance with exercise prescription or literature simplification of a complex issue faced daily by practitioners. Another key consideration is the increasing physical demand of the game,27 potentially exposing players to a greater fatigue response, with serious implications to the forces exerted on the tendon tissue. Literature details how eccentric hamstring strength can be reduced by up to 30% because of fatigue.4,10 A reduction in muscle capacity, could potentially place greater demand on the tendon tissue to absorb the forces experienced in game play, due to the reduction in the muscle belly capacity. Thus, providing rationale that fatigue and functional strength remains a key etiological factor to monitor.
The physiological nature of tissue, muscular and tendon; differences in adaptive responses of different types of tissue; inability to separately quantify force absorption capabilities of tendon and muscle; and exercise prescription to specifically target muscle or tendon,15,23,28 make it extremely difficult for practitioners to understand where exactly the weakness exists. As a result, this raises questions around the how adequate current testing and assessment devices/protocols are to accurately inform injury risk. Evidence describes that tissue strength is a key etiological factor associated with hamstring injury.29 Within the current study 13 out of 31 (42%) players presenting a relative strength of > 10.0 (calculated by combined PF production/body weight), sustained intratendinous injuries at Grade 3 or 4. Although, debate exists surrounding the effect of asymmetry,30,31 descriptive findings detailed that 35 out of 95 (37%) players displayed an asymmetry score of > 10% within their PF values. Practitioners should carefully consider what each metric represents, its relationship to the mechanical exposure encountered and whether the test completed provides a clear picture of the force absorption capabilities of the full musculo-tendinous unit. The purpose of presenting this information is not to disregard current testing protocols, rather, to highlight the complex nature of the physiology of tissue, individual differences in athletes in relation to adaptation and response, and to carefully consider what the information offers us in context. Future investigation is required in relation to current testing protocols and whether they provide insight in to where the athlete is deficient to further enhance protocols for injury risk reduction.
Current literature highlights the importance of EHS training, with a heavy focus towards regular Nordics exposure, which has been shown to reduce injury occurrence.15 Previously, in this discussion, debate was presented surrounding the adaptive response of white tissue and muscle belly. It could be argued that if current exercise prescription approach provides the greatest effect on the muscle belly, within a specific range, then once adaptation occurs the strength of the muscle belly may exceed the force absorption capability of the tendon. Particularly, when considering fatigue response, where the muscle strength capacity is reduced significantly when exposed to game play.4,10 These factors potentially resulting in a greater chance of sustaining a significant intratendinous injury. Present findings in the current body of work highlight this type of injury is predominant within the population represented and practitioners should carefully consider how tendon and muscle belly are strengthened in tandem.
Lum et al.,28 has demonstrated the importance of variations of maximal isometric exposures for athletes to allow specific focus on tendon strength. With the advantages of this approach highlighted as maximal force exposure within specific ranges, which over time would elicit a positive adaptive response in the targeted tissue.15 Further work is required in this area, with a specific focus on isometric training and the effect on injury epidemiology and risk. In addition, a greater understanding of tendon demand, response to fatigue and recovery time is required. Accompanied with further research to identify the optimal exposure in relation to time, volume and intensity of isometric exercise and its effect on different types of tissue response, would provide practitioners with vital information in their battle to reduce injury risk. It is unclear within literature whether prescribed exercise elicits a specific response within specific tissue types and evidence is lacking in appropriate testing protocols to identify tendon function.
The complexity of injury etiology is evident and poses a significant contextual issue for practitioners in their battle to maximize player availability, while improving physical performance. In practice there is a genuine conundrum of how ‘we tick all the boxes’, with the intention of maximizing player availability. Importantly, it is essential practitioners identify the key factors and implement a training programme that facilitates athletes’ improvements in these areas. It is evident within literature, that strength is a key etiological factor contributing to injury. Understanding the positive effect of training and the detrimental response from fatigue, guides the importance and periodisation of recovery protocols and training design. Importantly, the current body of work highlights a greater understanding is required as to how training and fatigue responses directly affect tendon and muscle belly response and the differences between the two.
Limitations
No power calculation was completed prior to study completion and is highlighted as a limitation. The data collated were based on a convenience sample obtained by members of the author team. Analysis was completed on a convenience sample across four divisions, from clubs that were willing to share their data. The data presented in the present body of work does not identify the exact location of the tendon injury in relation to distal or proximal. Analysis of this is essential for practitioners to identify appropriate exercise selection and injury risk reduction strategies. Other factors related to injury risk and occurrence were not considered in this study due to the authors wanting to examine the effect of eccentric strength on the resultant hamstring injury that players sustained. These factors should be considered in association with eccentric strength when designing rehabilitation protocols post injury, conditioning programs, or injury risk reduction strategies.
Conclusion
Within the population of players observed in the present study the strength profiles of players had no effect on the grade of injury, the level the player competed at, or the site of injury. Yet, the population displayed a significantly large number of intratendinous injuries. Inevitably, this type of injury has implications on the availability of players, which is detrimental to performance and financial statuses of football clubs. Further research is required to understand the fatigue response of tendon tissue to game play, its response to recovery strategies, and training methods to improve the integrity of the tissue. In addition, literature identifies the detrimental effects of fatigue on muscle strength capacity and further research to examine to the effect fatigue has on the forces exerted by tendon tissue is warranted.