
INTRODUCTION
The rehabilitation process following Anterior Cruciate Ligament Reconstruction (ACLR) presents a challenging recovery for patients to restore muscular strength, movement patterns, and confidence within daily life and activity participation. To guide patient treatment, clinicians use available comparisons, such as baseline data (pre-injury), symmetry to the contralateral limb, or population normative values. Regardless of the comparison, clinical targets are traditionally set to guide treatments and rehabilitation progression. These targets can be presented as “thresholds” that are indicative of successful patient outcomes. However, the large variability within established thresholds following ACLR may present uncertainty and a lack of clarity when using objective measures to dictate patient advancement.
Thresholds provide a target for clinicians and patients alike to achieve throughout their post-injury rehabilitation. Physical rehabilitation research has demonstrated that clinical targets and goal setting provides increased motivation and engagement.1 Due to the chronically observed deficits in quadriceps strength following ACLR, common target thresholds exist around knee extensor torque.2 To increase the clinical utility of these thresholds, understanding of how these thresholds are derived and what they represent is needed. The current commentary aims to (1) describe the methodology used to establish clinical thresholds, (2) discuss statistical considerations for interpreting these thresholds, and (3) examine the implications of variability in quadriceps strength targets for patient following ACLR.
VARIABLES TO ESTABLISH CLINICAL THRESHOLDS
Clinical thresholds are obtained by tying a measure of interest, or independent variable (i.e., quadriceps strength), to a patient outcome, or dependent variable. Patient outcome measures are commonly dichotomized, indicating a superior and inferior outcome. Within the ACLR literature, common outcomes are subjective function quantified through patient reported outcome measures, the ability to return to running, the ability to return to sport, the occurrence of a subsequent injury, or the incidence of post-injury osteoarthritis.
Common patient reported outcome measures, such as the International Knee Documentation Committee (IKDC) subjective form and the Knee Osteoarthritis Outcome Score (KOOS), are continuous variables commonly quantified as a percentage ranging from 0-100%.3 To dichotomize these outcomes, it is common for cut-offs to be established that are indicative of “success”. Such cut-offs have been established for patients following ACLR through Patient Acceptable Symptom State (PASS) scores or population normative values,4–6 however, these cut-offs themselves are variable, depending on whether they were established from a single cohort (i.e. all ACLR participants) or if separate cut-off scores are provided for gender and/or age-specific cohorts. Regardless of the outcome, the dependent variable is typically dichotomized to indicate a positive or negative outcome. The variable we clinically intend to manipulate or improve (i.e. quadriceps strength) to achieve the positive outcome is the independent (or predictor) variable.
DIAGNOSTIC TESTING: STATISTICAL ANALYSES USED TO ESTABLISH CLINICAL THRESHOLDS
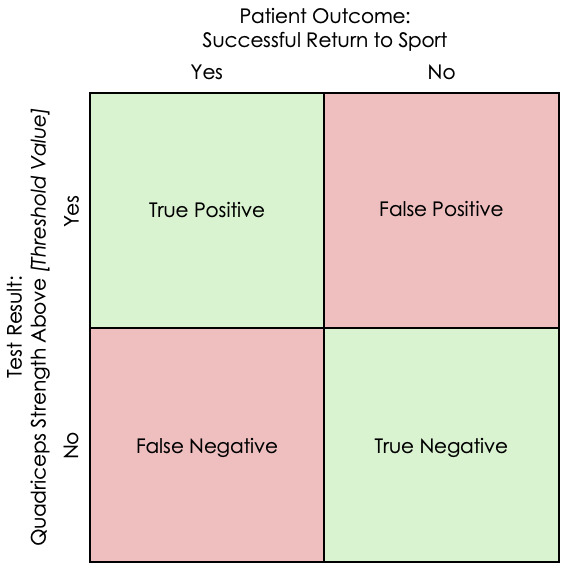
Using the desired outcomes above, we can evaluate the diagnostic nature of “predicting” these outcomes through diagnostic testing. Within sports medicine, the term diagnostic testing is often referenced with “special tests” and their ability to identify the presence of a pathology. As an example, to analyze the diagnostic nature of the Lachman Test to predict an ACL injury,7 the sensitivity and specificity can be calculated though the true-positives, true-negatives, false-positives, and false-negatives. Similarly, the diagnostic nature of a strength threshold can be established by calculating the same values (Figure 1). However, this only assesses the diagnostic accuracy of a single value of quadriceps strength. As quadriceps strength is a continuous variable, with a normative dataset ranging from 0.55 Nm/kg to 3.43 Nm/kg,8 the sensitivity and specificity for every value needs to be evaluated to identify the single value, or threshold, that best predicts our outcome of interest. This analysis can be conducted and illustrated through a Receiver Operator Characteristic (ROC) Curve analysis.9

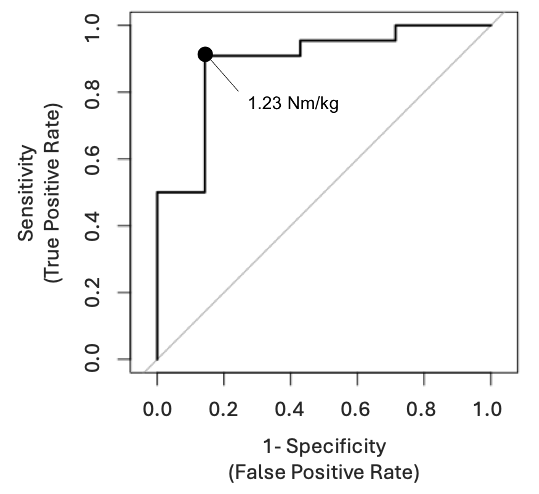
Once a dichotomized outcome is established (i.e. Patient Acceptable Symptom Score5 = Yes | No, Return to sport = Yes | No, etc.), the ROC curve graphically illustrates the diagnostic accuracy for every value of the independent/predictor variable of interest (i.e. Knee Extensor Strength) to identify the single value with the best predictive nature (Figure 2). This is determined by the single value within a continuous variable range that achieves the best balance between sensitivity and specificity. One statistical measure to find the “optimal” cutoff value is Youden index (J) that maximizes the vertical distance from the line of equality (diagonal line) to the chosen cutoff value.11 According to Youngstrom,12 however, the cutoff value should be chosen based on: “(1) the intended use of the test, (2) the base rate of the disorder in the clinical setting, and (3) the relative costs and benefits attached to correct classification and errors.”
In order to evaluate the overall diagnostic accuracy, the area under the curve (AUC), an entire location under the ROC curve, can be calculated and used.13 AUC values range from 0.0 to 1.00 and are categorized as: no discrimination (< 0.5), acceptable discrimination (0.7-0.8) excellent discrimination (0.8-0.9) or outstanding discrimination (> 0.9).14 It is should be highlighted again that the threshold be chosen based on how the clinician and patient see the successful outcome, and that ROC curve analysis be used as one of the guides for their decision.
ESTABLISHED QUADRICEPS THRESHOLDS FOLLOWING ACL-RECONSTRUCTION
The methodology above has been performed to establish clinical thresholds for quadriceps strength following ACLR, though these established quadriceps strength thresholds range widely from 1.23 Nm/kg10 to 3.40 Nm/kg,15 a common strength metric utilized to normalize torque (Nm) by body mass (kg) to allow between patient comparisons. Articles utilizing ROC curve analyses to identify thresholds of strength indicative of patient outcomes post-ACLR were extracted for the current commentary from PubMed searches and cross referencing. Table 1 provides data from example articles utilizing quadriceps strength thresholds following ACLR.10,15–25 Due to the clinical commentary nature of this work, compared to systematic or scoping review guidelines,26 it is important to note that this table may not be an exhaustive list of established ACLR strength thresholds. Rather, this table aims to demonstrate the variability within strength thresholds, outcome variables used, the definitions of “success” and the demographics of study cohorts utilized.
The variability within studies used to establish strength thresholds extend more than the strength cut-offs themselves, and attention should be placed within the methodology of how each threshold was derived. Table 1 also presents the differences within the study populations utilized (i.e. time post-ACLR), the mode of contraction used to assess strength (isometric vs. isokinetic), the joint angle of isometric testing or the speed of isokinetic testing, and outcome used to define “success” (i.e. patient reported outcomes vs return to running). Even when utilizing the same patient reported outcome measure (i.e. IKDC), two different IKDC score cutoffs (76%23 vs 90%22) are used to define “positive” and “negative” outcomes from different studies.
With known positive relationships between strength and patient reported outcome measures (PRO’s),27 it can be expected that a lower score cutoff used to define “success” will result in a lower strength threshold. Functional measures of success also vary in how they define “positive” and “negative” outcomes. Two separate studies investigating strength thresholds to promote return to running characterize their “success” outcome differently. Iwame et al. characterized their successful outcome as achieving an average running velocity ≥9.0 km/h over 5 minutes where Dauty et al. characterized success as the ability to run at least twice a week for 20 min or more.17,18 Though both studies aim to provide clinical thresholds of strength to promote the progression to running, different methodology in how these outcomes were dichotomized may result in varied strength targets.
The variability in how “success” is defined in establishing a strength threshold presents challenges to the clinician and patients, as a multitude of targets may be available for the patient to strive towards. Without critically appraising the methodology in how these thresholds are established or the patient outcomes they are tied to, large opportunity for misinterpretation exists.
CLINICAL INTERPRETATION
The AUC provides as estimate of the contextual strength of the established threshold to predict the outcome measure. Using Ashnai et. al, as an example,15 a strength threshold of 2.60 Nm/kg when assessed at an isokinetic speed of 90°/sec has a AUC of 0.78 (sensitivity=0.77, specificity=0.76) to predict the ability of female ACLR patient to achieve a PASS value for the KOOS-Sport. The AUC of 0.76 represents acceptable discrimination,14 indicating that this strength threshold for females following ACLR can be used to predict achieving acceptable sport-related symptoms. However, it is important to understand the specificity of the outcome measure used (i.e. KOOS-sport PASS scores for females) and the predictor variable of strength (i.e. mass normalized peak torque via isokinetic dynamometry at 90°/sec) when translating established outcomes to clinical practice.
In the utilization of established thresholds, it is vital to assess the dependent variable utilized (i.e. KOOS, IDKC, Return to Running, etc.). A threshold of quadriceps strength that can discriminate patients with high or low KOOS scores is not necessarily indicative of the ability to return to sport. Further, inspection of the cut-off utilized to define “success” may assist in the implementation of strength thresholds within post-operative rehabilitation. Dependent on the case and the patient’s post-operative goals, strength targets needed to achieve an IKDC score of 75.9% may be integrated differently within the rehabilitation progression than the strength needed to achieve an IKDC score of 90%.10,22 Generalization of strength thresholds without the consideration of the variables they are derived from may lead to misinterpretation of what the strength thresholds are indicative of.
Additionally, it is vital to determine the mode (i.e. isometric vs. isokinetic) and/or speed at which the strength assessment conducted. Torque-velocity relationships demonstrate the inverse relationship between the maximum torque produced to the concentric speed of the resistance.28 The peak torque assessed at a concentric speed of 270°/sec should be lower than the same participant assessed at a concentric speed of 60°/sec. Therefore, clinicians should not utilize a strength threshold established at a different speed than what they are assessing without appropriate conversion. Similarly, thresholds established from isometric testing should not be used when assessing muscular torque capacity through isokinetic modes.29 The methodology of strength testing may also worth consideration, as isometric strength assessed through an isokinetic dynamometry may differ from strength assessed through handheld dynamometry.30 Regardless of the mode or method of assessing strength, it is important to compare these factors to published clinical thresholds utilized to guide post-operative decision making.
The diagnostic accuracy of the established thresholds should also be considered. Utilizing ROC analysis and AUC, derived from sensitivity and specificity values, can provide quantitative, contextual strength of the established threshold to predict the outcome measure. Recall that an AUC value below 0.5 represents no discriminatory ability of the presented threshold, where a value above 0.9 represents outstanding discrimination.14 The balance between sensitivity and specificity may also be considered in the appraisal of established values depending on the clinical outcome of interest. A high sensitivity represents a high true positive rate; therefore, a negative predictor result is meaningful, typically ruling out the negative (or “unsuccessful”) outcome of interest. Contrary, a high specificity represents a high true negative rate; therefore, a positive predictor result will hold greater weight in predicting (rule in) the successful outcome of interest.31,32 Integrating the most predictive quadriceps strength threshold that is derived from a common outcome of interest may hold the greatest impact in guiding patient progressions.
CONCLUSION
Large variability presents within established quadriceps strength thresholds following ACLR. The current clinical commentary shares factors that may contribute to this variability – from the clinical outcomes the thresholds are derived from, to the methodology by which quadriceps strength is assessed. Embedding clinical goals or targets within post-ACLR rehabilitation should be done with the knowledge of the outcome that the strength threshold is indicative of. Careful interpretation of the established strength thresholds may assist in the integration within clinical post-operative progressions.
Conflicts of interest
The authors have no conflicts or competing interests to report.