


INTRODUCTION
The sport of rodeo is recognized as a high-velocity, high-intensity activity, with a wide range of varying dynamic movements occurring across different rodeo events.1–3 Furthermore, the high velocity and intensity coupled with extreme dynamic range of motion (ROM) movements, combined with uncooperative livestock, increases the potential risk of injury among rodeo athletes. In the sport of rodeo, just like any other sport, injuries are inevitable. Multiple studies have concluded that bull riding and rough stock events garner the most injuries incurred by rodeo athletes.1,2,4–7 Competition in a three-day rodeo proved that 70% of bull riding competitors were injured, and one bull rider was injured twice.6 An update in 1987 confirmed again that bull riding was the most dangerous rodeo event garnering the most injuries. That update concluded that injuries to bronc riding competitors was the second most dangerous event, while barrel racing was the safest event with no injuries reported.5 Butterwick et al.8 found that rough stock events accounted for the majority of rodeo injuries, specifically bull riding accounting for 31% of rodeo injuries in Canadian professional rodeo athletes over a five-year period. Upper body (head/neck, chest/ribs, shoulder, hand, elbow, back, wrist, fingers, and forearm) make up 66% of injuries and lower body (knee, leg/calf, ankle, pelvis, thigh, foot, and groin) make up 34% of injuries in college rodeo athletes.4 The different types of injuries sustained by college rodeo athletes are contusions (42%), strains (15.9%), concussions (13.8%), sprains (10.9%), abrasions (8.7%), lacerations (3.6%), fractures (3.6%), and dislocations (1.5%).4 Injuries sustained during performance include, 21% from mishandling of ropes, chutes, and gates, along with other equipment problems and blunt force trauma, 18% during the dismount, 15% being stepped on, 9% hung up on rigging, 7% kicked, and 7% horned by livestock.4 Historically, rodeo related injuries are generally linked to the danger associated with the tasks and livestock within the sport; however, the field has yet to identify rodeo- and event-specific movement capabilities and the role movement competence my play in rodeo injury. Many related articles address the anthropometric, epidemiological examination/data collection, and exercise performance, along with body composition, cardiovascular endurance, coronary risk, muscular strength and power, and visual reaction time for rodeo athletes. However, functional movement is an area undiscovered for rodeo athletes. Each event requires different movement proficiency to perform the event correctly and limit the risk of injury. By identifying limits in functional movement patterns per event and establishing exercises to enhance athletes’ movement, a decrease in injuries may be observed.
The Functional Movement Screening (FMS™) system has been employed to explain sport-specific movement competency for various sports (for both males and females) including but not limited to collegiate golfers, rugby, soccer, football, volleyball, tennis, mixed martial arts, and tactical personnel such as firefighters.9–19 Specifically, a study conducted by Loudon et al.20 examined FMS™ performance of long distance runners and found significant differences in FMS™ scores between males and females as well as significant differences between those younger than 40 and older than 40 years of age; furthermore, showcasing FMS™ as a valuable variable used to distinguish categorical differences within an individual athletic group. Anderson et al.21 capitalized on the categorical utility of FMS™ and identified FMS™ outcome differences between male and female secondary school athletes (13-18 years old). Lloyd et al.11 recognized age-specific FMS™ differences in youth male soccer players. These categorical outcomes persist across multiple studies and have identified normative FMS™ values for multiple sports.
While categorical implication associated with FMS™ present novelties, the connection between FMS™ outcomes and athletic performance enhancement as well as injury prevention naturally peak practitioner interest. Lockie et al.22 recognized correlations between FMS™ scores and athletic performance outcomes for recreational team sport female athletes further indicated higher hurdle step (HS), in-line lunge (ILL), and active straight leg raise (ASLR) were predictors of lower performance outcomes in agility tests. Lloyd and colleagues11 documented the deep squat (DS), ILL, ASLR, and rotary stability (RS) performance were significant predictors for reactive strength index, reactive agility cut, and squat jump outcomes of youth soccer players. However, opposing the previously stated investigations, Parchmann et al.23 studied the influence of FMS™ on athletic performance test outcomes of NCAA Division I golfers, and concluded FMS™ had no statistically significant correlation with 10-m sprint, 20-m sprint, vertical jump, nor agility performance. Garrison and colleagues24 examined FMS™ scores of 160 collegiate athletes and tracked injury occurrence across a season using medical records and athletic trainer reports. Their results showed that athletes with an FMS™ score of 14 or below and a history of prior injury were at a 15-fold increased risk of injury, with prediction probability improving from 33% to 74%.24 In contrast, Warren et al.25 examined the seasonal injury reports and preseason FMS™ score of 167 Division I athletes, finding no significant association between composite FMS™ scores (≤14), movement asymmetries, and injury risk. However, and unexpectedly, athletes that scored 2 on the ILL were less likely to experience injuries compared with those scoring a 3.25 Related to the tactical population, 874 Marine officer candidates completed the FMS™ at medical in-processing and were monitored for injuries during training, with analyses comparing short- and long-cycle cohorts.26 Results showed that candidates scoring ≤14 had a higher risk of injury in both cohorts (RR = 1.65–1.91), though predictive sensitivity was low, indicating that while low FMS scores were associated with injury risk, the tool had limited accuracy in predicting injuries.26 These examples express the sport- or group-specific utilitarian value of FMS™, further indicating implementation of the tool across athletic domains without appropriate empirical examination may yield false, unwanted, or detrimental performance results. Establishing normative group data, assessing the correlation between FMS™ and athletic performance and injury, and finally, implementing corrective strategies intended to improve performance and decrease injury has yet to be examined for the sport of rodeo. Therefore, the purpose of the current investigation was to identify movement pattern differences among athletes from various rodeo events using the FMS™ test. The researchers hypothesized that no difference would be identified among rodeo athletes.
METHODS
Participants and Recruitment
One hundred and sixty-two collegiate rodeo athletes from a mid-size, southwest region university were selected to participate in this study. Athletes were recruited at the annual university organizational rodeo meeting after being informed of the study. Athletes were categorized into groups in accordance with their respective rodeo event: steer wrestlers (n= 12), breakaway (n= 44), goat tying (n= 17), barrel racing (n= 30), team ropers (n= 23), tie-down ropers (n= 8), bronc riders (n= 18), and bull riders (n= 10). Height (m) and body mass (kg) were assessed using a stadiometer and beam scale (Detecto Scale Company, Webb City, Missouri, USA). Current athlete on the college rodeo team was the participation inclusion criteria. Before testing, all subjects signed an Institutional Review Board informed consent form and filled out a Physical Activity Readiness Questionnaire (PAR-Q). Exclusion of participants was determined by previous injury history and any pre-existing conditions and/or medical history as identified in the PAR-Q, which included: heart condition, chest pain during exercise, high blood pressure, chronic joint or bone injury or pain, degenerative diseases, chronic diseases, neurological issues, or impaired balance or consciousness. Athletes were number coded to ensure subject confidentiality was maintained. All experimental procedures were approved by the Institutional Review Board for the Protection of Human Subjects at Tarleton State University prior to commencement of testing.
Functional Movement Screen (FMS™)
The FMS™ is a screening system that is based on fundamental proprioceptive and kinesthetic awareness principles and was created to assess the fundamental movement patterns of an individual.27,28 When used as a screening tool, the FMS™ works to discern the patterns and imbalances of mobility and stability of an individual. This screening system can be used in either pre-participation screening or to inform rehabilitation after injury of an individual. Before the start of the college rodeo seasons (i.e., pre-season), all rodeo athletes completed FMS™ screening to establish movement efficiency and assess mobility and stability within the upper and lower body. The administration of FMS™ protocols was conducted in accordance with the previously published guidelines of Cook et al.27,28 No additional coaching tips were used during the screening process, other than verbal instruction.17 Individual scores were not disclosed to participants. Each movement pattern was scored using standard composite scoring on a FMS™ score sheet. Participants completed a standardized five-minute warm-up before completing the FMS™, which consisted of a two-minute jog, and five general dynamic stretching exercise.21 Each movement pattern was performed once, and the movement pattern was only repeated if the examiner was unsure of the assessed score. The FMS™ utilizes seven functional movement patterns. These functional movement patterns include deep squat (DS), hurdle step (HS), in-line lunge (ILL), shoulder mobility (SM), active straight leg raise (ASLR), trunk stability push-up (TS), and rotary stability (RS). Each movement pattern test is scored on a scale from zero to three, zero being the worst possible score and three being the best possible score. A score of zero is given if the individual experiences pain at any time during the movement and the painful area is noted. A score of one is given if the individual is unable to complete the movement or get into position to perform the movement. A score of two is given if the person can get into position but compensates in any way to perform the movement. As assumed, a score of three is given if a person performs the movement correctly, without pain or compensation in any way.27,28 Notation of any painful area and specific comments describing why a score of three was not given are also obtained. For this study, a unit decrease in FMS™ score was defined as a one-point reduction on the 0–3 scale. Most FMS™ screening tests examine both the right and left sides, and it is important to score both. Testing the right and left sides helps to discern asymmetries that may be found between the two sides of the body. Five of the seven (HS, SM, ASLR, ILL, and RS) FMS tests are performed with both limbs.29 Each side receives an individual score, however only the lower score of both sides is recorded and counted toward the total score. Three of the seven (SM, TS, and RS) FMS™ tests have additional clearing screens that are graded as positive or negative. These clearing screens only consider pain, therefore if an individual experiences pain that portion of the test is scored positive and if no pain is experienced the test is scored negative. If the clearing screen is scored positive the overall score for that test will be zero.27,28 A comprehensive score is calculated at the completion of all seven tests with a total available score of 21.30 Studies indicate that although a score of 21 is the best possible total score, functional movement testing is about determining if a person can move above an established minimal standard,27,28 further suggesting that lower overall FMS™ scores predict greater risk of injury than higher scores. Previous studies have indicated that a total of 14 points can been used as an ideal cut-off score – this score has been used to identify the prediction of injury and may determine who is at a greater or lesser risk of injury.31 Screenings were completed at the Tarleton State University Rodeo Facility the week before pre-season practice began. To prevent violation in interrater reliability, all FMS screens were conducted by an individual faculty member credentialed as a Doctor of Athletic Training (DAT), Licensed Athletic Trainer (LAT), and Athletic Trainer, Certified (ATC).
Statistical Analyses
Descriptive statistical analyses were employed to establish an FMS™ profile per rodeo event, and the results were reported as standard error of the mean (SEM). To examine difference of FMS™ between rodeo events, an 8 (events) × 8 (tests) mixed factorial ANOVA was employed. However, homogeneity of variance was assessed using Lavene’s test – p < 0.05 – indicating a violation of homogeneity assumption. Therefore, a General Linear Model (GLM) with repeated measures was employed to assess the interaction effect while accounting for unequal variance.32 The term “repeated measures” in this study refers not to tests repeated over time, but to the fact that each participant completed multiple assessments—the eight individual components of the FMS™. Thus, the repeated measures factor is the within-subjects variable representing the eight FMS™ test scores, which were all collected in a single testing session. The between-subjects factor is the participant’s rodeo event group (e.g., bull riding, barrel racing, etc.). Moreover, this structure allows us to examine both overall differences in movement patterns across events and interactions between event group and specific FMS™ components. Kirk33 and Field34 expressed additional analysis using RM ANOVA is warranted to further understand the nature of the interaction(s) identified via the initial GLM. Fisher’s LSD post hoc analysis was employed for RM ANOVA when a significance was identified (p < 0.05). Effect sizes using Partial eta squared were reported according to Cohen et al.35 as small (0.01), medium (0.06), or large (0.14) effect size. All statistical analyses were performed using IBM SPSS version 28.0.0 (SPSS Inc., Chicago, IL, USA).
RESULTS
Study participants consisted of 162 collegiate rodeo athletes, including 71 males (20.5 ± 1.35 years) and 91 females (20.2 ± 1.38 years). Event specific demographic information as well as mean, standard deviation, and standard error of the mean for FMS™ scores are presented in Table 1.
Levene’s test for assessing homogeneity of variance was violated due to vastly unequal group size; furthermore, a GML was used to assess the interaction effect while accounting for unequal variance.32 The GLM analysis revealed a significant interaction effect between Event and FMS™ tests, (F(7, 55) = 8.11, p <.0.01), with robust standard errors applied. In the GLM analysis, the main effect of steer wrestling on SM was significant, (B = -0.717 (SE = 0.33), t (55) = -2.18, p = 0.03), indicating that steer wrestling was associated with a 0.717 unit decrease in SM performance. The main effect of steer wrestling on ILL was significant, (B = -0.533 (SE = 0.25), t (55) = 2.10, p = 0.04), indicating steer wrestling was associated with a 0.533 unit decrease in ILL scores. The main effect of steer wrestling on DS was significant, (B = -0.617 (SE = 0.24), t (55) = 2.56, p = 0.01), indicating steer wrestling was associated with a 0.617 unit decrease in DS outcomes. The main effect of goat tying on SM was significant, (B = -0.712 (SE = 0.30), t (55) = -2.37, p = 0.02), indicating goat tying was associated with a 0.712 unit decline in SM outcomes. The main effect of barrel racing on RS was significant, (B = -.500 (SE = 0.24), t (55) = -2.06, p = 0.04), indicating barrel racing was associated with a 0.50 unit decline in RS outcomes. The main effect of team roping on SM was significant, (B = -0.648 (SE = 0.28), t (55) = -2.32, p = 0.02), indicating team roping was associated with a 0.648 unit decline in SM outcomes. The main effect of team roping on TS was significant, (B = 0.613 (SE = 0.23), t (55) = 2.63, p = 0.01), indicating team roping was associated with a 0.613 unit increase in TS performance. The main effect of tie down roping on SM was significant, (B = -1.050 (SE = 0.29), t (55) = -3.68, p < 0.001), indicating tie down roping was associated with a 1.050 unit decrease in SM outcomes. The main effect of tie down roping on TS was significant, (B = -0.967 (SE = 0.27), t (55) = -3.62, p < 0.001), indicating tie down roping was associated with a 0.967 unit decrease in TS performance. The main effect of bronc riding on SM was significant, (B = 0.575 (SE = 0.26), t (55) = 2.20, p = 0.03), indicating bronc riding was associated with a 0.575 unit increase in SM performance. The main effect of bronc riding on TS was significant, ( B = 0.700 (SE = 0.23), t (55) = 23.11, p = 0.002), indicating bronc riding was associated with a 0.70 unit increase in TS performance. The main effect of bronc riding on ILL was significant, B = 0.589 (SE = 0.24), t (55) = 2.47, p = 0.01), indicating bronc riding was associated with a 0.589 unit increase in ILL performance. The main effect of bull riding on SM was significant, (B= -0.800 (SE = 0.29), t (55) = -2.80, p = 0.005), indicating bull riding was associated with a 0.80 unit decrease in SM outcomes. The main effect of bull riding on TS was significant, ( B = 0.600 (SE = 0.25), t (55) = 2.42, p = 0.02), indicating bull riding was associated with a 0.60 unit increase in TS performance. The aggregate FMS™ scores did not significantly (p = .438) differ between rodeo events. Specific FMS™ test differences per event are displayed in Figures 1 – 8.
Event Specific FMS™ Differences
A series of repeated measures analysis of variance (RM ANOVAs) were conducted to analyze individual FMS™ screenings (i.e., ASLR, SM, TS, etc.) for each rodeo event. Fisher’s LSD post hoc analysis was employed when a significant difference was identified within each rodeo event.
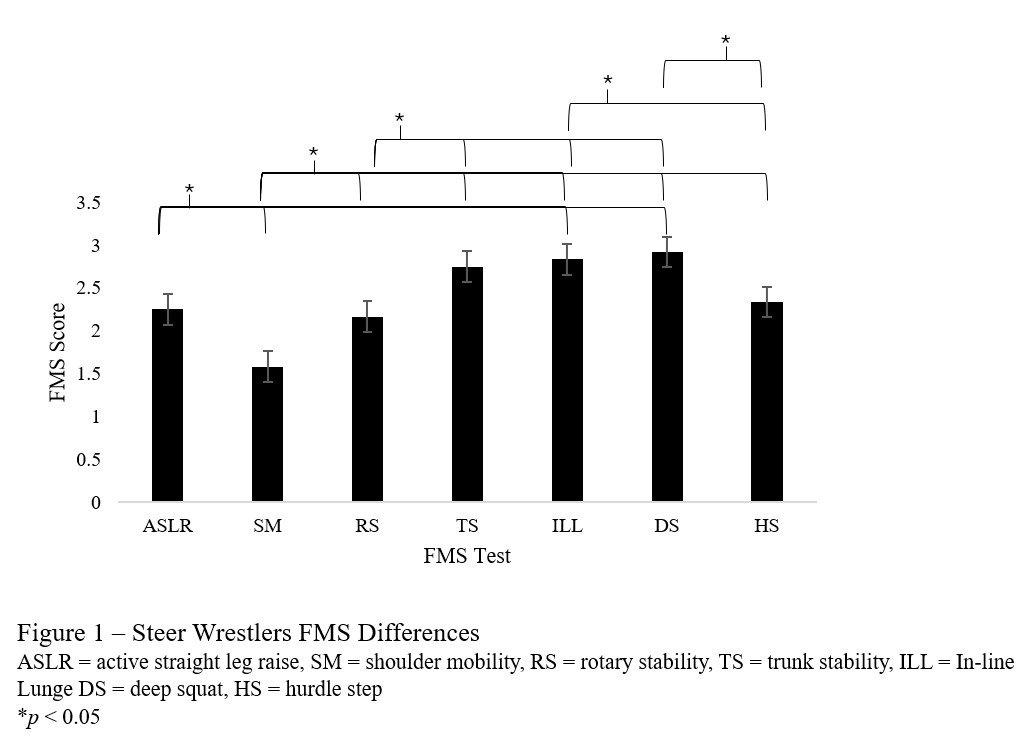
Steer Wrestling
The main effect of steer wrestling was significant (F(6,77) = 10.32, p < 0.001), with a partial eta squared of η2 = .484, indicating a large effect size, suggesting that steer wrestling significantly affects FMS™ scores. Specific significant differences are outlines in Figure 1.

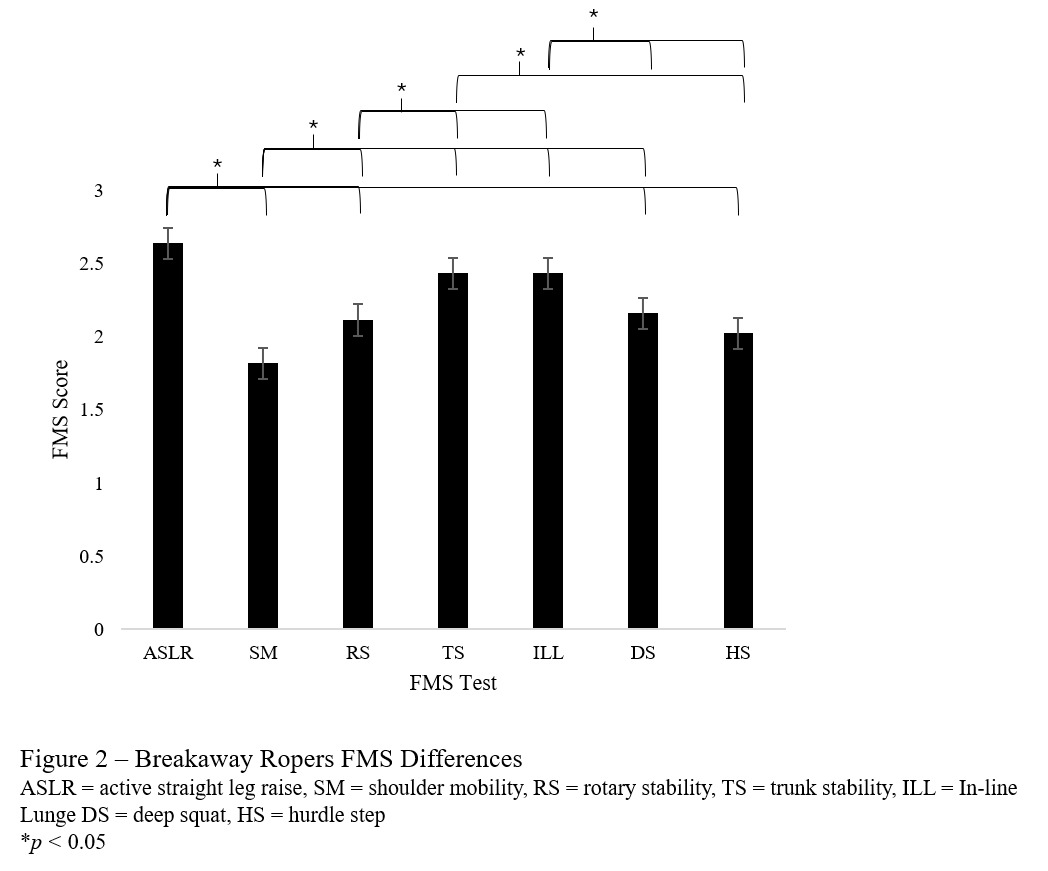
Breakaway Roping
The main effect of breakaway roping was significant, (F(6,308) = 9.896, p < 0.001), with a partial eta squared of η2 = .184, indicating a large effect size, suggesting breakaway roping significantly affects FMS™ scores. Specific differences are outlines in Figure 2.
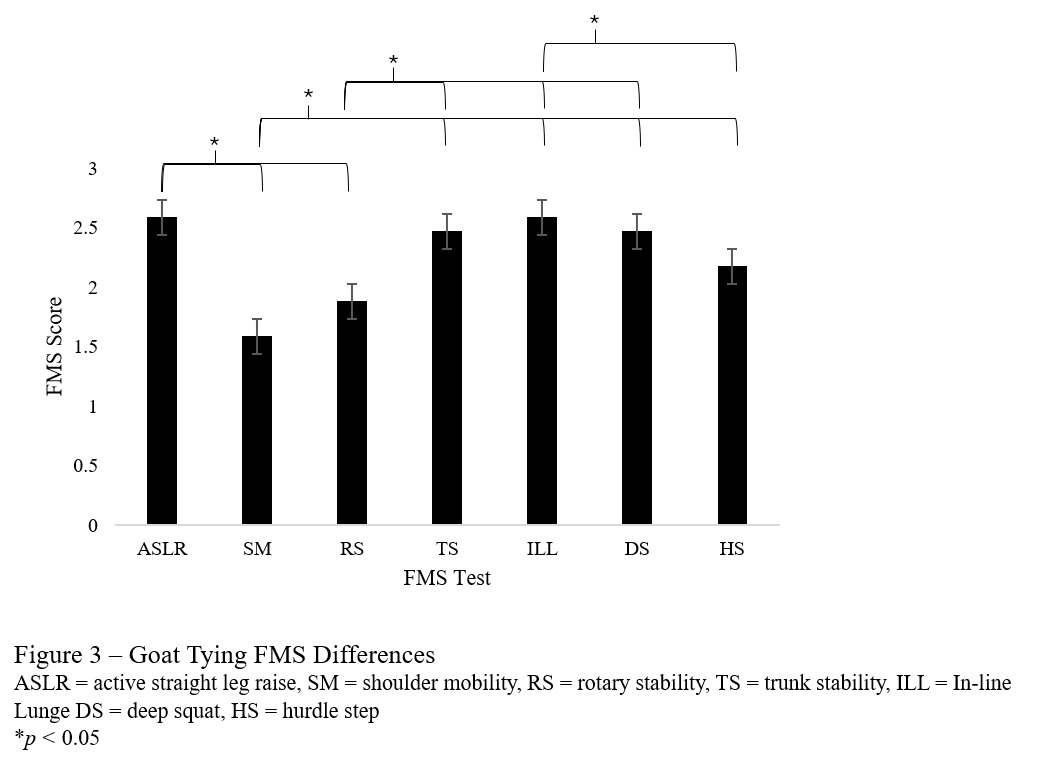
Goat Tying
The main effect of goat tying was significant, (F(6,112) = 7.166, p < 0.001), with a partial eta squared of η2 = .309, indicating a large effect size, suggesting goat tying significantly affects FMS™ scores. Specific differences are outlines in Figure 3.

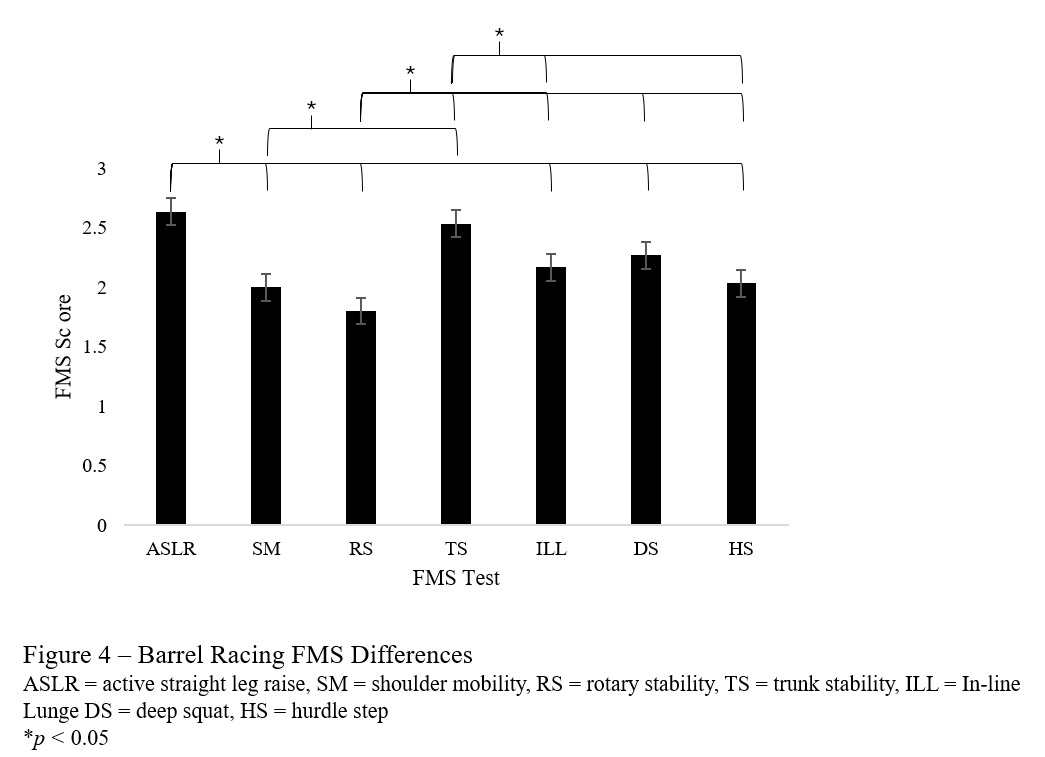
Barrel Racing
The main effect of barrel racing was significant, (F(6,203) = 7.747, p < 0.001), with a partial eta squared of η2 = .211, indicating a large effect size, suggesting barrel racing significantly affects FMS™ scores. Specific differences are outlines in Figure 4.
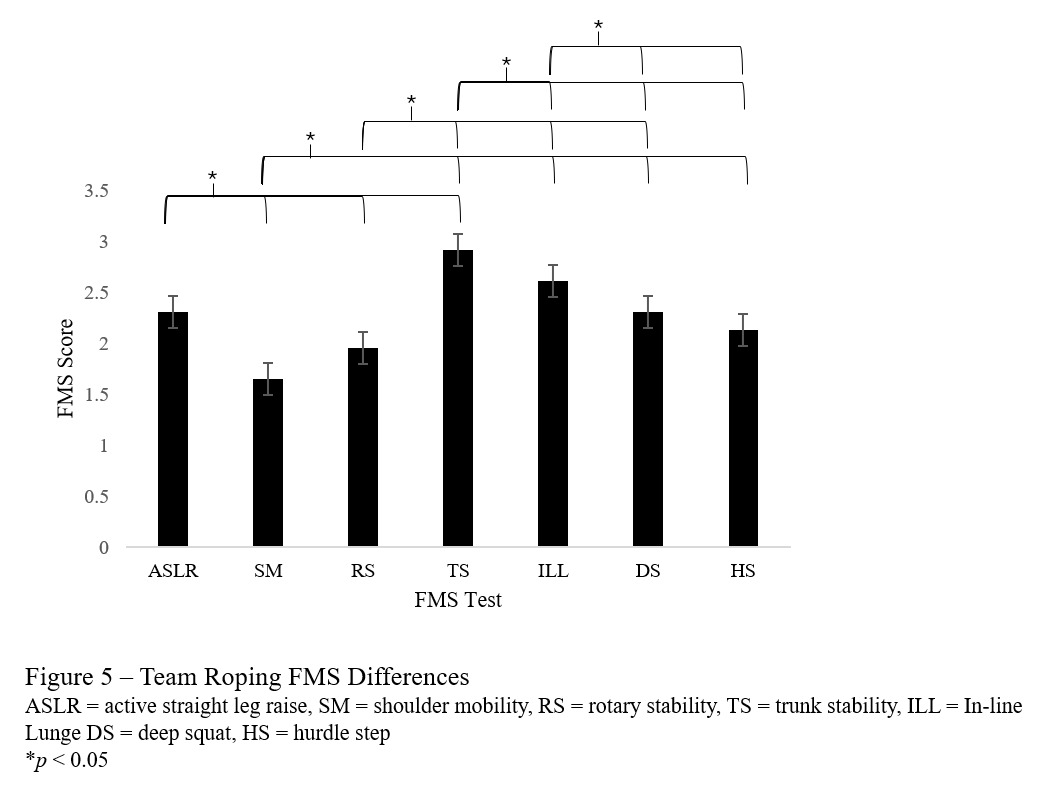
Team Roping
The main effect of Team Roping was significant, (F(6,161) = 13.48, p < 0.001), with a partial eta squared of η2 = .135, indicating a large effect size which suggests that Team Roping significantly affects FMS™ scores. Specific significant differences are outlines in Figure 5.
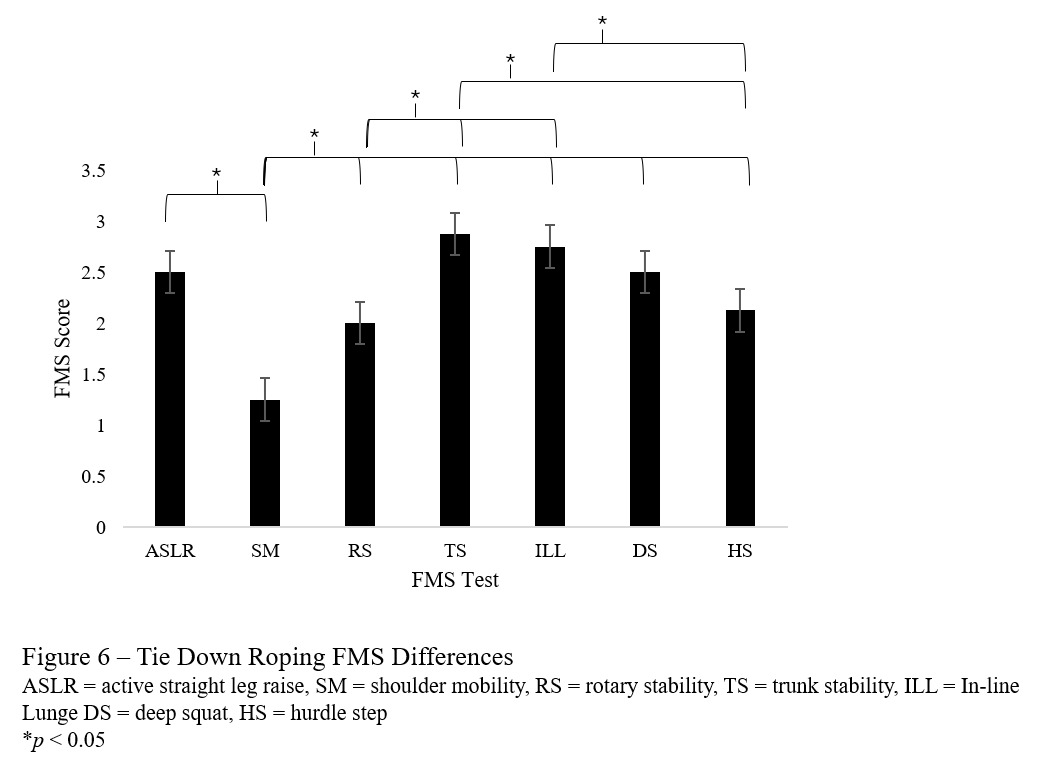
Tie-down Ropers
The main effect of tie-down roping was significant, (F(6,49) = 9.558, p < 0.001), with a partial eta squared of η2 = .577, indicating a large effect size, suggesting tie-down roping significantly affects FMS™ scores. Specific differences are outlines in Figure 6.
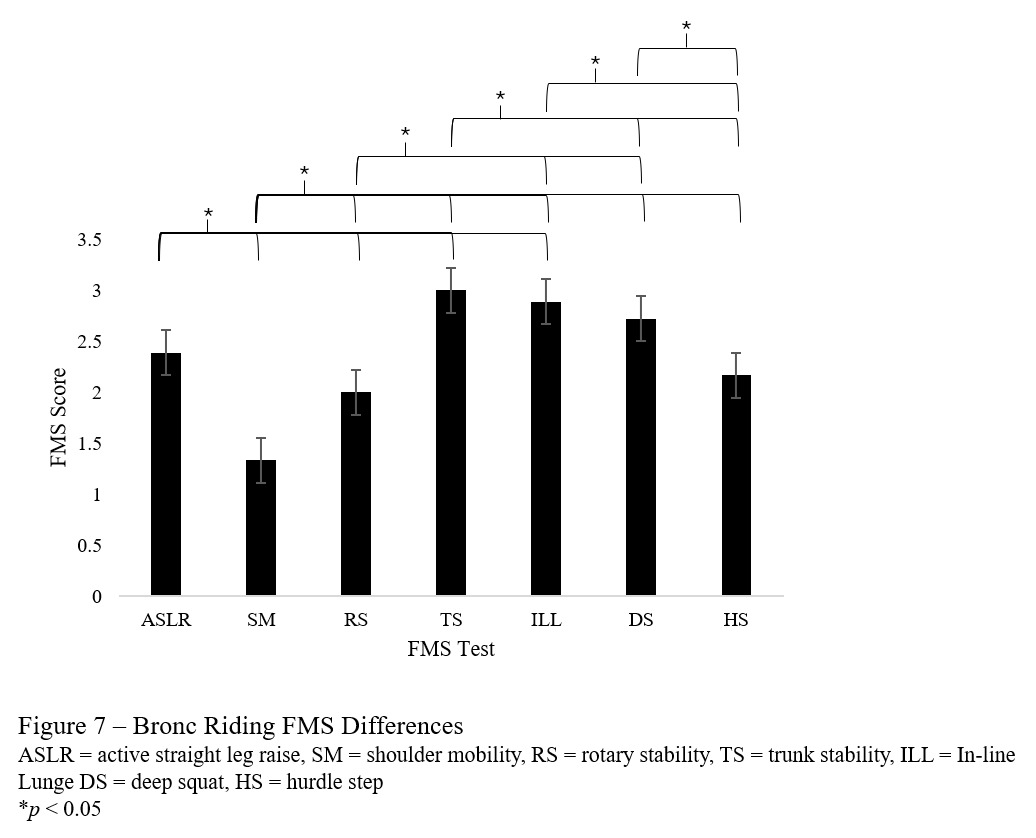
Bronc Riders
The main effect of bronc riding was significant, (F(6,119) = 39.530, p < 0.001), with a partial eta squared of η2 = .699, indicating a large effect size, suggesting bronc riding significantly affects FMS™ scores. Specific differences are outlines in Figure 7.

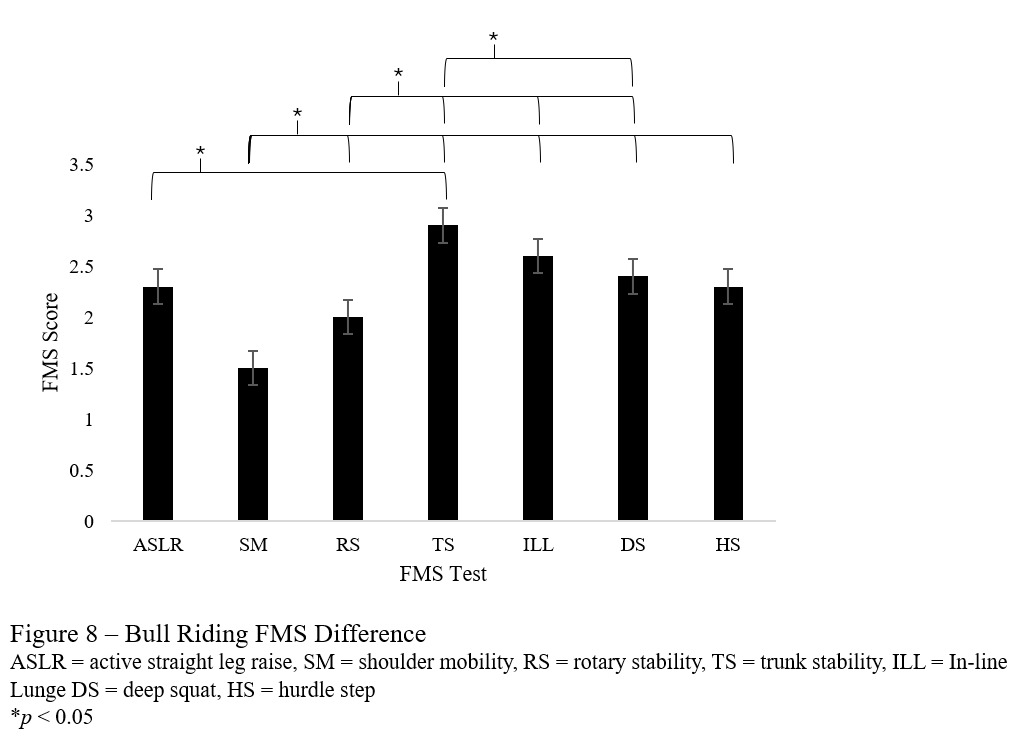
Bull Riders
The main effect of bull riding was significant, (F(6,70) = 6.181, p = 0.003), with a partial eta squared of η2 = .382, indicating a large effect size, suggesting bull riding significantly affects FMS™ scores. Specific differences are outlines in Figure 8.
DISCUSSION
The results of the current investigation indicate that FMS™ scores significantly differ between athletes of the various rodeo events, and all rodeo athletes displayed low FMS™ scores for SM screening. Rodeo athletes are exposed to challenges such as extensive travel times, unexpected ground and livestock contact injuries, as well as asymmetric movement pattern development due to event-specific demands,1,2 which likely explain the observed event differences.
Focusing initially on the FMS™ results of steer wrestling, this investigation identified steer wrestlers’ experiences reduced SM (1.6 ± 0.8, p = 0.056). These findings become valuable when assessing the frequent injuries observed by steer wrestlers. According to Lau et al.; 36 steer wrestlers are apt to experience pectoralis major tendon ruptures. Of the nine documented cases, seven occurred during the throwing phase of the steer, while two resulted from attempts to break a fall. Hiemstra et al.37 examined the surgical management and objective strength measures postoperatively of a complete rupture of the latissimus dorsi tendon in a steer wrestler, and furthermore, reported follow up long term rehabilitation (~1 year) is required to mitigate strength deficits. Given the role of the latissimus dorsi role in adduction, extension, and internal rotation of the shoulder, a complete rupture and recovery schedule such as that reported by Hiemstra et al.37 would be expected to negatively affect shoulder mobility, particularly limiting overhead and rotational movements essential for steer wrestlers. While additional research is needed to further explain the correlation of SM and injuries in steer wrestlers, it is plausible that these types of injuries may be associated with the reduced SM, or the repetitive movement of steer wrestling may negatively affect SM. Nonetheless, the restricted shoulder mobility observed in steer wrestlers warrants cautious supervision and management.
Regarding roping events, breakaway roping and team roping are timed events historically present a decreased risk of injury described throughout the literature compared to rough stock and ground-based events (i.e., steer wrestling, tie down, and goat tying). However, injuries still occur within roping events at an 8% occurrence out of 138 injuries.2,4 Breakaway and team ropers low FMS™ scores in the HS screening (2.0 ± 0.5 and 2.1 ± 0.6, p = 0.603), respectively, may be supported by extended time spent in the saddle – prolonged seated position may increase hip flexor stiffness, reduce gluteal activation, and in turn, negatively affect HS performance. Further investigation is needed to specifically verify the correlation between prolonged horseback riding and HS performance. Pertaining to tie-down ropers, rapid dismounting with high landing impact, accompanied by repeated deep hip flexion and internal rotation are required to successfully complete the event.1–4 These repeated movements likely produce excessive stress on the hip joint, which supports the findings of Box et al.38 who indicated that femoroacetabular impingement symptoms most commonly occur in tie-down ropers among all other rodeo events. Based on movement demands and reported injury data, the displayed low HS FMS™ score (2.1 ± 0.4, p = 0.603), respectively, of tie-down roper was an anticipated outcome.
Rough stock, which includes bull riding, bareback riding, and saddle bronc riding, accounting for 76.6% of all rodeo injuries, and exhibits similar injury frequency to contact-sport athletes.39,40 According to Butterwick et al.7 bull riders suffer the most injuries to the knee and shoulder joint, which may explain limitations in SM. Barrett et al.41 reported additional common injury sites of bronc riders involved the groin (strains and ruptures) and the biceps (strains and ruptures). These common injury sites support the current findings associated with ASLR (1.4 ± 0.8, p = 0.289), HS (2.2 ± 0.4, p = 0.603), and SM (1.3 ± 0.5, p = 0.056) movement limitations in bronc stock riders. While both bronc and bull riding event athletes display substantially low scores across several FMS™ tests, the aggregate score for both events was ≥ 16. The researchers expected the aggregate FMS™ score to match the injury report to a certain degree – high injury rate, low aggregate FMS™ score. However, these findings do not align with previous FMS™ research suggesting aggregate FMS™ score ≤14 correlates with increased risk of injury.26 Furthermore, research exploring the correlation between rough stock aggregate FMS™ and injuries necessitates investigation before injury-prevention implications are employed.
Although previous authors have suggested that timed events such as barrel racing are considered safer than other events; 1,2,4 barrel racers presented the lowest aggregate FMS™ (15.2 ± 2.5, p = 0.438) among all rodeo events. Additionally unanticipated, no literature ties low SM, RS, or HS to movement limitations or injuries reported in barrel racing.42 Similar to ropers, barrel racers may endure prolonged seated position, furthermore, affecting hip flexor stiffness and gluteal activation; thus, potentially decreasing multiple FMS™ scores. Again, future investigations should seek to assess the direct effect of extended horseback on muscle function and movement proficiency. However, while barrel racers display the lowest aggregate FMS™ performance among rodeo events, the total score is not below the “at risk of injury” threshold (≤14) suggested by previous authors; and therefore, not particularly considered problematic.26
Goat tiers were found to have significant movement deficiencies in both mobility and motor control, specifically, in SM (1.6 ± 0.8) and RS (1.9 ± 0.5), respectively. Additionally, HS was marginally low (2.2 ± 0.6) and overall, goat tiers scored second lowest in aggregate FMS™ among rodeo events. There is limited data on injury type in goat tiers other than one study conducted by Hilscher et al.,43 which provides a detailed injury summary based on data collected from high school rodeo athletes, that highlight injury to the lower leg, ankle, and foot occurred most frequently compared to other regions. While specific correlation research deserves exploration, the unilateral, high impact nature of goat tying likely contribute to lower extremity injuries and theoretically affecting movement proficiency in both the RS and HS.
Several limitations are associated with the current investigation and need to be acknowledged. Functional movement screening scores may change throughout a rodeo season, and the current investigation produces suggestions based solely on pre-season results. A longitudinal perspective may help identify the effect of rodeo on FMS™ performance. Rodeo athletes’ physical activity and exercise prior to reporting for fall semester assessments was not accounted for – athletes cognizant of the potential effect of rodeo performance on their movement patterns may have been participating in corrective exercise strategies or training throughout the summer months leading up to fall semester assessments, and furthermore, the effect of corrective strategies on movement compensation may have altered individuals’ FMS™ results. The study necessitated the employment of an alternative statistical approach due to the violation of homogeneity. Future studies should seek to recruit equal participants for each event to avoid heterogeneity of variance. These limitations should be considered, and care must be taken when interpretating the results from this study.
CONCLUSION
To the best of the authors’ knowledge, this was the first study to investigate movement pattern differences among rodeo events using the FMS™. The results of the investigation failed to reject the null hypothesis regarding aggregate FMS™ performance. However, individual FMS™ test performance did differ between and within rodeo events, providing several event-specific novelties regarding distinct event-specific disparities across rodeo domains. Steer wrestling, goat tying, tie-down roping, and bull riding were consistently associated with decrements in SM, ILL, DS, or TS, whereas bronc riding showed improved outcomes in several measures, highlighting the differential musculoskeletal demands across disciplines. Large effect sizes observed reinforce that participation in specific rodeo events meaningfully influences functional movement patterns, with steer wrestling and tie-down roping demonstrating the most pronounced reductions in mobility and stability. These findings underscore the need for event-specific screening. To build upon these results, future research should be conducted to assess the correlation between FMS™ and athletic performance and injury for rodeo athletes. Subsequently, the effect of implementing corrective strategies on rodeo FMS™, sport performance, and overall injury merits examination. Nonetheless, until further empirical research is produced, broad statements generalizing rodeo athletes’ functional movement should be avoided and event-specific considerations are executed.
Conflicts of interest
The author(s) declare that there are no conflicts of interest regarding the publication of this manuscript.