
INTRODUCTION
Medial tibial stress syndrome (MTSS), commonly known as shin splints, is one of the most prevalent running-related injuries (RRIs) affecting both recreational and competitive runners.1 Studies indicate that incidence rates of MTSS were ranging from 13.6% to 20% and found the proportion of injuries prevalence 9.1% of all running injuries with higher prevalence rates reported RRIs among novice runners.2–4 The condition significantly impacts training continuity and athletic performance, often leading to prolonged periods of reduced activity or complete cessation of training.5,6
The biomechanical etiology of MTSS remains complex and multifactorial. Current evidence suggests that excessive foot pronation during the stance phase of running, combined with altered neuromuscular control of the lower limb, contributes significantly to its development.7,8 While foot pronation is a normal motion that facilitates shock absorption, surfaces adaptation, and load transfer during gait and running,9,10 abnormal or excessive foot pronation during mid-stance generates increased traction forces on the tibial periosteum during push-off, potentially causing periosteal inflammation which results in pain along the distal posteromedial tibia.7,8,11–13 Alterations in muscle function, particularly of the ankle plantar flexors and intrinsic foot muscles, further compound this mechanical stress.12,13
Other biomechanical parameters have been implicated in the development of MTSS. Excessive rearfoot eversion has been associated with altered plantar pressure distribution and impaired load transfer.14 In addition, runners with MTSS demonstrate a greater medial shift of the center of pressure (COP) trajectory during stance compared with healthy controls,15,16 reduced cross-sectional area (CSA) of the flexor hallucis longus (FHL) muscle,17 and diminished FHL strength.18,19 Clinical pain outcomes also include pain patterns localized to the distal two-thirds of the posteromedial tibial border.11,12 Additionally, alterations in the structure and function of the FHL muscle have been observed in individuals with MTSS, suggesting their role in both the onset and persistence of symptoms.19
While these biomechanical parameters appear clinically relevant, their reliable measurement remains challenging in clinical settings. Current assessment methods vary widely, from sophisticated laboratory equipment to simple clinical tests.11,20 Advanced tools such as insole pressure equipment,16 force plate systems15 and magnetic resonance imaging (MRI)21,22 provide detailed and precise data, their practical application is often limited by cost and accessibility. Given the need for reliable and clinically feasible measurement tools, single force plate systems present an economical and promising approach for assessing center of pressure parameters that can be readily implemented in various healthcare settings compared to laboratory-based multi-plate or motion capture systems. Despite the importance of these measures for understanding MTSS and monitoring treatment outcomes, there is limited evidence regarding their measurement properties, particularly in terms of reliability. The current review found no relevant studies that specifically investigated the reliability of these measurements in individuals with MTSS. This gap in knowledge makes it difficult for clinicians to confidently use these measurements in diagnosis, treatment planning, and outcome assessment.
Therefore, this study aimed to determine the test–retest reliability and minimal detectable change (MDC) of common biomechanical and clinical outcomes in runners with MTSS. Establishing the reliability of these measurements is essential for developing evidence-based assessment protocols and enabling more effective monitoring of treatment outcomes in this population.
MATERIALS AND METHODS
A reliability study was conducted in runners with MTSS. The sample size was determined using intraclass correlation coefficients (ICC) with an expected reliability of 0.75 and a dropout rate of 20%.23 Based on these parameters, a minimum of 22 participants was required. This study is part of a larger research project that was approved by the Khon Kaen University Ethics Committee in Human Research, Khon Kaen, Thailand. (Reference No. HE662132), the Mae Fah Luang University Ethics Committee on Human Research, Mae Fah Luang University, Chiang Rai, Thailand (Protocol No. EC 23230-25) and registered Thai clinical trials number TCTR20230601008.
PARTICIPANTS
A total of twenty-two participants were recruited for this study. All participants were evaluated by a licensed physical therapist using a history-taking protocol and physical examination for the diagnosis of MTSS.11 The inclusion criteria were: age between 18 and 55 years; pain localized to the distal half of the posteromedial tibial border with a minimum length of 5 cm; exercise-induced pain; and pain during running rated between 4 and 7 on the Visual Analog Scale (VAS), with symptoms persisting for at least three weeks. Additional criteria included a body mass index (BMI) ≤30 kg/m², a minimum of three months of running experience, and a running frequency of at least two sessions per week for 45 minutes or a minimum of 10 km. per week, but not exceeding 100 km. per week. Exclusion criteria were neurological disorders; lower limb or spinal injuries within the prior three months; a history of seizures or pacemaker use; chronic disease or stroke; pregnancy or breastfeeding; and rigid flatfoot. All participants received a comprehensive explanation of the study procedures and provided written informed consent prior to enrollment.
PROCEDURE
Test-retest (intra-rater) reliability was assessed by two licensed physiotherapists (PN and ES), each with at least five years of experience in musculoskeletal physical therapy. To ensure blinding, data from the two testing sessions were recorded on separate data sheets by a research assistant (WC). Both assessors were thoroughly familiarized with the testing protocol prior to data collection. Participants were evaluated for pain level and all outcome measures on two separate days with a three-day interval between sessions, during which they maintained their normal daily activities.24,25 All assessments were conducted on the affected limb. For participants with bilateral symptoms, the dominant leg was designated as the test limb for data analysis. All measurements followed a consistent sequence with a standardized 5-minute rest period between each test. The assessment protocol included: (1) center of pressure (COP) trajectory during running (completed by PN), (2) linear pain distance on palpation along the posteromedial tibial border (completed by ES), (3) cross-sectional area (CSA) of the flexor hallucis longus (FHL) muscle (completed by PN), and (4) FHL muscle strength (completed by ES). This sequence was maintained across both testing sessions for all participants.
OUTCOMES MEASUREMENT
Center of Pressure (COP) trajectory during Running
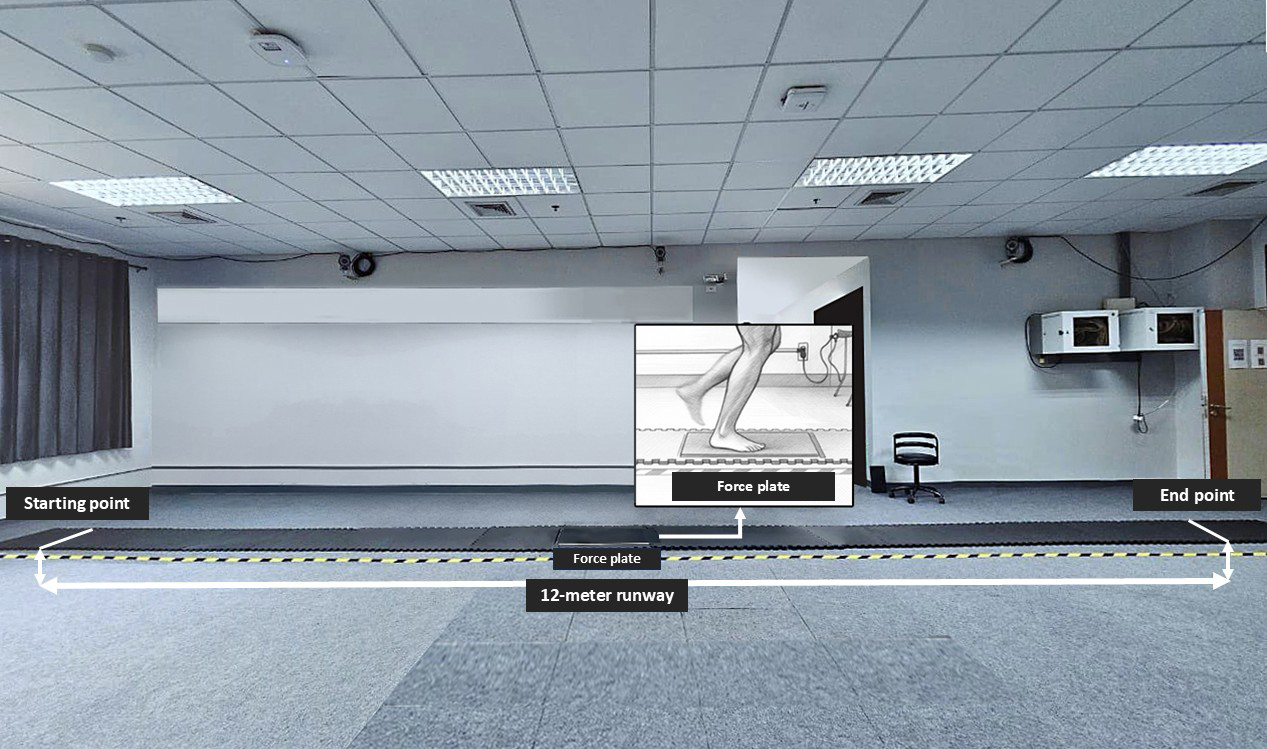
The COP trajectory was measured using a force distribution measurement system (Zebris FDM-S Medical GmbH, Germany), dimension 69 x 40 x 2.1 cm. (L x W x H) with 2,560 sensors. To prevent the participants from triggering the sensors, the non-active white area of the plate, which contains no sensors, was covered with black masking tape. The force distribution measurement system was positioned at the center of a 12-meter runway constructed from black rubber foam board, which was securely fixed to a non-slip floor to ensure stability and protect against sway (Figure 1).
_trajectory_during_running_measured_by_the_force_distribution_meas.jpeg)
The COP trajectory was measured once during the stance of the affected foot. Subjects ran barefoot at a jogging velocity of 3.3 ± 0.16 m/s along the runway, monitored by a stopwatch, yielding a finishing time range of 3.14 to 3.46 seconds.15 Since the dimensions of the force distribution measurement system were suitable for only one stance foot, participants were asked to run along the runway twice to familiarize themselves with the setup and adjust their stride length to ensure that the expected foot would be placed on the force distribution measurement system during running. Participants started at the starting line, and the rater calibrated the force distribution measurement system program before each trial. The rater then initiated the test by pressing the start button and giving the command, “Ready, set, go.” After the participants completed the run and their stance foot was placed on the force distribution measurement system, the rater pressed the stop button to conclude the trial.
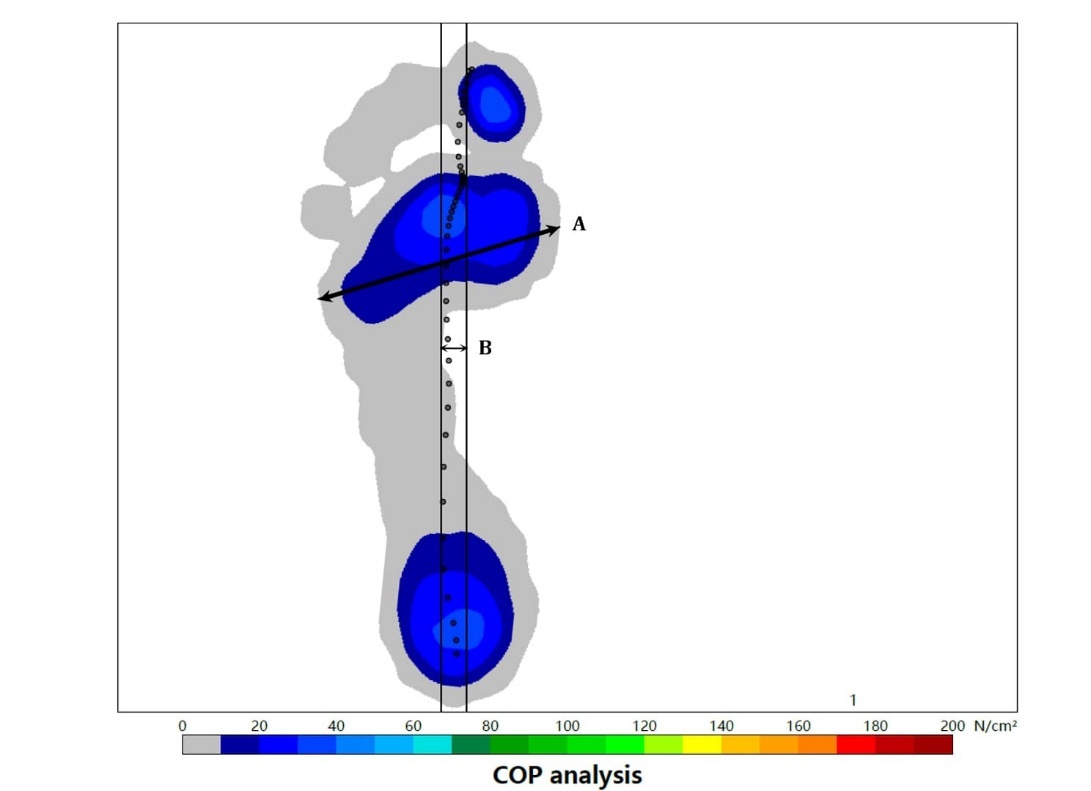
The COP path image was exported from the Zebris software program, and the COP shift was defined using Adobe Illustrator (Adobe, Inc., San Jose, CA). The shift was measured from the most medial to the most lateral point in millimeters and then divided by the maximum foot width, multiplied by 100, to express the result as a percentage of transverse shift (%transverse) (Figure 2). A lower percentage of transverse shift indicates a more medial shift of the COP under the foot.16
_trajectory_during_running.jpeg)
Linear Pain Distance on Palpation along the Posteromedial Tibial Border
Participants were assessed in the supine position. The assessor flexed the affected knee and allowed the lower leg to relax. The assessor then palpated the area of diffuse pain, starting from the medial malleolus and extending along the distal two-thirds of the posteromedial lower leg, following the posteromedial border of the tibia. The first pain point was identified and marked, then the assessor continued to palpate along the medial tibial border. The subject was asked to indicate the point where pain was no longer present, and this endpoint was marked. Palpation was performed once following the clinical test protocol, and linear pain distance was measured using a tape measure and recorded in centimeters.20
Cross-sectional Area (CSA) of the Flexor Hallucis Longus
The CSA of the flexor hallucis longus (FHL) was measured by ultrasound imaging with a 12 MHz linear transducer (Toshiba Famio 30, Toshiba Medical Systems Corporation, Japan). Participants were evaluated in a prone position with the affected foot over the edge of the table. The rater measured their lower leg length from the mid-point between the medial and lateral epicondyle of the femur to the center of the heel at the edge of the calcaneus and marked the midpoint of the calf. The ultrasound probe was placed on the transverse axis at the mid-calf lateral to the fibula.26,27 Participants were instructed to flex their great toe at the distal phalanx to assist the rater in localizing the FHL muscle. The CSA was measured in square centimeters (cm2) using the trace function of the ultrasound imaging machine. This test was performed three trials, with all markers removed and a 2-minute interval between trials. The mean of the three measurements was recorded and analyzed.
Flexor Hallucis Longus (FHL) Muscle Strength
Participants were assessed in the supine position. The rater measured the FHL muscle strength using the maximal voluntary contraction (MVC) technique. Participants were asked to flex and push their great toe at the distal phalanx against the padded curve of a hand-held dynamometer (The Baseline® hydraulic push-pull dynamometer, Fabrication Enterprises Inc., USA) with maximal force. To minimize movement from the ankle and other toes, the rater positioned the participant’s heel at the edge of the table and provided passive movement and guidance as needed to ensure correct positioning before starting the test. The rater then instructed the participant to “Start” and encouraged them to push with their maximum force for 5 seconds. The test was performed in 3 trials, and rested for a 15-second rest between trials.18 The strength was recorded in kilograms (kg.) and the average force values from sessional three trials were analyzed.
DATA ANALYSIS
Data analyses were conducted using software SPSS version 29 (IBM Corp, Armonk, NY, USA.). The Shapiro-Wilk test was used to assess the data normal distribution. Descriptive statistics were used to describe the subject characteristics, including means and standard deviations for the continuous variables and number or percentage for the categorical variables. The paired t-test was used to analyze the differences of each measurement between two sessions of assessment, with the significance different level as p-value < 0.05. Intraclass correlation coefficients with 95% confidence intervals were calculated with a two-way mixed effects model, absolute agreement for test-retest reliability.24 The ICCs values were indicated as poor (<0.5), moderate (0.5 - 0.75), good (0.75 - 0.90) and excellent (0.91 - 1.00).28
The standard error of measurement (SEM) reflects the variability within subjects across repeated measurements in a group of individuals.29 SEM was calculated using the pooled standard deviation of two sessions (SD pooled) x The minimal detectable change (MDC) is the minimal change that, beyond measurement error, indicates a true change for an individual and was calculated by 1.96 x SEM x . The Bland-Altman plot determined the levels of agreement for test-retest measurements. The limits of agreement were calculated for the lower bound, which was mean difference - (1.96 x standard deviation of difference), and the upper bound, which was mean of difference + (1.96 x standard deviation of difference).30 Data was interpreted as 95% of the data points should be within ±2SD of the mean difference.
RESULTS
Characteristics of Participants
Twenty-two participants completed the study protocol, including 18 females (81.82%) and four males (18.18%), with a mean age of 25.73±7.01 years. The mean duration of pain symptoms was 48.64±20.94 days. The characteristics and running information of all participants are presented in Table 1. The pain level was assessed using the visual analog scale (VAS) and all outcomes from separate measurement days were analyzed using paired t-test, which showed no significant differences (p-value > 0.05) as reported in Table 2.
Test-retest Reliability
The test-retest (intra-rater) reliability was good to excellent, with ICC ranging from 0.82 to 0.94. Outcomes with excellent test-retest reliability included the COP (ICC3,1=0.92) and linear pain distance on palpation along the posteromedial tibial border (ICC3,1=0.94). Outcomes with good reliability included CSA of the FHL (ICC3,3=0.82) and FHL strength (ICC3,3=0.88).
The SEM and MDC for each outcome were as follows; COP at 0.86% and 2.38%, linear pain distance on palpation along the posteromedial tibial border at 0.77 cm and 2.12 cm, CSA of the FHL at 0.23 cm² and 0.63 cm², and FHL strength at 0.54 kg and 1.49 kg, respectively. Test-retest reliability results including ICC, SEM and MDC are presented in Table 3.
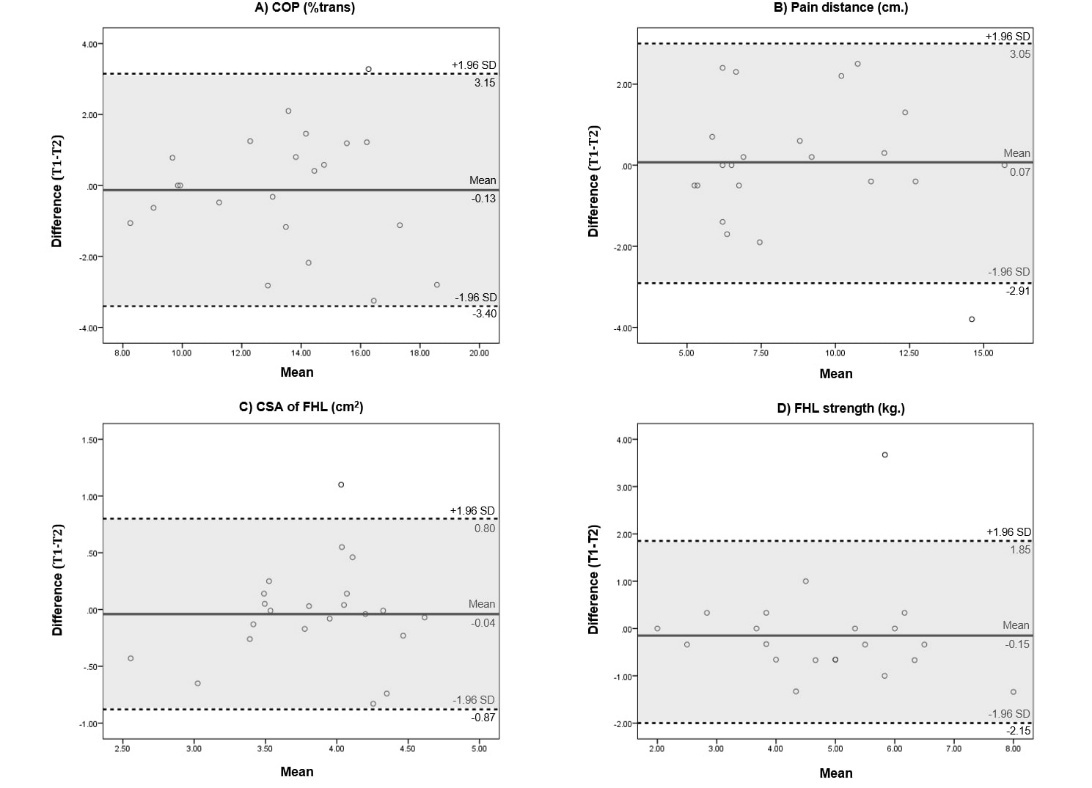
The Bland-Altman plot shows the mean difference and 95% of the data points were within ±2SD of the mean difference for all outcomes (Figure 3).
DISCUSSION
This study evaluated the test-retest reliability of common biomechanical and clinical outcomes related to the biomechanical etiology of MTSS in runners, including the center of pressure (COP) trajectory during running, linear pain distance on palpation along the posteromedial tibial border, cross-sectional area (CSA), the strength of the flexor hallucis longus (FHL) muscle, and calculated the MDC variables for these measurements in runners with MTSS. The intraclass correlation coefficients (ICCs) ranged from good to excellent (ICC 0.82 - 0.94). The reliability established in this study supports the clinical utility of these biomechanical measurements in MTSS assessment and management.
This study utilized a custom-setting sensor force distribution measurement system placed at the center of the 12-meter runway to assess the COP trajectory during running in MTSS. The COP was calculated as the percentage of transverse shift, and found the excellent reliability ICC value of 0.92. The COP under the foot variables were evaluated in previous studies with different methods.16,31,32 Kinoshita et al.16 evaluated the COP outcomes based on biomechanical problems of MTSS, specifically COP shifting, using the percentage of transverse shift of the COP but did not report the reliability. While no reliability data have been reported for COP measurements in MTSS cases, previous studies have documented the reliability of COP measurements under the foot using force distribution measurement sensors. Lynall et al.33 assessed the COP path under foot during walking in healthy subject using the force plates (Bertec Corp., Columbus, OH) embedded in a 6-meter walkway with five days between measurements. They reported good to excellent reliability with ICC ranging from 0.89 to 0.95. In this previous study, the test was repeated if participants failed to placed their foot on the force plates correctly similarly to this current study. However, in the current study, participants were asked to practice twice before start the test to estimate their step length, with the goal of minimizing the need for repeated trials. Although different tasks and devices were used in this study, the sensor force distribution measurement system employed was similar to those used in previous studies examining COP in cases of MTSS. The high reliability of COP measurements observed in this study supports their utility in assessing foot biomechanics and guiding program interventions. To improve ecological validity, COP may also be evaluated under shod conditions, as footwear alters foot mechanics.34
The palpable linear pain distance at the posteromedial tibial border was the essential criterion for diagnosing the MTSS.11,35 Previous studies using the difference technique to measure the pain along the posteromedial border of the tibia using the algometer pressing technique found moderate to excellent intra-rater reliability (ICC 0.53-0.90) in asymptomatic runners.36 Newman et al.20 determined the predicted onset of MTSS and found that the clinical test shin palpation test (SPT) is related to the condition of MTSS. In the present study, the technique applied followed the SPT to measure the actual distance of pain as confirmed by the subjects to diagnose and define the linear pain distance on palpation along the posteromedial tibial border. The results showed an excellent test-retest reliability ICC value of 0.94. No previous studies have reported the reliability of this method; however, the pain palpation following the SPT indicated the same area of crural fascia attachment associated with MTSS lesion, suggesting its suitability for this technique.37 The reliability of linear pain distance on palpation along the posteromedial tibial border measurement confirms its value as a diagnostic and monitoring tool, enabling clinicians to document and track symptoms objectively.
The FHL contributes to stabilizing the longitudinal arch of the foot. It originates from the distal two-thirds of the posterior surface of the fibula and passing along the intermuscular septum and deep crural fascia within the posterior compartment of the lower leg where traction-induced periostitis associated with MTSS typically occur during the push-off phase of running.38 Mattock et al.19 investigated lower leg muscle structure in runners with MTSS and found the CSA of FHL was smaller in MTSS leg compared to the asymptomatic leg prior to collecting data, the assessor conducted a reliability test, which reported high reliability for CSA measurement (ICC = 0.93). Previous study on healthy individuals have reported excellent inter-rater reliability for measuring CSA of FHL muscle with ICC of 0.91.39 Moreover, Mickle et al.25 demonstrated the reliability of ultrasound imaging for assessing the CSA of FHL muscle in healthy adult located two anatomical locations at 40% and 50% of the lower leg length from the medial malleolus to the tibial condyle reporting ICC value of 0.92 and 0.98, respectively. In the present study, the measurement was applied at the mid-calf that approximately 50% of the lower leg length, and showed good test-retest reliability ICC value of 0.82 that supporting the reliability of this probe location for evaluating the CSA of FHL muscle.
FHL strength has been identified as a factor related to MTSS. A previous study reported reduced strength in the symptomatic leg of MTSS runners evaluated by a hand-held dynamometer.19 Although this study demonstrated acceptable reliability for lower leg strength (ICC>0.78), it did not report specific reliability data of FHL strength.19 There is no study have reported the reliability of FHL strength measurements using a hand-held dynamometer in runners with MTSS. However, FHL strength has been reported intra-rater reliability in healthy active adults using different protocol and models of hand-held dynamometers, researchers found ICC ranged from 0.68 to 0.92, indicating good to excellent reliability.40 Another study, which measured great toe flexor muscle strength using the intrinsic foot dynamometer, also reported good to excellent intra-rater reliability, with ICC values ranging from 0.86 to 0.87.41 The present study found good intra-rater reliability for FHL strength, with an ICC value of 0.88, which is consistent with the reliability values reported in previous studies.41 This suggests that the current protocol provides reliable parameters for rehabilitation planning and monitoring progression in MTSS cases.
The reported MDC values provide clear thresholds for identifying clinically significant changes, while the SEM values assist in interpreting measurements. Currently, there are no published reports specifying the values for tests used for MTSS. This study employed standardized and reliable measurements using readily accessible clinical equipment, enabling evidence-based assessment and treatment monitoring for runners with MTSS.
A strength of this study is that participants were assessed for baseline variables prior to each testing session, with no significant differences found in pain level and all outcomes between sessions, indicating that symptoms remained stable across both days. Participants also maintained their usual daily routines, reducing the influence of external factors during the rest period between sessions. Additionally, the experienced raters underwent protocol familiarization prior to testing, and a research assistant recorded the data to maintain assessor blinding of recorded values across sessions.
LIMITATIONS
This study has some limitations to consider. First, the sample consisted exclusively of recreational runners with MTSS, which limits the generalizability of the findings to other populations such as long-distance or competitive athletes, whose running mechanics and biomechanical demands may differ substantially. Consequently, these results may not be directly applicable to high-performance runners. Future research should evaluate these assessment protocols across diverse athletic populations with varying training volumes. Second, all assessments were performed by experienced raters who were highly familiar with the testing procedures. To ensure consistent reliability in clinical and research settings, novice assessors should undergo structured training and supervision before independently applying these protocols.
CONCLUSION
The biomechanical measures and clinical pain outcomes demonstrated good to excellent reliability including COP trajectory during running (ICC3,1 = 0.92), linear pain distance on palpation along the posteromedial tibial border (ICC3,1 = 0.94), FHL CSA (ICC3,3 = 0.82), and FHL strength (ICC3,3 = 0.88) with established test-retest protocols. These findings provide clinically relevant reference values for minimal detectable change and standard error of measurement that distinguish true clinical changes from measurement variability. The assessment protocols offer reliable, clinically feasible tools for monitoring rehabilitation progress and evaluating intervention effectiveness in recreational runners with medial tibial stress syndrome. Future research should explore applying these protocols across diverse clinical settings and evaluate their sensitivity to change following various interventions.
CONFLICTS OF INTEREST
The authors declare no conflicts of interest.
FUNDING
This work was supported by Thailand Science Research and Innovation (TSRI) Fundamental Fund (FF) NRIIS project code 203264 and The Graduate Student Dissertation Support grant, The Faculty of Associated Medical Sciences, Khon Kaen University, Thailand.
ACKNOWLEDGEMENT
The contributions of Dr. Supannikar Yingyongsaksri, Dr. Chatchada Sutalangka, are gratefully acknowledged for their essential support and coordination. Appreciation is also extended to all participants for their valuable involvement in this study.