INTRODUCTION
Midportion Achilles tendinopathy is an injury to the Achilles tendon that occurs approximately 2-7cm proximal to the tendon’s insertion on the calcaneus.1,2 This injury affects individuals across all ages and activity levels.3,4 It is characterized by pain during tendon loading activities, reduced ability to exercise and participate in daily life, and diminished overall health.1,2 The Achilles tendon is composed of three subtendons arising from the medial and lateral gastrocnemii and soleus muscles, which spiral as they descend toward their insertion on the calcaneus.5 In addition to pain symptoms, tendinopathy is associated with structural changes within the tendon, such as fusiform thickening and increased cross-sectional area, which can be identified using ultrasound imaging.6–8 Tendon structural changes are clinically relevant, being associated with greater symptom severity and predictive of symptom development in asymptomatic individuals.6,9 However, imaging is not considered necessary for diagnosis and is often not available in standard clinical practice. Thus, clinicians often rely on pain to guide diagnosis, treatment, and prognosis. Although pain is widely used in this context, there is limited evidence on how specific pain measures correspond with tendon pathology, representing an important gap in current knowledge.
Pain represents a primary and easily obtainable clinical measure in the assessment of midportion Achilles tendinopathy but its relationship with structural tendon changes remains unclear.9–11 In clinical practice, pain can be evaluated using a variety of approaches – some are clinician-administered while others are self-reported – but all aim to capture aspects of the patient’s pain experience. Palpation of the tendon is a key component for Achilles tendinopathy diagnosis, as it is simple, reproducible, and reliable for identifying local tenderness and thickening of the Achilles tendon.12,13 The Victorian Institute of Sport Assessment – Achilles (VISA-A) questionnaire is commonly used to assess overall symptom severity and disability related to Achilles tendinopathy.14 Pressure algometry, which applies gradual pressure to quantify the minimum force that elicits pain, provides an objective measure of pain sensitivity.15 Another common approach is assessment of pain during tendon loading, such as during single leg hopping, which reflects a functional component of pain and has been incorporated as a core outcome in Achilles tendinopathy research.16,17
Prior work suggests that lower pain on palpation and pain with loading at baseline may predict better clinical improvement over time, but it is not known whether these other commonly used pain assessments relate to the degree of pathological structural change.18 Understanding whether clinical pain measures reflect underlying structural pathology may be of benefit for clinicians, as exercise treatment is aimed at both symptom reduction and improving tendon structure. This may improve interpretation of pain findings during examination and offer prognostic insight without relying on imaging.
Therefore, this study aimed to (1) investigate the relationship between diverse clinical pain measures – pain on palpation, recall pain, pain pressure threshold (PPT), and pain during hopping – and pathological tendon structure in individuals with midportion Achilles tendinopathy, and (2) determine whether these pain measures represent overlapping or distinct features of the pain experience. Together, this work aims to clarify how clinical measures of pain correspond with structural tendon pathology, providing a more comprehensive understanding of midportion Achilles tendinopathy.
METHODS
This study was a cross-sectional design including data from participants with midportion Achilles tendinopathy from a clinical trial evaluating sex differences in recovery with exercise treatment (Clinical Trial #: NCT03523325). Measures of pain, tendon structure, lower extremity function, and patient reported outcomes were obtained at the baseline research visit and used for this analysis. In instances of bilateral symptoms, only the most symptomatic limb as identified by the participant was used in the analysis. This study incorporated measures from the core outcome set for Achilles tendinopathy (COS-AT), including the VISA-A, single leg heel rise endurance testing, and pain during loading.16 The study was approved by the University of Delaware Institutional Review Board. The enrollment period for this study was from 07/2018 – 01/2023.
Participants
Inclusion criteria were having a diagnosis of midportion Achilles tendinopathy and being between 18-65 years of age. Diagnostic criteria for midportion Achilles tendinopathy included patient report of pain within the Achilles tendon that worsens with functional activities and pain during palpation of the midportion of the tendon. Exclusion criteria were: (1) previous Achilles tendon rupture, (2) Achilles tendon injection within the prior 6 months, (3) any other injury affecting the ability to perform exercises in the treatment protocol. Participants were recruited using local advertisement, social media, google advertisement, and through referral from physicians and physical therapists. All participants provided informed consent.
Clinical Exam
Participants lay prone on the table with their feet and ankles resting off the edge of the table. Ultrasound imaging was used to identify the proximal calcaneal notch and area of maximal tendon thickness. These locations were marked, and the area of maximal tendon thickness was utilized as the site of both pain on palpation and pain pressure threshold (PPT) testing. If no identifiable area of maximal tendon thickness was present the site of greatest pain on palpation was marked and used for pain on palpation and PPT testing.
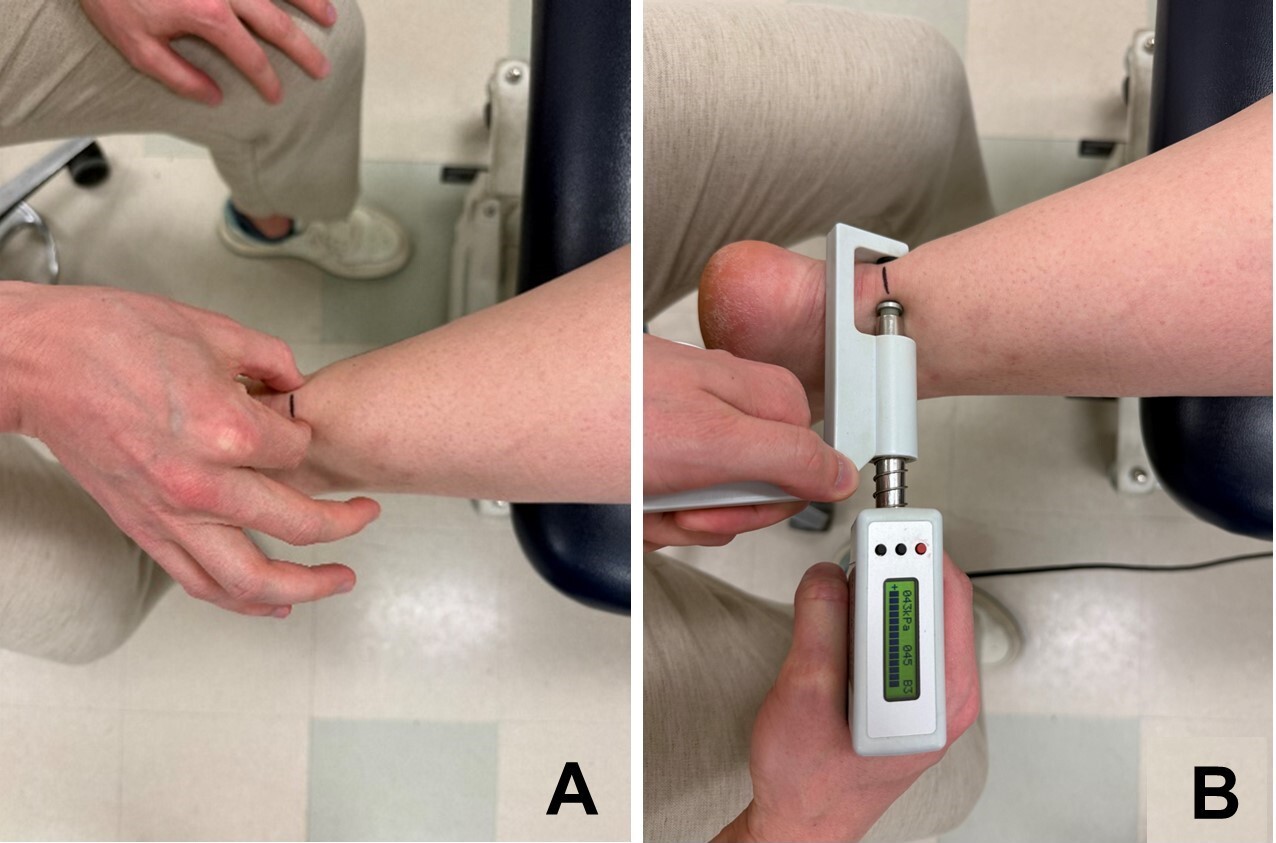
Pain on palpation was performed by squeezing the medial and lateral aspects of the midportion of the Achilles tendon between the thumb and index finger (Figure 1a). Participants reported their pain on palpation utilizing the Numeric Pain Rating Scale (NPRS), where 0 indicates no pain and 10 indicates worst pain imaginable, and the pain intensity was used for analysis.19 PPT (Figure 1b) was performed at the location of maximal pain on palpation using a mechanical algometer (SBMedic, Solna, Sweden). Pressure was applied simultaneously to the medial and lateral sides of the tendon over a contact area of 1cm2 at a rate of 30kPa/s. Participants were instructed to press a response button the first moment that the pressure sensation became painful; the pressure reading at this moment was then recorded. An average of three trials for the PPT was utilized for analysis.
_pain_on_palpation_and_(b)_pain_pressure_thresho.jpg)
Tendon Structure
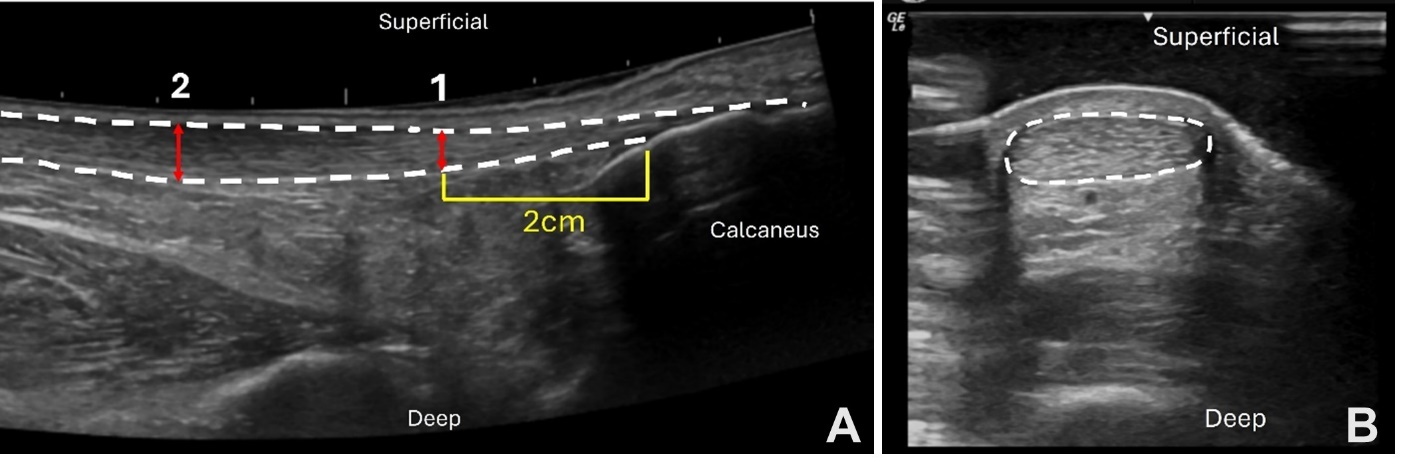
The detailed methods utilized to assess the following tendon structure variables have been previously described.20 Ultrasound imaging (GE LOGIQ e; GE Healthcare, Chicago, Illinois) was performed using the B-mode ultrasound and a 5cm linear array transducer set to a frequency of 10Hz and a depth of 3.5cm. Achilles tendon thickness (mm) was assessed as the area of maximal anterior to posterior tendon thickness per visualization upon ultrasound imaging. The degree of Achilles tendon thickening (mm) is a measure of Achilles tendon pathology.6 This was assessed by subtracting the thickness of healthy Achilles tendon at 2cm (or an adjusted location if thickening was present at 2cm) from the maximal tendon thickening (Figure 2a). Achilles tendon cross-sectional area (CSA, mm2) was measured with the ultrasound probe in short axis using a gel-standoff pad to increase visibility of the Achilles tendon (Figure 2b). CSA was measured at the marked location for maximal tendon thickness. Images were exported and measured (Osirix Dicom Viewer; Pixmeo SAL, Bernex, Switzerland) and the mean of three images was used for analysis.
_degree_of_achilles_tendon_thickening_.jpeg)
Patient Reported Outcomes
Patient self-reported past medical history, injury information, and symptom severity were collected via questionnaires. Symptom severity was assessed with the Victorian Institute of Sports Assessment – Achilles (VISA-A). VISA-A is an 8-item questionnaire specific to Achilles tendon injury with scores ranging from 0-100, with a higher score indicating less symptoms.14,21 Average pain over the prior seven days was assessed using a NPRS where 0 indicates no pain, and 10 indicates worst pain imaginable. Pain Catastrophizing Scale (PCS),22 Tampa Scale for Kinesiophobia-17 (TSK-17),23 and the Physical Activity Scale (PAS)24,25 were utilized to describe patient characteristics, assessing pain catastrophizing, kinesiophobia, and physical activity respectively (Table 1).
Single Leg Hopping and Heel Rise Endurance
Participants performed 25 single leg hops in a continuous rhythmic pattern and were immediately asked to rate their pain using the NPRS after completion.26 The greater of the pain ratings from the two trials was used for analysis. A MuscleLab® (Ergotest Technology, Oslo, Norway) system was used for the heel rise endurance testing. Single leg heel rise endurance was performed with the participant standing on a 10˚ incline slant box.26 Participants were instructed to perform as many repetitions as possible to their maximum height until fatigued. A linear encoder was attached to the back of the participants’ heel to measure the number of repetitions and height of each heel rise. Heel rise work (J) was calculated by the following calculation: total heel rise height (m) x body weight (N). If a participant declined completing a functional test, no value was recorded for those tests.
STATISTICAL METHODS
Study data were collected and managed using REDCap electronic data capture tools hosted at the University of Delaware.27,28 REDCap (Research Electronic Data Capture) is a secure, web-based software platform designed to support data capture for research studies. Statistical analyses were performed with IBM SPSS Statistics (version 29.0, SPSS, Chicago, Illinois). The total sample size differs across measures and analysis due to algometer malfunction (12), excessive calcifications preventing accurate ultrasound measurement (1), and missing images (3). Data were excluded pairwise within analysis for correlations, and listwise for linear regression. Normality was assessed using Shapiro-Wilk testing. For normally distributed data, Pearson correlation coefficients were calculated, while Spearman correlation coefficients were used for non-normally distributed data. Where there were significant relationships between pain measures and Achilles tendon structure linear regression analysis was performed. For all statistical tests, α was set at 0.05.
RESULTS
A total of 182 participants (103 females, mean age of 47 years, and BMI of 28.8kg/m2) with midportion Achilles tendinopathy were included in this study. Participant characteristics are presented in Table 1. Pain ratings, Achilles tendon structure, and lower extremity functional measures are also presented in Table 1.
Pain on Palpation and Other Clinical Pain Measures
Pain on palpation had a weak29 significant relationship between PPT (r = -0.39, p<0.001) and VISA-A (r = -0.28, p<0.001). There were weak to moderate29 significant relationships between pain on palpation and pain with hopping (r = 0.33, p<0.001), and average pain intensity over the last week (r = 0.42, p<0.001). PPT had a weak29 significant relationship with pain with hopping (r = -0.19, p = 0.017), average pain intensity over the last week (r = -0.23, p = 0.002) and VISA-A (r = 0.29, p<0.001). Pain with hopping had a weak29 significant relationship with VISA-A (r = -0.35, p<0.001), and a moderate29 significant relationship with average pain intensity over the prior week (r = 0.44, p<0.001).
Clinical Pain Measures and Tendon Structure
Pain on palpation had weak29 significant relationships between Achilles tendon thickness (r = 0.20, p =0.007) and Achilles tendon CSA (r = 0.21, p = 0.005). There was no significant relationship between pain on palpation and degree of tendon thickening (p = 0.058). There were no significant relationships for VISA-A, PPT, pain with hopping, or average pain intensity over the last week with any of the tendon structural measures (Table 2).
Pain on Palpation as a Predictor of Tendon Structure
Linear Regression (Table 3) was used to examine the relationship of pain on palpation with tendon thickness, degree of tendon thickening, and tendon CSA, while controlling for PPT. The overall models for tendon thickness, (R2 = 0.06, F(2,167) = 4.97, p = 0.008), and tendon CSA (R2 = 0.05, F(2,164) = 4.73, p = 0.010) were significant, while degree of tendon thickening was not significant (R2 = 0.030, F(2,166) = 2.569, p = 0.080). Pain on palpation was a significant positive predictor of tendon thickness (b = 0.03, p = 0.002), degree of thickening (b = 0.02, p = 0.028), and tendon CSA (b = 0.04, p = 0.003) when controlling for PPT. PPT was not a significant predictor in any of the models (all p>0.223).
DISCUSSION
This study investigated whether clinical pain measures are related to pathological Achilles tendon structure, and whether these measures represent overlapping or distinct aspects of pain in individuals with midportion Achilles tendinopathy. Pain on palpation, recall pain, pain with hopping, and symptom severity are all weak to moderately correlated, suggesting they capture some shared components of the pain experience. Importantly, among these measures, pain on palpation was uniquely associated with pathological tendon structural changes. This relationship persisted even after adjusting for pain sensitivity (PPT). As sensitivity to pain may lead to greater pain intensities during pain on palpation,30 this indicates that pain on palpation reflects more than just generalized sensitivity – it provides clinically meaningful information about tendon pathology. This finding reinforces the clinical utility of pain on palpation, as it provides insight into tendon pathology without requiring imaging. It highlights palpation as a particularly valuable clinical measure that bridges the gap between patients’ reported symptoms and underlying tendon structure.
Pain is a primary reason patients seek care for Achilles tendinopathy, making it essential for clinicians to thoroughly understand patients’ pain to guide both diagnosis and treatment. In this study, while all measures of pain were correlated, the strength of these relationships ranged from weak to moderate (|r| = 0.187 – 0.505). As anticipated, higher pain ratings on measures using the NPRS, including pain on palpation, average pain intensity over the last week, and pain with hopping, were associated with lower pain sensitivity (PPT) and greater symptom severity/disability (VISA-A). These findings suggest that, while these pain measures are related and collectively fall within the symptom domain of tendon health,31,32 they provide complimentary information about the pain experience and may all be useful in the clinical setting to understand patients’ symptoms and symptom severity.
Pain on palpation has long been considered a component of the diagnosis for Achilles tendinopathy, as it is useful for identifying the location of the injury and ruling out differential diagnoses.2,12 Pain ratings obtained via palpation can provide insight into the effectiveness of treatment, where a reduction of 2 points on the NPRS is associated with patients’ perceived improvement.33 A strong correlation between pain on palpation and pain pressure threshold was hypothesized; however, the results indicate a weak relationship, suggesting that these measures cannot be substituted for each other. Additionally, pain pressure threshold appears to be unrelated to pathological Achilles tendon structure, implying that sensitivity to pain may remain constant despite pathological tendon changes. In contrast, pain on palpation was significantly related to pathological tendon structural changes, where greater pain ratings are related to worse Achilles tendon structure. Overall, the findings indicate that clinicians can use pain on palpation not only to localize symptoms but also to gain insight into underlying tendon pathology, supporting its role in diagnosis and ongoing management.
The role of tendon structure in the diagnosis and prognosis of Achilles tendinopathy has been a debated and evolving topic in research.10,11,34 Various models of tendinopathy, such as those proposed by Leadbetter35 and by Cook and Purdam,36 suggest that structural changes often precede symptom onset, and that symptom recovery typically occurs before structural recovery.35,36 Recent evidence supports a link between Achilles tendon structure and symptoms, showing that asymptomatic midportion Achilles tendinopathy identified via ultrasound imaging (greater tendon thickness, degree of tendon thickening, tendon CSA) predicts symptom development, increases the risk of tendinopathy,37,38 and predicts worse recovery outcomes following progressive loading treatments.6 Additionally, findings from this study highlight that pain on palpation is significantly related to pathological Achilles tendon structure, making it a likely valuable diagnostic and prognostic tool. In clinical practice, the association between greater pain on palpation and worse tendon structure may offer clinicians an accessible and practical method to aid in understanding injury severity and assist with prognosis and recovery expectations.
There are limitations to note within this study. Pain ratings at the point of pain pressure threshold were not obtained. It could be assumed, as participants were asked to stop the measure at the first moment of pain, that the pain rating should be a 1/10 on the NPRS. Future studies may want to collect this data, as individuals may experience different levels of pain at the sensory transition which could provide more information on the pain experience. Second, this study included only those diagnosed with midportion Achilles tendinopathy and these same relationships between pain measures and Achilles tendon structure may not be generalizable to those with insertional midportion Achilles tendinopathy.
CONCLUSION
Taken together, these findings support pain on palpation as a simple, accessible, and clinically valuable measure in the evaluation of suspected midportion Achilles tendinopathy. Pain on palpation reflects unique aspects of the patient’s pain experience not captured by other assessments, and importantly, it was the only pain measure that corresponded with pathological tendon structural changes identified on ultrasound imaging. These results reinforce the role of palpation as a core component of clinical examination, providing clinicians with meaningful insight into both patient symptoms and underlying tendon pathology. Continued use of pain on palpation in clinical practice may aid diagnosis, guide treatment decisions, and help set recovery expectations in individuals with midportion Achilles tendinopathy.
Corresponding Author
Karin Grävare Silbernagel
Department of Physical Therapy
University of Delaware
STAR Health Sciences Complex
540 S. College Avenue, Suite 210
Newark, DE 19713
Phone: 302-831-4804
Email: kgs@udel.edu
Disclosures
The authors declare that they have no conflicts of interest relevant to this work.