

INTRODUCTION
Sports injuries occur in 20–30% of athletes, with 37–68% of these injuries attributed to overuse mechanisms.1 Long-distance runners are at particularly high risk due to high training volumes and repetitive loading of the lower leg, leading to cumulative stress on its musculoskeletal structures.2,3 Understanding and preventing the pathophysiology of overuse injuries is critically important, yet current assessment methods rely primarily on self-reported questionnaires, with limited objective evaluation tools available. Many athletes continue to train and compete while experiencing physical problems, resulting in frequent underestimation of overuse-related conditions.4
Running athletes with overuse injuries often report symptoms such as tightness or heaviness in the lower limbs. These symptoms may persist beyond transient metabolic fatigue and could reflect structural or soft tissue alterations. Alterations in fascial properties have been proposed as one possible contributor to these persistent symptoms. Fascia is a collective term for fibrous connective tissues distributed from superficial to deep layers, which contribute to force transmission and allow relative sliding between adjacent tissues.5 Repetitive motion associated with overuse induces cycles of inflammation and repair within muscles and tendons, which can ultimately lead to fascial adhesions.6 In addition, sustained muscle tension during prolonged exercise may cause changes in the viscoelastic properties of the fascia, resulting in decreased gliding and stiffness.7 Manual techniques targeting the fascia, such as myofascial release, have been reported to reduce pain, improve range of motion (ROM), and restore function.8 The assessment of fascial glide, that is, the ability of muscles and fascia to move independently and smoothly relative to each other, is an important indicator of tissue health. Recent advances in dynamic ultrasound imaging have made it possible to quantify myofascial gliding, which may contribute to understanding its role in performance and conditioning.9 Thus, measuring myofascial gliding may not only reflect structural changes but also provide insight into the mechanisms underlying functional recovery and performance enhancement.
Fascial flossing is a technique in which a specialized elastic band (floss band) is wrapped tightly around a target region while passive or active movements are performed. Improvements in ROM and muscle function are expected.10 This technique has gained popularity among athletes and coaches as a convenient recovery method, often applied during halftime or post-training cool-downs. Previous studies have suggested that ankle fascial flossing can acutely improve ROM, jump performance, and sprint ability in recreational athletes,11,12 and gastrocnemius-targeted fascial flossing has been shown to immediately increase ankle dorsiflexion ROM.13 However, inconsistent findings have been reported, likely due to methodological variations, such as differences in participant characteristics, floss band materials, intervention sites, techniques, band tension, and outcome measures.14 Even when improvements in performance outcomes have been observed, these changes cannot be fully explained by acute neuromuscular or muscle stiffness alterations alone. Although a reduction in fascial stiffness may also play an important role, no studies to date have directly examined changes in fascial glide. Given this gap, objective measurement of myofascial gliding is essential for elucidating the physiological effects of fascial flossing and understanding its mechanism of action in improving functional performance. Importantly, fascial flossing is simple to perform, does not require specialized equipment, and can be applied independently by athletes or athletic trainers, making it highly practical in the field. For competitive long-distance runners, particularly those competing at the national level, efficient post-training recovery is vital for maintaining performance.
The purpose of this study was to investigate the effects of lower leg fascial flossing on recovery from running fatigue in male university long-distance runners at the national level. Ultrasound imaging was used to quantitatively assess the dynamic relationship between fascia and muscle to determine changes in myofascial gliding. The authors hypothesized that post-run fascial flossing would improve myofascial gliding and result in significant enhancements in recovery-related outcomes, including flexibility, perceived tightness, and jump performance.
METHODS
Study design
A within-subject design was used, with each participant serving as their own control by applying the fascial flossing intervention to one leg while the contralateral leg received no intervention. This approach minimized inter-individual variability and increased statistical power. The independent variable was the condition (flossing vs. control), while the dependent variables were selected to capture key aspects of recovery. These included ankle dorsiflexion range of motion (ROM) measured by the Weight-Bearing Lunge Test (WBLT) to assess flexibility, perceived muscle tightness evaluated by a Visual Analog Scale (VAS), Reactive Strength Index (RSI) as a performance indicator, and myofascial gliding assessed by ultrasound imaging to directly quantify fascial and muscle tissue movement. These outcome measures were chosen based on previous literature linking them to muscle recovery, functional performance, and overuse injury risk in distance runners. The treadmill running protocol was implemented to induce a standardized level of fatigue, ensuring consistent pre-intervention conditions for all participants.
Participants
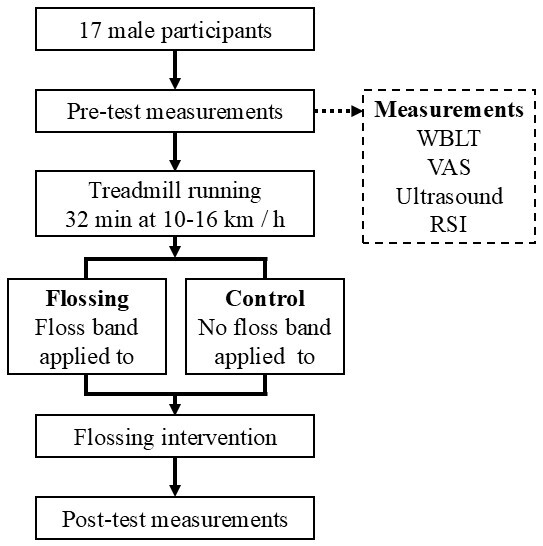
Male collegiate long-distance runners were recruited for this study. Recruitment was conducted via group announcements on the university’s social networking system and through verbal announcements made by the researchers. Exclusion criteria included: any lower limb fractures or severe injuries within the past six months, a history of lower limb pain-related injuries, or inability to perform single-leg jumps properly. Of the 20 runners initially enrolled, three were excluded due to lower leg pain, ankle pain, or a history of knee surgery, leaving a final sample of 17 participants for analysis. Data collection was conducted between April and August 2024.
The study was approved by the Ethics Committee of Daiichi Institute of Technology (Approval No. R5_006) and conducted in accordance with the Declaration of Helsinki. Written and verbal informed consent was obtained from all participants prior to participation. Sample size was estimated a priori in G*Power (G*Power version 3.1.9.2, Heinrich-Heine-University Düsseldorf, Germany) based on a medium-to-large effect reported for ankle dorsiflexion ROM after lower-leg tissue compression techniques (Cohen’s d = 0.56).13 Assuming a within-subject (paired) design, two-tailed α = 0.05, power = 0.80, and a pre–post correlation of r = 0.6–0.7, the required sample size was 15–18 participants. To accommodate potential exclusions, 20 runners were initially recruited
Procedures
Prior to testing, participants performed a standardized warm-up consisting of single-leg knee flexion in standing, calf raises, squats, and countermovement jumps, each for two sets of 10 repetitions with a one-minute rest interval between sets.15 Following the warm-up, pre-test measurements were conducted in the following order (Figure 1): WBLT, perceived tightness of the lower leg using the VAS, myofascial gliding assessment using ultrasound imaging, and the RSI measured through consecutive rebound jumps. All measurements were taken in the order of the right leg followed by the left leg.
Treadmill running
After pre-testing, participants completed a treadmill running protocol (LT5X, Lexco Co., Ltd., Daegu, Korea) to induce fatigue. They first ran for one minute at 10 km/h to become familiar with the treadmill. The formal protocol then started at 10 km/h and increased by 2 km/h every 8 minutes, reaching a final speed of 16 km/h, for a total of 32 minutes. Immediately after running, participants had a three-minute seated rest period for wiping sweat and hydration before the start of the intervention.
Fascial flossing intervention
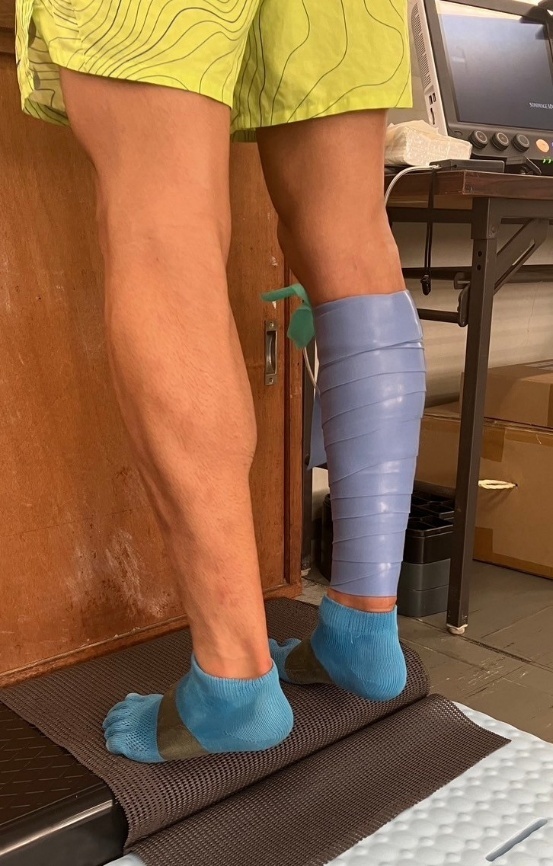
One leg was randomly assigned using a random number table to receive the fascial flossing intervention, while the other leg served as the control. Fascial flossing was performed using a natural rubber floss band (COMPREFloss™, 5.1 cm×3.5 m; Sanctband Japan Co., Tokyo, Japan). A Kikuhime pressure sensor (Kikuhime®, TT Meditrade, Horsens, Denmark) was placed beneath the band to monitor compression, which was maintained at approximately 156.9 ± 10.0 mmHg.16 The band was wrapped from the proximal to distal portion of the lower leg with about 50% overlap to ensure uniform pressure. While the band was applied, participants stood on a step with their heels extending off the edge and performed bilateral heel raises in sync with a digital metronome set at 60 beats per minute (ME-150, Yamaha Corp., Hamamatsu, Japan). Each repetition consisted of a one-second eccentric lowering phase and a two-second concentric lifting phase, totaling three seconds per repetition, with 10 repetitions performed. This exercise was performed simultaneously with both legs, but only the intervention leg received compression (Figure 2). After heel raises, participants performed a one-minute passive exercise while seated, rotating the flossed calf inward and outward, while the control leg remained at rest. Immediately following this, the same bilateral heel raise protocol was repeated for another 10 repetitions. The band was then removed, and both legs performed one minute of walking to restore circulation and ensure safety.
Post-test measurements
Immediately after the intervention, post-test measurements were conducted in the same order and under identical conditions as the pre-test (WBLT, VAS, ultrasound imaging, RSI). All procedures were standardized to minimize variability and ensure consistency between pre- and post-test conditions.
Weight-bearing Lunge Test (WBLT)
The WBLT was used to assess ankle dorsiflexion ROM.17 Participants placed both hands on a wall. At this position, a measuring tape was placed on the floor perpendicular to the wall, and participants aligned the center of the heel and the second toe along the tape. The test foot was then positioned forward while keeping the heel in contact with the ground. The participant moved the knee forward until it gently touched the wall. To minimize compensatory movements, a vertical reference line was drawn on the wall along the extension of the measuring tape, and participants were instructed to align the center of the knee with this line during knee advancement. The distance between the tip of the second toe and the wall was measured in centimeters and recorded as the ankle dorsiflexion ROM. All measurements were performed by the same investigator to minimize variability and ensure consistency.
Visual Analog Scale (VAS) for tightness
A VAS was used to evaluate the perceived tightness of the lower leg muscles.18 The scale consisted of a 100-mm horizontal line, with “no tightness” (0 mm) on the left and “maximal tightness ever experienced” (100 mm) on the right. Participants were instructed to mark the point that best represented their perceived level of tightness before and after running. The distance from the left end of the line to the mark was measured in millimeters to quantify subjective tightness.
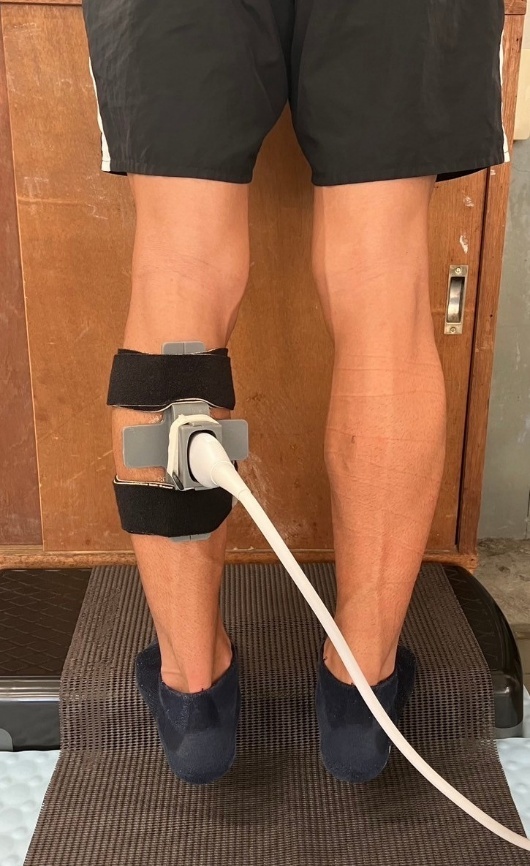
Ultrasound imaging and analysis
The posterior lower leg was imaged using an ultrasound device (SONIMAGE MX1α, KONICA MINOLTA Inc., Tokyo, Japan) with a high-sensitivity linear probe (L11-3, KONICA MINOLTA Inc., Tokyo, Japan). The probe was positioned longitudinally, parallel to the muscle fibers, at the proximal one-third of the distance between the popliteal fossa and the medial malleolus, marked at the medial gastrocnemius muscle belly.19 The sampling frequency was set at 30 Hz. To prevent probe movement during measurement, a custom-made fixation device was designed using computer-aided design (CAD) software (Rhino 7, Robert McNeel & Associates, Seattle, WA, USA) and fabricated with a 3D printer (Form 2, Formlabs Inc., Somerville, MA, USA). The device was secured to the lower leg with a band (Figure 3). The reliability of this fixation method was previously confirmed in dynamic lumbar imaging, demonstrating high intra-class correlation coefficients (ICC: 0.83–0.94).9 During measurement, participants stood on a step with both heels extending beyond the edge and performed rhythmic heel-lowering and heel-raising movements in time with a digital metronome set at 60 bpm. Similar to the fascial flossing intervention, each repetition consisted of a one-second eccentric descent phase, a two -second concentric ascent phase, and a brief rest period afterward, with each set lasting a total of three seconds. After familiarization, three trials were recorded for analysis.

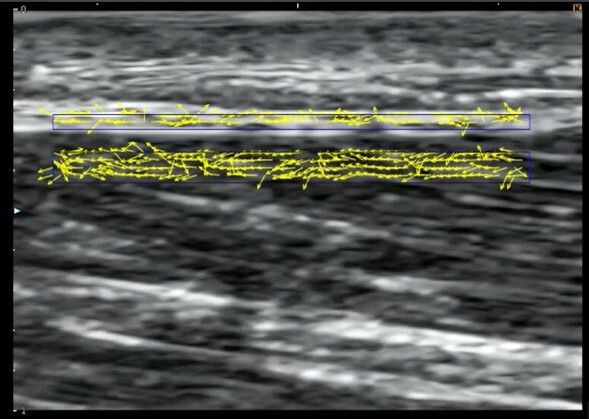
Ultrasound video data were analyzed using specialized software (Echolizer, GLAB Inc., Hiroshima, Japan), which calculates optical flow using the Farneback method (frame offset: 3).20 The validity and reliability of this software for quantifying tissue motion have been confirmed in previous studies, with a relative error of 0.2% after applying the embedded regression equation.21 Regions of interest (ROIs) were defined using a standardized grid system as follows:
Superficial ROI: fascial tissue (X: 12.45 mm × Y: 0.38 mm)
Deep ROI: medial gastrocnemius muscle (X: 12.45 mm × Y: 0.75 mm) (Figure 4)
The mean displacement velocity along the X-axis (cranial–caudal direction) was calculated for each ROI. Cross-correlation analysis was then performed between the fascial and muscular velocity profiles, and the mean value from three trials was used for statistical analysis. A higher cross-correlation coefficient indicated more synchronized movement between the two tissues, representing reduced gliding, whereas a lower coefficient indicated more independent movement, representing increased gliding. This interpretation was based on previous research investigating gliding between the vastus lateralis and subcutaneous tissue.22
_for_fasci.jpeg)
Reactive Strength Index (RSI)
RSI is calculated by dividing jump height by ground contact time (GCT) and is widely used to assess the ability to generate explosive power in a short time.23 RSI was measured using an optical measurement system (OptojumpNext™, Microgate Inc., Bolzano, Italy). The system consists of two parallel bars: one transmitting unit positioned 3 mm above the ground and one receiving unit. When the participant’s foot interrupted the infrared beams during jumping, the signal triggered the internal timer, automatically recording flight time (Tair) and GCT at a sampling frequency of 1,000 Hz. Prior to the actual test, participants performed several familiarization jumps to ensure consistent and stable technique. During testing, participants placed their hands on their hips to minimize upper body movement and performed single-leg consecutive rebound jumps, focusing on maximizing jump height while minimizing GCT. They were instructed to land in the same position for each jump while maintaining a forward gaze. Each trial consisted of seven consecutive jumps. The highest and lowest RSI values from each trial were excluded, and the mean of the remaining five jumps was calculated as the representative RSI for that trial. Two trials were performed for each leg, separated by a one-minute rest interval to reduce fatigue while preserving the acute effects of fascial flossing. The higher mean RSI value of the two trials was used for subsequent analysis. Jump height was calculated using proprietary Optojump™ software (version 1.9.9.0) based on the following formula:
Jump height (m) = (1/8) × g × Tair²
where g is gravitational acceleration (9.81 m/s²), and Tair is flight time in seconds. RSI was then automatically calculated as jump height divided by GCT by the same software. This measurement protocol was adapted from previously reported rebound jump assessment methods to fit the design of the present study.24
STATISTICAL METHODS
All data are presented as adjusted means (least squares mean ± standard error, SE) derived from the mixed model. To account for baseline differences and the paired design (left vs. right leg), a mixed model for repeated measures (MMRM) was employed to examine the effects of condition (flossing vs. control) and time (pre- vs. post-intervention) on each outcome variable. In this model, participants were treated as random effects, while condition and time were treated as fixed effects, with baseline values included as covariates. Prior to the main analysis, paired t-tests were conducted to confirm that there were no significant baseline differences between the flossing and control legs for all outcome variables (VAS, WBLT, RSI, and gliding). When a significant condition × time interaction was detected, post hoc comparisons were performed to examine simple main effects between conditions at each time point and within-condition changes from pre- to post-intervention. Effect sizes for the mixed model were reported as partial eta squared (partial η²), interpreted as small (0.01), medium (0.06), and large (0.14).25 Statistical significance was set at p < 0.05. All statistical analyses were performed using Modified R Commander (version 4.5.0), based on the R statistical software package (R Foundation for Statistical Computing, Vienna, Austria; https://www.r-project.org/).
RESULTS
Seventeen runners were included in the final analysis. Participant characteristics were as follows: age, 20.1 ± 0.8 years; height, 170.1 ± 4.5 cm; body mass, 54.6 ± 3.9 kg. All participants trained 5–6 days per week with an average daily mileage exceeding 20 km. Mean training experience was 7.7 ± 3.4 years, and the best 5000-m performance was 15 min 36 s ± 36 s. Baseline values (pre-intervention) for both the flossing and control legs and their statistical comparisons are presented in Table 1. Paired t-tests confirmed that there were no significant baseline differences between the two legs for any outcome variables (VAS, WBLT, RSI, and gliding). Adjusted means (least squares mean ± standard error [LS Mean ± SE]) for pre- and post-intervention values are summarized in Table 2. A mixed-model repeated-measures analysis (MMRM) with factors of group (flossing vs. control) and time (pre- vs. post-intervention) was then performed, yielding the following results.
VAS
There was a significant interaction between group and time (p = 0.0499, partial η² = 0.101, medium). In the control leg, VAS scores increased after the intervention (pre: 44.4 ± 1.86 → post: 47.5 ± 1.86, Δ = +3.18, p = 0.23), although this change was not statistically significant. In contrast, the fascial flossing leg showed a decrease in VAS scores (pre: 44.4 ± 1.86 → post: 39.9 ± 1.86, Δ = −4.42, p = 0.10), which was also not statistically significant.
WBLT
A significant group × time interaction was observed (p = 0.0084, partial η² = 0.085, medium). Both the control and flossing legs demonstrated significant increases in dorsiflexion ROM after the intervention. The magnitude of improvement was greater in the fascial flossing leg compared to the control leg (control: Δ = +0.713 cm, p = 0.0008; flossing: Δ = +1.234 cm, p < 0.0001).
RSI
A significant group × time interaction was found (p = 0.0043, partial η² = 0.109, medium). The control leg showed a significant decrease in RSI following the intervention (pre: 0.521 ± 0.0071 → post: 0.494 ± 0.0071, Δ = −0.027, p = 0.01). In contrast, the fascial flossing leg demonstrated no significant change (pre: 0.521 ± 0.0071 → post: 0.524 ± 0.0071, Δ = +0.003, p = 0.78).
Myofascial Gliding (Cross-Correlation Coefficient)
There was a significant group × time interaction (p = 0.0093, partial η² = 0.09, medium). The fascial flossing leg showed a significant decrease in cross-correlation coefficient after the intervention, indicating improved myofascial gliding (pre: 0.627 ± 0.020 → post: 0.560 ± 0.020, Δ = −0.067, p = 0.025). No significant change was observed in the control leg (pre: 0.627 ± 0.020 → post: 0.637 ± 0.020, Δ = +0.009, p = 0.74).
DISCUSSION
This study investigated the effects of fascial flossing on the lower leg and jump performance after long-distance running using four outcome measures: VAS, WBLT, RSI, and myofascial gliding assessed by ultrasound imaging. The results demonstrated significant condition × time interactions for all outcome variables, indicating that the flossed leg showed greater improvements compared to the control leg. These findings suggest that fascial flossing may be beneficial for conditioning, recovery, and performance maintenance in competitive long-distance runners. Importantly, to our knowledge, this is the first study to directly measure changes in myofascial gliding in response to fascial flossing, thereby providing novel insight into its underlying mechanisms.
The VAS results showed a tendency (non-significant) toward improvement in the flossed leg, whereas the control leg exhibited a slight increase in perceived tightness. Fascial flossing may have suppressed the increase in perceived tightness compared to the control leg. Similarly, ultrasound analysis demonstrated a significant decrease in the cross-correlation coefficient in the flossed leg, indicating enhanced myofascial gliding, while no significant changes were observed in the control leg. Previous studies have suggested that changes in mechanoreceptor activation can influence the perception of muscle tightness.26 Improved glide properties achieved through fascial flossing may have altered intramuscular pressure and mechanoreceptor input, thereby contributing to reduced subjective tightness.
Both the flossing and control legs showed significant increases in dorsiflexion ROM after the intervention, but the magnitude of improvement was greater in the flossed leg. Previous studies have reported that gastrocnemius fascial flossing can acutely increase ankle dorsiflexion ROM,13 and the present findings are consistent with this evidence. General aerobic warm-up activities have been reported to acutely enhance flexibility by improving the compliance of muscles, tendons, and surrounding soft tissues.27 In the present study, the improvement observed in the control leg may be explained by a similar warm-up effect induced by the treadmill running protocol. However, the significant condition × time interaction confirmed that fascial flossing provided a greater effect than treadmill running alone.
For RSI, the control leg showed a significant decrease after running, indicating fatigue-induced performance decline. In contrast, the flossed leg maintained its RSI and even exhibited a slight, though non-significant, increase. These findings align with previous reports that ankle fascial flossing can acutely improve jump performance.12 Moreover, studies on external compression, such as tourniquets or blood pressure cuffs, have demonstrated that when approximately 214 mmHg of occlusion is applied and subsequently released, circulating levels of growth hormone and norepinephrine significantly increase.28 Notably, elevated norepinephrine levels have been associated with improvements in vertical jump performance.29 Therefore, in this study, the reperfusion response following the release of the floss band may have contributed to maintaining RSI and promoting recovery after fatigue, however this was not directly studied. By including nationally competitive long-distance runners as participants, this study provides novel evidence of the effectiveness of fascial flossing for performance maintenance at an elite level.
Fascia is a multilayered fibrous and collagenous connective tissue that surrounds skeletal muscles, joints, organs, nerves, and blood vessels.30,31 These layers glide relative to each other, allowing smooth muscle contraction and elongation.32 However, repetitive mechanical stress and fatigue can alter gliding, leading to decreased flexibility and impaired function. Fascial flossing may enhance myofascial gliding by applying mechanical compression and retaining heat, which can reduce fascial viscosity through a thixotropic effect.33,34 Additionally, performing active and passive movements under compression may further reduce adhesions between fascial layers, facilitating freer motion of the muscles. This process likely contributed to the observed improvements in myofascial gliding in the present study. External pressure activates mechanoreceptors present in both skin and muscle, suggesting it modulates sensory feedback and influences motor unit recruitment and muscle force production.26 This mechanism may partially explain the improvements observed following fascial flossing intervention. Taken together, these findings suggest that fascial flossing acts through a combination of mechanical and circulatory physiological mechanisms.
Several limitations should be considered when interpreting these findings. First, the study included only male collegiate long-distance runners, limiting the generalizability to other populations such as female athletes or athletes in other sports. Previous studies have reported sex-related differences in tendon stiffness and hysteresis,35 and thus the effects of fascial flossing may differ in female athletes. Second, the applied fascial flossing pressure was standardized at approximately 150 mmHg for all participants. However, optimal pressure may vary depending on individual factors such as muscle mass and subcutaneous tissue thickness. Future studies should explore individualized pressure settings to maximize benefits. Third, the sample size used in the analysis was small, limiting the comparability of the results. However, in studies involving athletes, it is difficult to assemble high-level participants, making small sample sizes unavoidable.36 Finally, this study investigated only the immediate effects of a single fascial flossing session. Long-term effects remain unclear, and future research should include longitudinal interventions with larger sample sizes to determine whether repeated fascial flossing produces lasting changes in flexibility, performance, and injury prevention.
CONCLUSION
The results of this study indicate that fascial flossing was effective in enhancing flexibility and maintaining explosive performance immediately after fatigue. These findings support the use of fascial flossing as a practical self-care and conditioning strategy for athletes seeking to optimize recovery and sustain performance levels.
Corresponding Author:
Yuki Nakai, PhD, PT
Department of Physical Therapy, Faculty of Rehabilitation, Reiwa Health Sciences University
2-1-12 Wajirogaoka, Higashi-ku, Fukuoka 811-0213, Japan
Tel: +81-92-607-6701
Fax: +81-92-607-6740
Email: y.nakai@kyoju.ac.jp
Conflict of Interest
The authors declare no conflicts of interest.
ACKNOWLEDGMENTS
The authors sincerely thank all the athletes who volunteered to participate in this study. We also acknowledge the technical assistance provided by the laboratory staff and the helpful input of our colleagues during the planning and execution of this research. This work was supported by the Japan Society for the Promotion of Science (JSPS KAKENHI), Grant Number 24K14419.