
INTRODUCTION
Skeletal muscle power, the ability for a muscle (or muscle groups) to produce force over an interval of time, is a key determinant of functional capacity and healthy aging, influencing everyday tasks such as rising from a chair, stair negotiation, and gait.1–6 Lower-limb power shows strong associations with mobility limitations and adverse outcomes, often exceeding the explanatory value of strength alone.2,5–7 Similarly, though strength is an important physical capacity that ensures physical function, capacity, and resiliency across the lifespan, muscle power has shown to be a stronger predictor of all-cause mortality, overall health status, functional independence, and as a predictor of future functional decline.2,5–7
Despite muscle power’s apparent relevance as a predictor and biomarker of longevity, health, and function, formal quantification and tracking of weight bearing muscle power are not widely performed in older adults.8 Though clinically friendly tests are commonly used, such as the traditional 30 second sit to stand (30STS) or 5-times sit to stand (5xSTS), in various clinical, wellness, and fitness settings, the outcome metrics are quite obtuse (i.e., number of repetitions performed or time in seconds, respectively) and fail to precisely quantify the muscle power output, watts/kg for example. Originally, the 5-times sit-to-stand muscle power test (5xSTSPT) was described, which more precisely quantifies lower-limb mechanical power during chair rises from simple inputs (i.e., body mass, stature, chair height, and performance time) and offered a pragmatic alternative to laboratory instruments.3,4,9,10 Foundational work has demonstrated that STS power relates well to instrumented measures and functional performance and can be computed with excellent measurement properties.3,4,11 Additionally, the test has demonstrated more universal applications across the lifespan in both adolescents, young adults, across ethnicities, and a greater spectrum of health conditions than the traditional use in the geriatric population.12–14 Following the original description and validation of the 5xSTSPT, an alternative protocol, the 30-Second Sit-to-Stand Power Test (30STSPT), has since been developed and validated.3,4,15,16 Although similar in structure, the two assessments are not interchangeable, as they measure distinct aspects of physical function.15 The 5xSTSPT primarily reflects lower-limb power and speed, whereas the 30STSPT additionally captures endurance and repetition strength.15
The 30STSPT was selected for this validation study due to its broader clinical applicability across diverse patient demographics. It offers a more functionally relevant and potentially more sensitive evaluation of mobility-related capacity than the 5xSTSPT.15 Demonstrating strong construct validity, the 30STSPT correlates with instrumented leg-extension power and translates effectively to real-world mobility tasks that require sustained, repetitive effort, such as stair climbing and repeated transfers.4,15
By assessing mean power over a 30-second period, the test also enables detection of fatigability, an important physiologic quality linked to functional independence. In contrast, the 5xSTSPT emphasizes initial burst performance and is less sensitive to endurance-related power characteristics.3,4,15,16 The extended duration of the 30STSPT typically produces a wider performance range (i.e., more repetitions), improving score granularity and discrimination among higher-functioning individuals.15,17 Averaging power over multiple repetitions further minimizes the influence of start/stop variability and outlier performances. Conversely, the 5xSTSPT can exhibit ceiling effects in fitter populations, as most individuals complete the five repetitions rapidly with limited variance.3,4,15,16
Despite this promise, broader adoption of power-based STS assessment can be limited due to the time and discretionary time required for clinicians to calculate the estimated muscle power, manually or otherwise (e.g., Microsoft Excel spreadsheet formula calculator). Markerless motion capture using commodity 2D cameras and computer vision offers a low-cost path to scale by eliminating markers, wearables, and complex calibration, while simultaneously leading to broader array of key performance metrics (i.e., joint biomechanics, fatiguability, pooled data analysis, and identification of trends across time and demographics) that may be elusive through human calculation methods. Early clinical deployments have demonstrated good agreement with reference measures and substantial time savings, underscoring feasibility for routine care and telehealth. Extending a 2D motion capture approach to a dynamic, whole-body task such as the 30STSPT could unlock scalable, objective power testing in clinics and remote environments. However, validity against a rigorous criterion integrating ground-reaction forces (GRF) with segment displacement, and test–retest reliability for Artificial Intelligence (AI)-derived STS power, remain to be established.
Therefore, the purpose of this study was to determine (1) the concurrent validity of a 2D AI-camera system for quantifying muscle power during the 30STSPT by comparison with a dual force-plate plus inertial measurement unit (IMU) reference method, and (2) the test–retest reliability, minimal detectable change (MDC), and standard error of measure (SEM) of the AI-derived STS power metric in healthy adults. Given the unpublished, internal exploration of the 2D AI-camera system the hypothesis was that the 2D AI-camera would demonstrate strong agreement with the criterion method and high test-retest reliability, supporting its use as a scalable, low-burden alternative for power assessment in clinical and remote settings.
METHODS
Study Design
A validation and reliability study that evaluates a 2D markerless AI-camera system against a criterion consisted of a dual force-plate system synchronized with an IMU.
Study Oversight
A prospective validation and reliability study was conducted to compare a single-camera, 2D markerless AI system (index test) with a criterion reference comprising bilateral force plates synchronized with an inertial measurement unit (IMU) during the 30-second Sit-to-Stand Power Test (30STSPT). The study was performed at a hospital-based outpatient physical therapy clinic (Stanford Health Care Outpatient Physical Therapy Clinic, Redwood City, CA) between July 8 and July 21, 2025.
All procedures adhered to institutional policies for human participant testing and the principles of the Declaration of Helsinki. Verbal informed consent was obtained from all participants as the study involved minimal risk, did not include invasive procedures, and did not collect protected health information. Participants received a verbal explanation of all procedures and had the opportunity to ask questions prior to participation. This initiative was conducted as an internal quality improvement and operational evaluation within a single outpatient physical therapy clinic. Consistent with the U.S. Common Rule and OHRP guidance, activities limited to implementing and assessing local practice for clinical/administrative purposes do not meet the definition of “research” (45 CFR 46.102) and are therefore not subject to IRB review. Accordingly, this project did not undergo IRB review. Publication of the findings does not alter the non-research classification.18,19 Additionally, all analyses were performed on operational data that were either de-identified or reported in aggregate; no individually identifiable health information was disclosed. De-identification followed the HIPAA Privacy Rule (45 CFR 164.514) principles (Safe Harbor/Expert Determination).20,21
Setting and Participants
Healthy adults aged 20–55 years who were receiving care at the study clinic and could complete the 30STSPT without assistance were recruited via convenience sampling. Inclusion criteria were: (1) age 20–55 years; (2) independent ambulation without an assistive device; (3) ability to perform repeated sit-to-stand transitions safely; and (4) willingness to participate. Exclusion criteria were: (1) history of low back pain or lower-extremity injury in the preceding year that required medical care; and (2) pregnancy at the time of testing (based on participant report). Given the exploratory nature of the investigation, there were no exclusions based on anterior cruciate ligament graft type or concomitant procedures for participants with surgical histories.
Apparatus and Instrumentation
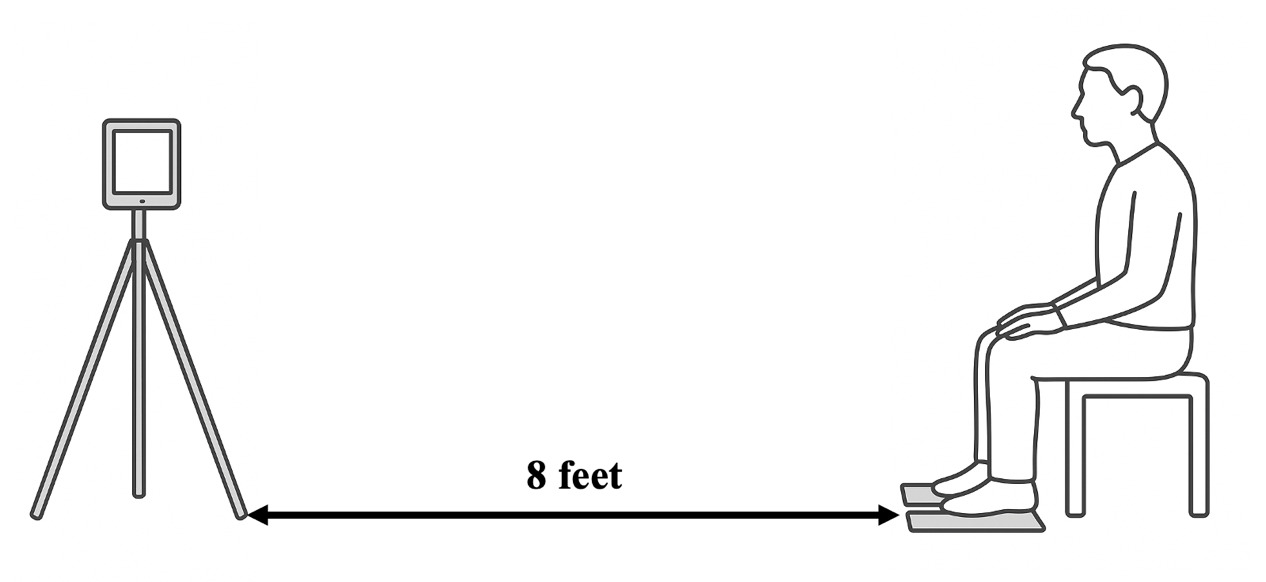
AI system (index test). A single 2D camera via a digital tablet (Apple iPad) was positioned in the sagittal plane and the application (Exer Scan, Exer Labs, Inc., Denver, CO) was opened (Figure 1). The application interface on the iPad provided a level and prompted inputs for subject height, weight, and chair height. The application used the front 2D camera of the digital tablet to capture the entire 30-s test interval. Video was processed locally on the tablet to extract pose key points and compute the derived performance metrics. No raw video was stored or exported; only derived, non-identifying performance outputs were retained for analysis. Study devices were restricted to study personnel and protected by device-level authentication. The embedded computer-vision pipeline tracked anatomic key points and automatically computed trial-level mean sit-to-stand (STS) power as relative power (W·kg-1) using a published STS equation that incorporates body mass, stature, chair height, and task time (see Equation 1).4,9 The chair height was standardized at 0.457 m for all trials. Gravity (g) is constant and equal to 9.81 m/s2.
STS Power (W)= Body Mass (kg) × g × (Height (m)−Chair Height (m)) ×(# of repetitions)Total Time (s)
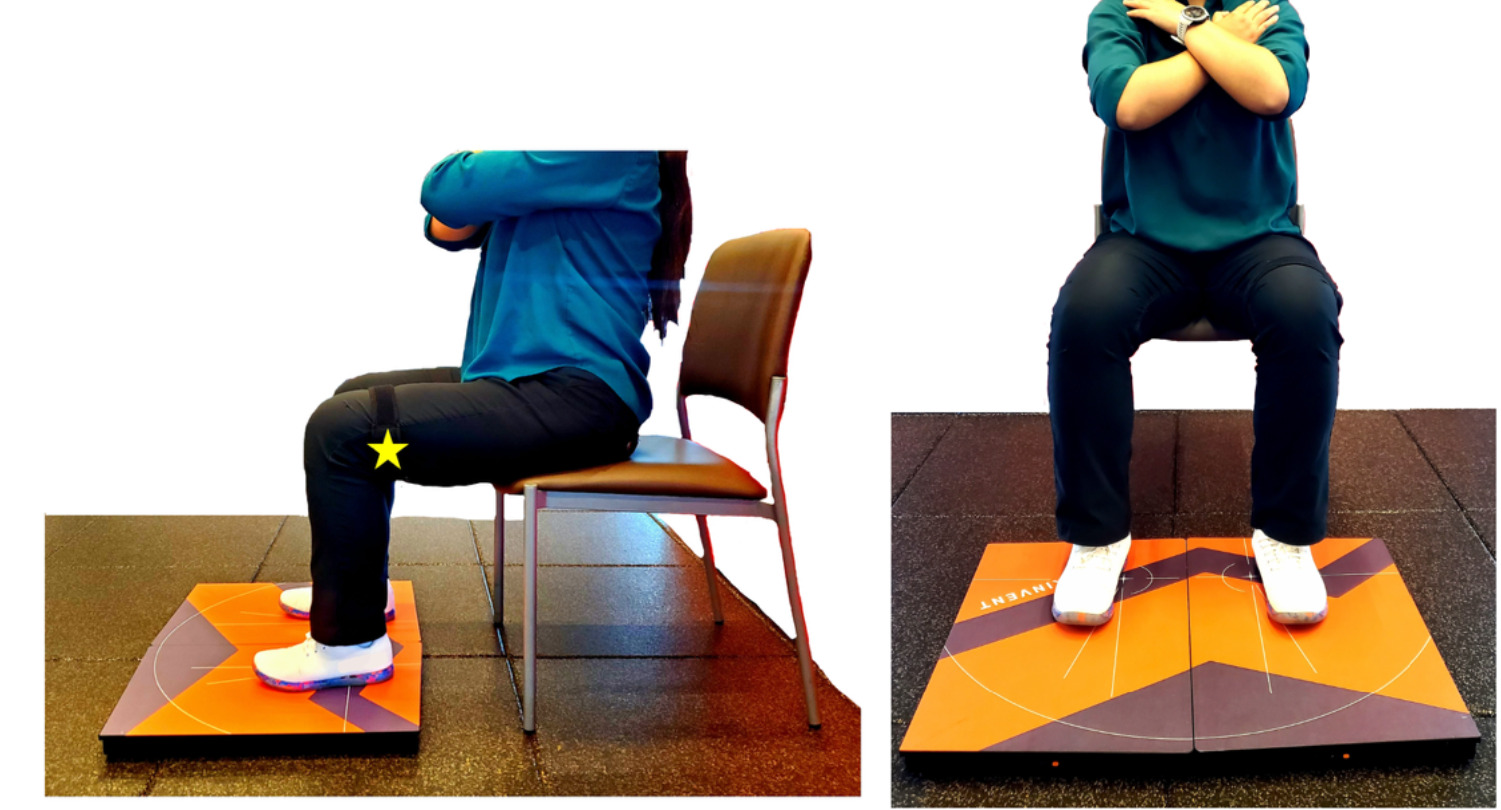
Criterion reference. Two force plates (K-Delta Force Plates, Invent, Montpellier, France) measured vertical ground-reaction forces (GRF) under each foot, synchronized with an IMU (K-Move, Invent, Montpellier, France) tightly affixed to the lateral thigh with a Velcro strap to estimate vertical/curvilinear displacement (Figure 2). The data were collected via a Bluetooth connection by the KINVENT PHYSIO application (Kinvent, Montpellier, France) and stored on an apple tablet or iPhone. For each repetition, watts were computed from the average peak vertical GRF and the IMU-derived displacement; per-rep watts were then aggregated to a trial-level mean power for comparison with the AI estimate. Body mass (kg) and stature (m) were obtained immediately prior to testing using clinic scales/stadiometers.
.png)
.png)
Procedures
Participants performed two maximal-effort trials of the 30STSPT, separated by seated rest to minimize carryover fatigue. Standardized instructions emphasized rising as many times as possible with full knee and hip extension and controlled return to the chair within 30 s. During each trial, repetition counts were recorded by: (1) research personnel, (2) the AI system, and (3) the IMU/force-plate pipeline. The camera and force-plate area were cleared of bystanders and images to prevent occlusion or false detections.
Outcomes
The primary outcome for validity analyses was trial-level mean relative power (W·kg-1) from the AI system and the criterion reference. Secondary outcomes included repetition counts, body mass, stature, and descriptive participant characteristics (age, sex, BMI).
Data Processing and Quality Control
A prespecified data-handling plan was applied:
-
Missing criterion data. Two participants lacked valid criterion power values on both trials (IMU detachment/invalid reference signal). These records were excluded from concurrent validity but retained for AI test–retest reliability, as both AI trials were available.
-
Duplicate exports. One participant had two valid exports per trial. To preserve within-subject pairing without discarding usable data, the duplicate power values were averaged within that trial to create a single Trial 1 and Trial 2 value, preserving within-subject pairing without inflating sample size.
-
Completeness for reliability. Reliability analyses required both trials for a given method. Thus, participants contributed to AI reliability if AI power was available for Trials 1 and 2, and to criterion reliability if criterion power was available for both trials.
-
Metric definitions. AI and criterion power were analyzed as relative power (W·kg-1). For criterion data, per-rep watts were averaged to obtain a trial-level mean power matched one-to-one with the AI trial-level estimate.
Statistical Analysis
All analyses were conducted with α = 0.05 (two-sided) in Python (custom scripts using pandas, scipy, and matplotlib). The analysis set and code-generated outputs (CSV tables and figures) are available upon request.
Concurrent validity. For Trial 1 and Trial 2 separately, the linear association between AI and criterion trial-level power was assessed with Pearson’s correlation coefficient (r) with 95% confidence intervals (CI) computed via Fisher’s z transformation and associated p-values.
Agreement (method comparison). For each trial, we performed Bland–Altman analyses to estimate mean bias (AI − Criterion) and 95% limits of agreement (LoA = bias ± 1.96 × SD of differences). To evaluate proportional bias, the pairwise difference were regressed on the pairwise mean; the slope and p-value from this regression were reported. A negative slope indicates the AI method overestimates relative to criterion at lower power outputs and underestimates at higher outputs (magnitude-dependent error).
Test–retest reliability. For AI and criterion separately, test–retest reliability across Trial 1↔Trial 2 was estimated using a two-way mixed-effects intraclass correlation coefficient, ICC(3,1) for single-measure and consistency, with 95% CI derived from the F distribution and p-values from the corresponding F-test for between-subject effects. The measurement error was quantified by the standard error of measurement (SEM) and minimal detectable change at 95% confidence (MDC₉₅):
SEM=SD × √(1−ICC)
MDC95=SEM × 1.96 × √2
where SD is the across-participants standard deviation from Trial 1 for the given method. Additionally, relative SEM and MDC₉₅ were reported as percent of the Trial 1 sample mean to facilitate clinical interpretation across body sizes.
Pre-specification and transparency. The following analysis choices were prespecified or decided a priori to maximize transparency and reproducibility: (1) exclusion of records with missing criterion values from validity analyses; (2) retention of participants with complete AI trials in AI reliability regardless of criterion completeness; (3) averaging duplicate exports within a trial to generate a single Trial 1 and Trial 2 value per participant, preserving within-subject pairing without inflating sample size; and (4) reporting of r with 95% CI, Bland–Altman bias/LoA, proportional-bias slopes, ICC(3,1) with 95% CI and p-values, and SEM/MDC₉₅ in both absolute and relative units.
Sample Size. Sample size was selected to support an initial precision-focused evaluation of concurrent validity and test–retest reliability in a pragmatic clinical workflow. While larger samples improve precision of Bland–Altman limits of agreement, this study was intended as a foundational validation to quantify bias, dispersion, and measurement error estimates to inform subsequent, larger clinical studies. Therefore confidence intervals for correlation and ICC estimates and limits of agreement are reported as preliminary precision bounds that should be refined in larger cohorts.
RESULTS
Participants
Twenty-four participants (9 men, 15 women; mean age, 34.4 ± 9.4 years [range, 24–55]; mean BMI, 24.9 ± 4.1 kg·m-2) completed two trials of testing (Table 1).
All participants performed two maximal-effort trials of the 30-second Sit-to-Stand Power Test (30STSPT). For concurrent validity analyses, 19 paired observations per trial were available after excluding two participants with missing criterion data (IMU detachment/invalid signal). For reliability, 20 participants contributed to AI estimates (complete AI trials), and 18 contributed to criterion reliability (complete criterion trials); two participants were excluded from criterion reliability due to IMU detachment during testing.
Concurrent Validity
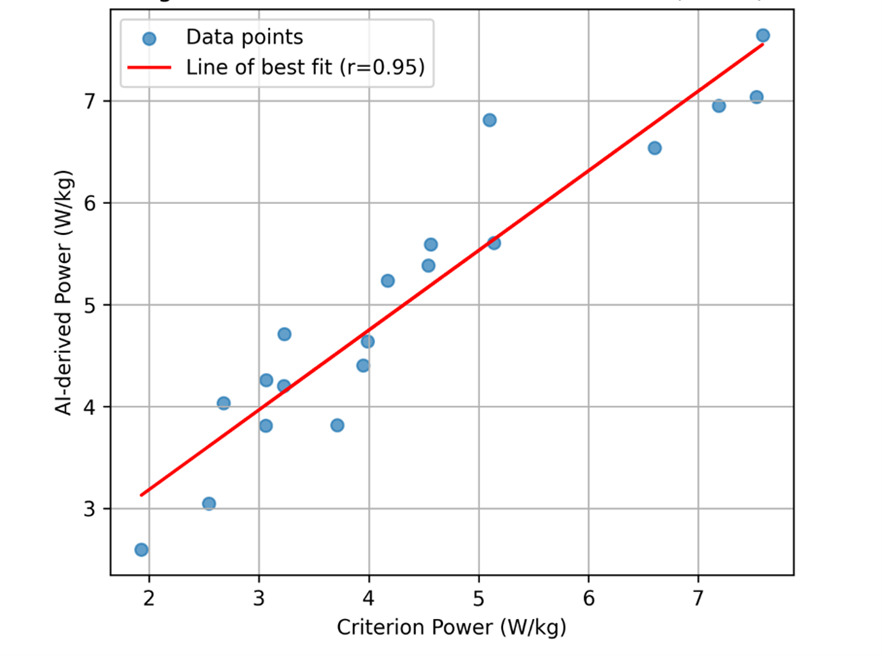
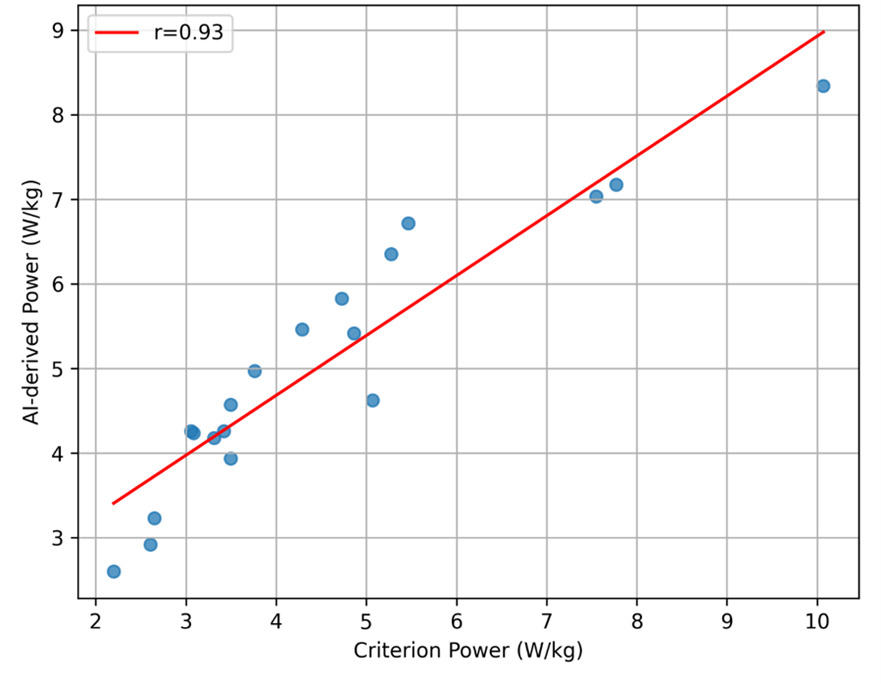
AI-derived and criterion-based power estimates demonstrated excellent correlation across both trials (Table 2). For Trial 1, Pearson’s correlation coefficient was r = 0.945 (95% CI, 0.861–0.979; p < 0.001), and for Trial 2, r = 0.934 (95% CI, 0.833–0.975; p < 0.001). Scatter plots with regression lines for trial 1 and trial 2 are shown in Figure 3a and Figure 3b, respectively.
_for_trial_1.png)
_for_trial_2.png)
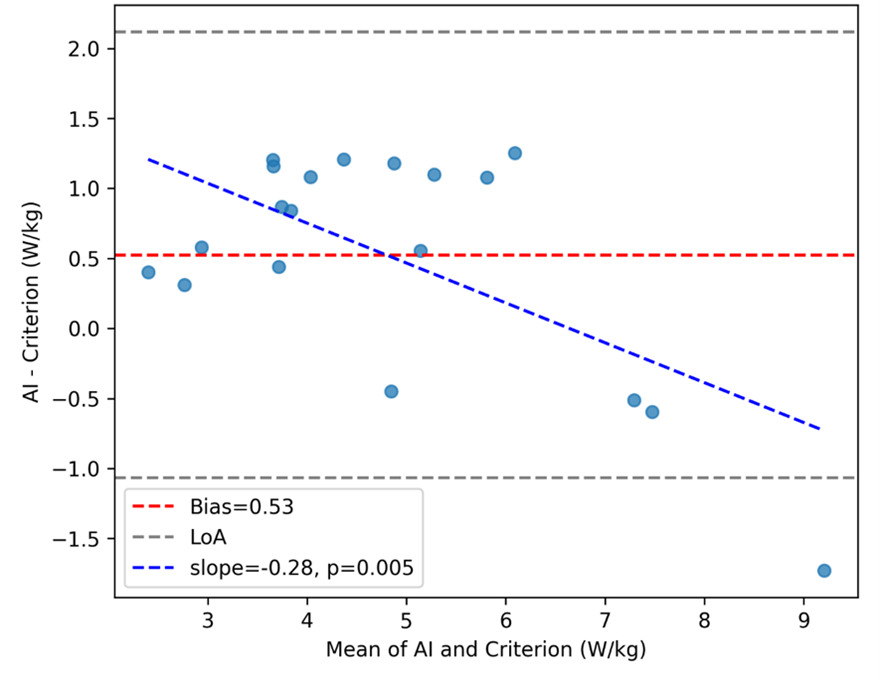
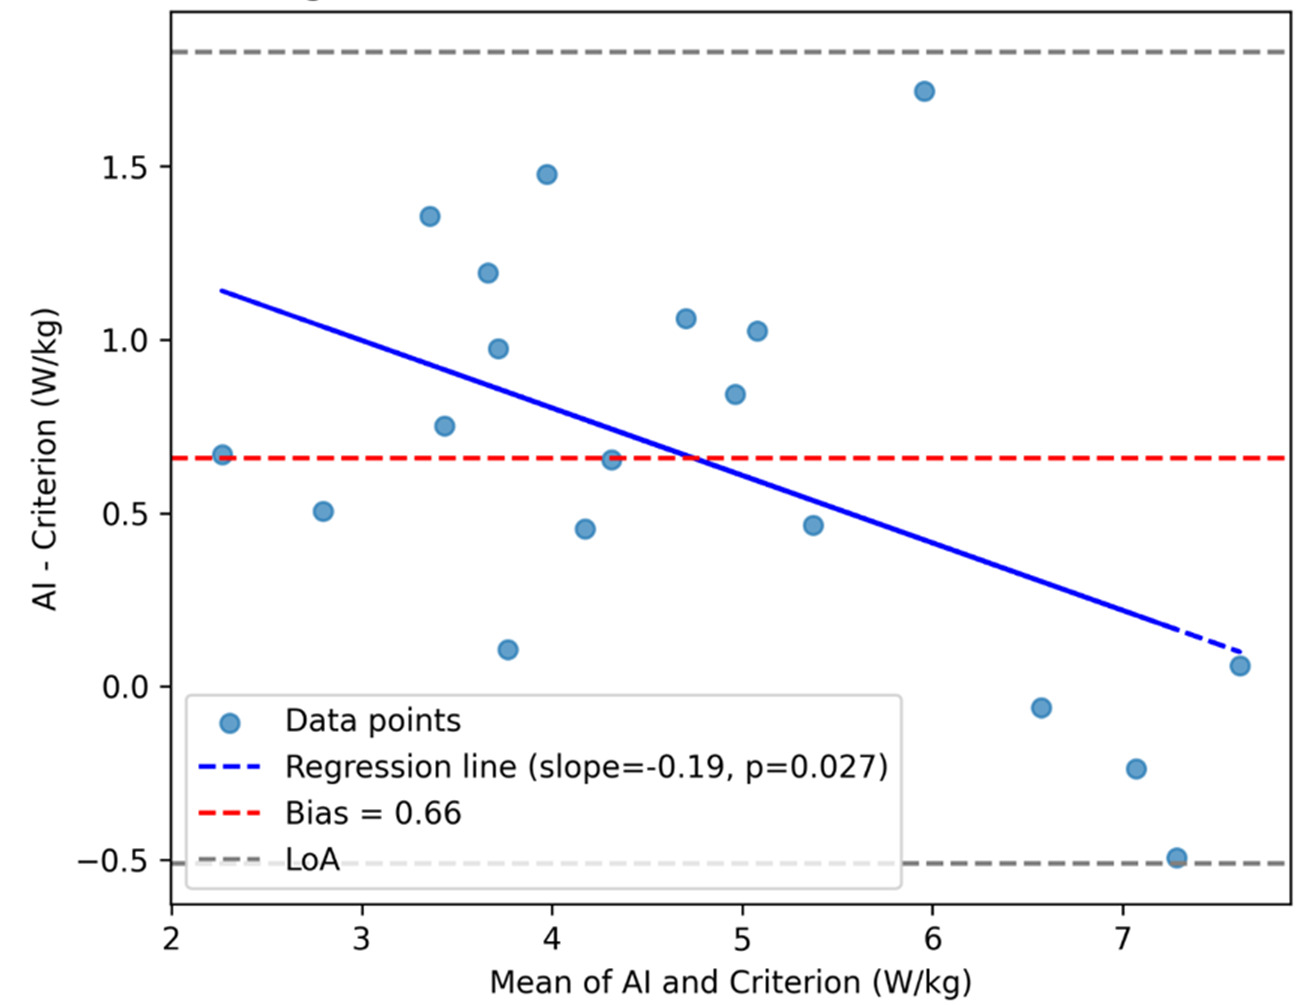
Bland–Altman analysis revealed a mean bias of +0.659 W·kg-1 (95% LoA, −0.511 to +1.829) for Trial 1 (Figure 4a) and +0.525 W·kg-1 (95% LoA, −1.067 to +2.117) for Trial 2 (Figure 4b). Proportional-bias testing indicated a significant negative slope for both trials (Trial 1: slope = −0.195, p = 0.027; Trial 2: slope = −0.285, p = 0.0049), suggesting that the AI system overestimated power at lower performance levels and underestimated at higher levels.

Test–Retest Reliability
The AI-derived power results exhibited excellent test–retest reliability (ICC(3,1) = 0.942; 95% CI, 0.860–0.977; p < 0.001), with a SEM of 0.362 W·kg-1 (7.13%) and MDC₉₅ of 1.004 W·kg-1 (19.8%) (Table 3). Criterion-based power demonstrated good-to-excellent reliability (ICC(3,1) = 0.916; 95% CI, 0.790–0.968; p < 0.001), but with greater measurement error (SEM = 0.489 W·kg-1 [11.4%]; MDC₉₅ = 1.355 W·kg-1 [31.6%]).
DISCUSSION
The purpose of this study was to determine (i) the concurrent validity of a 2D AI-camera system for quantifying muscle power during the 30STSPT by comparison with a dual force-plate plus IMU reference method, and (ii) the test–retest reliability, the MDC and, the SEM of the AI-derived STS power metric in healthy adults. Consistent with the original hypothesis, the 2D AI-camera calculated muscle power value during the 30STS PT demonstrated strong agreement (r = 0.95) with the criterion method of muscle power calculated using the average peak GRF taken from the dual force plate system and the vertical displacement captured by the IMU (affixed to the lateral aspect of the participants thigh). The AI-camera system demonstrated excellent test–retest reliability (ICC(3,1)=0.942, 95% CI 0.860–0.977), with SEM=0.362 W·kg-1 (7.13%) and MDC₉₅=1.004 W·kg-1 (19.8%). These values provide clinicians with thresholds to distinguish measurement error from real change during longitudinal testing. The findings indicate that low-cost, computer-vision approaches can deliver clinically salient power information that has previously required laboratory instrumentation.
The present results align with prior work establishing the 30STSPT as a more clinically relevant construct than repetition counts or completion times alone.3,4,9,10,15,16 Power integrates both the capacity to generate force and to move rapidly through the functional range required to rise from a chair.3,4,9,10 As such, STS power tends to relate more closely to mobility, independence, and fall risk than traditional STS endpoints.3,4,15,16 The ability to compute this construct accurately from a commodity camera meaningfully lowers the barrier to routine measurement in clinics and remote settings.22
Notably, AI power normalized to repetitions showed higher test–retest reliability than per-repetition watts derived from the criterion system. Aggregating across a 30-second trial likely dampens transient perturbations (e.g., micro-adjustments of posture or breathing) that disproportionately influence peak, event-level metrics. In addition, the AI estimate leverages relatively stable scalar inputs (body mass, stature, chair height) combined with a global timing variable, reducing the impact of segmentation and synchronization errors that can affect per-rep fusion of force-plate and IMU signals.
Concurrent Validity Interpretation
Limits of Agreement
The Bland–Altman comparison (see Figure 4a and Figure 4b) between the AI-derived and criterion trial-level power revealed a positive bias of +0.659 W·kg-1, indicating that, on average, the AI approach overestimates power relative to the force-plate+IMU reference. The 95% LoA (−0.511 to +1.829 W·kg-1) quantify the range where most individual differences are expected to lie at a single time point. In practical terms, this means that for a given trial, AI and criterion values will typically agree within roughly ±1.17 W·kg-1 around the mean bias, with AI tending higher. Whether this spread is clinically acceptable depends on the intended use case and thresholds for meaningful change. Notably, the upper LoA (~+1.83 W·kg-1) is on the order of, and can exceed, the AI MDC95 (~1.00 W·kg-1), implying that method choice (AI vs criterion) could influence whether a single-visit difference is deemed “real” for some individuals.23
Several mechanisms explain both the direction and width of the LoA. First, the AI estimator averages performance over 30 seconds using stable anthropometrics and global timing, whereas the criterion pipeline integrates peak GRF events with IMU-derived displacement, making it more sensitive to segmentation and synchronization nuances across repetitions. Small, systematic offsets in event timing or displacement estimation can translate into a consistent positive difference (AI > criterion) and add dispersion. Prior work has shown that sensor-based event detection during STS can exhibit millisecond-scale misalignment with force-plate markers; when propagated to derived variables such as power, these offsets can widen LoA without necessarily degrading correlation.22
From an implementation perspective, there are several caveats depending on the scale of practical implementation. For individual-level decision-making where absolute watts matter across modalities, clinicians should avoid interchanging AI and criterion values within a time series; stick to a single method for longitudinal follow-up to prevent spurious change attribution. For population-level monitoring or triage, the strong correlation and predictable bias permit use of AI as a low-burden surrogate, if calibration or conversion equations (if desired) are made explicit. These recommendations are consistent with broader guidance on method-comparison and force-plate analytics in clinical performance testing.24
Proportional Bias Across Trials
While the mean bias and limits of agreement provide a global view of method agreement, proportional-bias analysis revealed additional nuance. For Trial 1, the regression of differences on the mean indicated a small but statistically significant negative slope (−0.195, p = 0.027), suggesting that the AI system tended to overestimate power more at lower performance levels and slightly less at higher levels. This pattern was more pronounced in Trial 2 (slope = −0.285, p = 0.0049), indicating that magnitude-dependent error persisted across repeated testing. Clinically, this implies that while AI-derived power values track closely with criterion measures overall, caution is warranted when interpreting absolute values at the extremes of performance. For example, in lower-functioning individuals, AI estimates may slightly overstate true mechanical power, whereas in higher-functioning individuals, the bias narrows or reverses. These findings underscore the importance of using a single method for longitudinal monitoring and considering calibration strategies if absolute agreement across the full performance spectrum is required.
Test-Retest Reliability Interpretation and Explanation
Notably, the test–retest reliability for AI-derived 30-s STS power was excellent (ICC(3,1) = 0.94, 95% CI 0.86–0.98), whereas the criterion method (dual force plates + IMU-based displacement) was slightly lower (ICC(3,1) = 0.92, 95% CI 0.79–0.97). Although both estimates indicate good–excellent reproducibility, the relative decrement for the criterion is consistent with the way error sources compound when multiple signals and processing steps are combined. The criterion pipeline fuses vertical GRF with a displacement estimate derived from segment length and IMU signals; each component introduces its own variability (e.g., IMU orientation and soft-tissue artifact; cycle segmentation thresholds; synchronization), and small errors can propagate multiplicatively when computing power. By contrast, the AI estimate leverages stable anthropometrics (body mass, stature, chair height) and global timing over a 30-s window, which tends to dampen trial-to-trial fluctuations. This interpretation aligns with prior reports showing that while force-plate hardware is itself highly reliable under strict protocols, measurement properties are sensitive to the test and metric chosen and to the data-reduction workflow adopted by users.24,25
A second plausible explanation for the slightly lower reliability seen in the criterion metrics is that force plates and IMUs are inherently sensitive to movement strategy. Subtle differences in foot placement, trunk inclination, or braking/propulsion patterns can alter peak or average GRF without necessarily changing repetition count. That sensitivity is valuable for mechanism but can manifest as additional “true” variance across repeated efforts. Contemporary work confirms that derived GRF metrics can be highly reliable yet still vary with protocol choices and micro-strategies, emphasizing the importance of consistent setup, attachment, and analysis pipelines.25,26 Collectively, these considerations explain why the criterion’s reliability, while good–excellent, trailed the AI method in our data and underscore the practical value of trial-level, time-averaged estimates for routine clinical deployment.24
From an implementation standpoint, 2D markerless capture offers practical advantages by eliminating markers and wearables, reducing setup time, and enabling assessments in space-constrained environments or via telehealth.22 Embedding AI-derived STS power into workflows could sharpen risk stratification, inform individualized rehabilitation dosing (e.g., velocity-specific strengthening), and enhance longitudinal monitoring of treatment response.3,4,15,16 Reporting relative power (W·kg-1) alongside absolute watts will facilitate comparisons to normative datasets and supports equitable interpretation across body sizes.27 The relative 30STSPT results of the tested cohort are consistent with the previously published age and gender matched normative values,13,27 which provides further confidence in the accuracy of 2D AI-derived power values.
Added Value of GRF and Relative Power Beyond Repetition Counts
A natural counterargument is that if relative power (W·kg-1) correlates strongly with repetitions in 30 s, clinicians might simply count repetitions. Conceptually and empirically, however, GRF-informed power provides additional and actionable information that repetition totals alone cannot capture. Power integrates both the magnitude of force and the speed of movement; two patients can perform the same number of repetitions with very different force–time profiles. GRF (especially normalized to body weight) quantifies the force component directly, while repetition count conflates force production with pacing and endurance. In large cohorts, relative 30-s STS power shows stronger associations with mobility-relevant outcomes (e.g., maximal gait speed) than do repetition or time scores, indicating superior construct validity for functional capacity.9,17
Translationally, relative power provides a body-size–adjusted lens that enhances between-person comparability and supports meaningful thresholds for risk stratification. Recent work has proposed sex-specific cut-offs for low relative 30-s STS power linked to frailty and adverse events, a level of interpretability that repetition counts do not currently afford.17 Moreover, when STS performance is expressed as a power index rather than a time/repetition score, associations with walking performance and training-induced change tend to strengthen, reinforcing that the power construct captures functionally salient capacity.28
From a measurement perspective, repetition counts are coarse and susceptible to ceiling effects in higher-functioning adults, whereas power provides a continuous, more granular distribution—improving discrimination and responsiveness. Contemporary reliability studies of STS-based power methods (including laboratory-referenced and transducer-based approaches) demonstrate high reproducibility and strong validity against reference measures. These studies support their use when the clinical question extends beyond a numerical value of completed repetitions to the quality and detailed execution of the accomplished task.29 Practically, we recommend reporting both outcomes: (1) repetitions for familiarity and communication, and (2) relative power (W·kg-1) for mechanism, risk stratification, and goal setting. If desired, the relationship between repetitions and normalized GRF (or power) can be quantified in this dataset (e.g., correlations and partial correlations adjusting for body size), but existing evidence already indicates that power adds clinically relevant signal beyond count alone.4,9
Strengths and Limitations
Strengths of this study include a rigorous criterion integrating bilateral vertical GRF with IMU-based displacement, repeated trials to quantify reproducibility across both pipelines, and targeting a construct, 30STSPT, with established translational relevance. Limitations of the current study include a sample of healthy adults aged 20–55 years, which limits generalizability to frail older adults or clinical populations in which movement strategies, fatigue, balance demands, and use of compensatory mechanics could affect pose tracking. Though early unpublished data suggests comparable accuracy in the older adult and clinical populations (i.e., post total joint replacement and knee osteoarthritis), future investigations will seek to formally establish the psychometric properties of the 2D AI-derived power values in different clinical populations. The rationale for the healthy demographic reduced the confounding variables of disability or disease contributing to any variability in the results’ accuracy or reliability. Future investigations will seek to establish the psychometric properties of the 2D AI-derived power values in clinical populations. Although camera placement, lighting, and occlusion were standardized, real-world variability may affect key point tracking; robustness in home and field environments warrants evaluation. For example, the AI software used requires that no other people or faces (i.e., photos or pictures) be in the frame of capture, as the software will be unable to differentiate such persons, figures, or images from the actual person performing the STS assessment. Finally, a single 2D system was studied; comparisons with multi-camera 3D markerless systems may clarify incremental value for out-of-plane motion and asymmetry detection.
Future work should establish the validity, reliability, MDC, SEM, and minimal clinically important of the AI-derived 30STSPT across a variety of clinical populations (e.g., sarcopenic, frail, osteoarthritis, lower extremity total joint arthroplasty, COPD, Parkinson’s disease, and younger cohorts returning to activity or sport after lower extremity injury) and larger cohorts of healthy individuals spanning across the lifespan (i.e., children, adolescent, and older adults). Continuing to explore the ecological applicability in telehealth deployment with automated quality checks for different environments and lighting is of important utility and value for widespread adoption across various clinical settings and providers. Incorporating agreement analyses (e.g., Bland–Altman) across multiple sites and cameras will help bound bias and support calibration procedures for multi-center use. Moreover, determining the responsiveness of the AI-derived power metrics (i.e., total watts, relative STS power, and power fatigue indices) to exercise based or other medical interventions within well-designed randomized rehabilitation trials is also needed.
CONCLUSION
The results of this study demonstrate that a 2D AI-based camera system provides a valid and highly reliable method for quantifying lower-limb muscle power during the 30-second Sit-to-Stand Power Test (30STSPT). AI-derived power values showed excellent agreement with a dual force plate + IMU criterion across two trials (Trial 1: r = 0.945, 95% CI 0.861–0.979; Trial 2: r = 0.934, 95% CI 0.833–0.975), with predictable bias and clinically interpretable limits of agreement. Test–retest reliability for AI-derived power was excellent (ICC(3,1) = 0.942, 95% CI 0.860–0.977), with low measurement error (SEM = 0.362 W·kg-1; MDC₉₅ ≈ 1.00 W·kg-1). Criterion reliability was slightly lower (ICC(3,1) = 0.916, 95% CI 0.790–0.968) and exhibited greater measurement error (MDC₉₅ ≈ 1.36 W·kg-1).
These findings underscore the feasibility of leveraging markerless computer vision to deliver objective, scalable performance metrics without the logistical burden of laboratory instrumentation. By enabling rapid, automated calculation of relative power—a construct strongly linked to mobility, independence, and health outcomes—the AI approach addresses a critical gap between research-grade assessment and routine clinical practice. Future research should extend validation to diverse clinical populations, evaluate responsiveness to intervention, and explore integration into telehealth workflows. Ultimately, embedding AI-derived power metrics into rehabilitation and preventive care paradigms may enhance risk stratification, guide individualized exercise prescription, and improve longitudinal monitoring of functional capacity.
ACKNOWLEDGMENTS
The authors thank all participants who were part of this study.
CONFLICTS OF INTEREST DISCLOSURE STATEMENT
The authors report no professional or personal conflict of interest. There was no funding for the current study and thus, no financial conflict of interest in conducting the current study.