

INTRODUCTION
Injuries to the throwing arm in baseball pitchers continue to rise. Ulnar collateral ligament (UCL) injuries of the elbow represent a persistent and escalating challenge in sports medicine. Over the past two decades, the incidence and severity of these injuries have escalated dramatically at every level of play, from youth leagues to the Major League Baseball (MLB).1–6
Epidemiological studies consistently report that UCL injuries account for a significant proportion of all injuries in baseball pitchers, with rates of non-surgical UCL injury increasing nine-fold among high school and collegiate athletes between 2009 and 2016.7 Previously published reports have shown approximately 26% of professional MLB pitchers and over 19% of minor league pitchers have undergone UCL reconstruction (UCLr) at some point in their career.8 However, unpublished data from Major League Baseball has shown this percentage to be over 39% in 2025.9 Alarmingly, this trend is not confined to professionals as the median age of athletes undergoing UCL surgery has fallen in recent years, with UCLr rates rising most rapidly in late adolescent athletes, particularly those aged 15–19 years.3,4,10
The growing burden of UCL injuries has led to innovation in surgical management. Autograft UCLr, commonly referred to as “Tommy John” surgery, has traditionally served as the standard of care for high-grade tears, typically requiring extended recovery and rehabilitation intervals. However, emerging evidence supports the expanding role of primary UCL repair with internal brace augmentation in selected patients. Specifically, a recent comparative outcome study demonstrated that UCL repair with internal brace can yield functional outcomes equivalent to reconstruction, with a similar likelihood of return to sport (approximately 98–99%) and low revision rates.11 A key clinical advantage is the shortened rehabilitation timeline; athletes undergoing repair with internal brace may return to competition in as little as six to nine months, compared to 12–18 months after traditional reconstruction.11 Between these extremes, hybrid reconstruction with internal brace augmentation has emerged as another promising surgical option, offering theoretical benefits of mechanical reinforcement while retaining the biological healing advantages of graft-based reconstruction.12 These advances have collectively expanded the array of surgical options available, enabling more individualized approaches tailored to patient age, level of play, injury chronicity, and anatomic considerations.
An important aspect of the rehabilitation of baseball players is the interval throwing program (ITP), a stepwise protocol that gradually reintroduces throwing stress, aiming to rebuild arm strength while minimizing overload. Traditionally, ITPs have been based on expert consensus, empirical timelines, and invalidated metrics of workload, such as perceived intensity or throwing velocity assessed via radar.13 Recent advancements have leveraged computational modeling and biomechanical workload analysis to refine workload progression based on torque measurements. Using the workload models of Dowling et al.,14 Reinold et al.15 recently published a modern ITP that maps the biomechanical load of each throw based on elbow varus torque, enabling quantification of acute and chronic workload and facilitating a graduated return to throwing intensity. This data-driven program demonstrates a consistent buildup of workload and, critically, avoids abrupt workload “spikes” that are associated with increased injury risk.16–20 Reinold et al.15 suggested that their program was designed for long duration rehabilitation protocols, such as after traditional UCL reconstruction.
Because of the variety of surgical and non-surgical options for the management of UCL injuries, it is important to develop ITPs of different duration to account for the variability in return-to-sport timelines. Thus, the purpose of this paper is to describe four ITP variations of various durations based on the workload and ITP presented by Reinold et al.15 that can be used for a variety of non-operative and postoperative injuries in baseball players. While these programs can be used for a variety of shoulder and elbow injuries, the application of these programs for UCL injuries will be explored.
METHODS
Data source and modeling
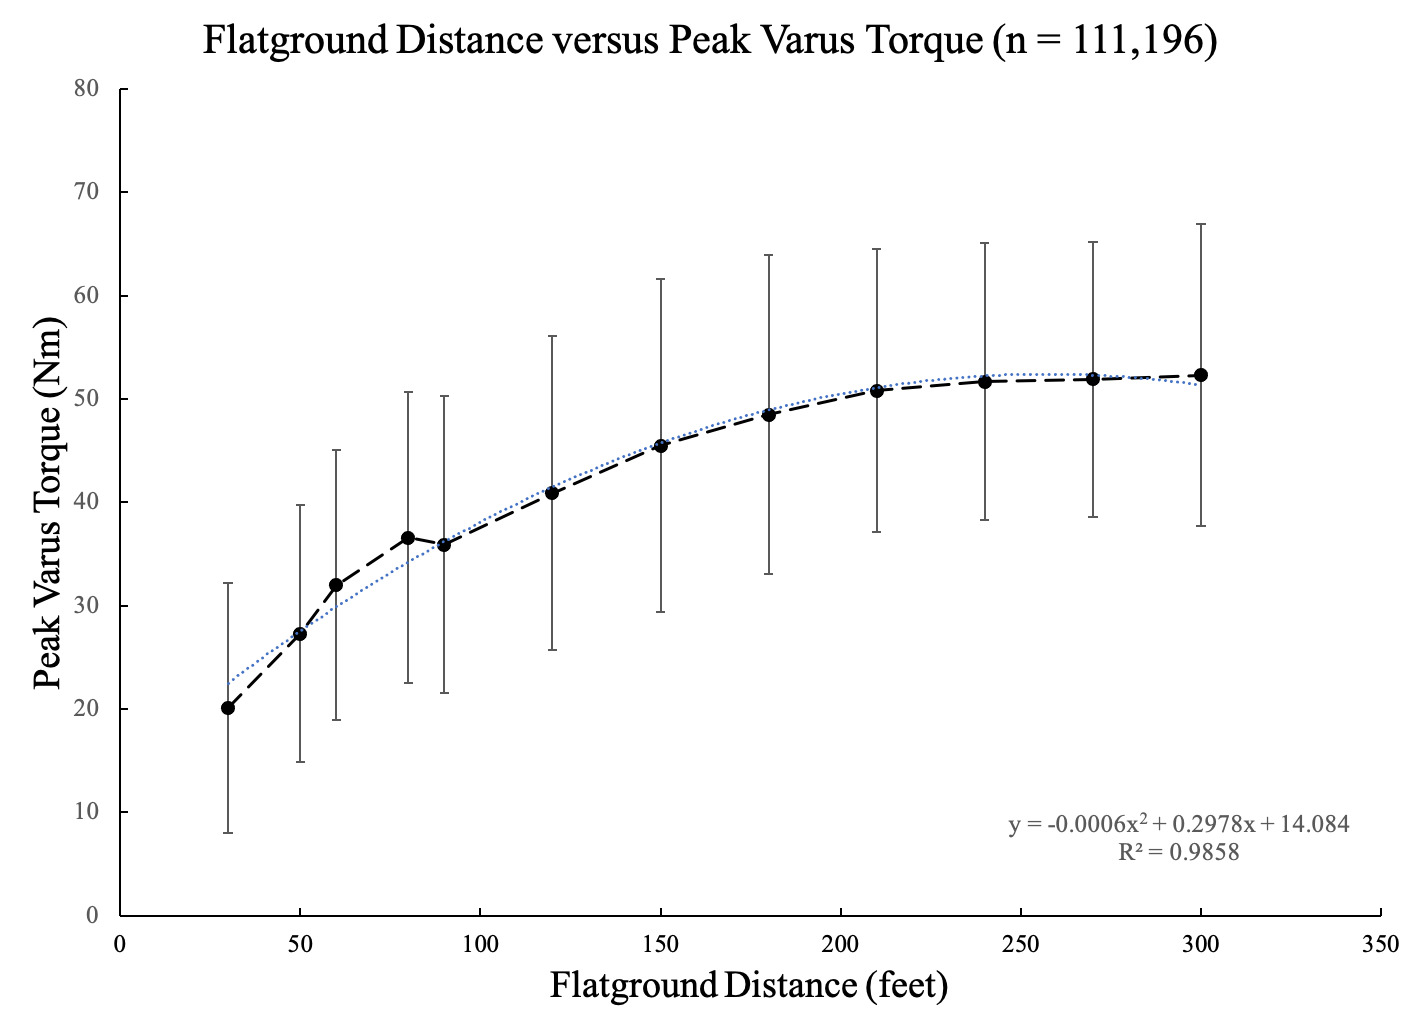
Elbow varus torque for each modeled throw was estimated using a previously established relationship between throwing distance and peak elbow varus torque. This relationship was derived from a large data set of 238,611 flat-ground throws collected from 34 healthy NCAA-Division 1 baseball athletes (n=34, 186 ± 7 cm, 89.4 ± 10.8 kg). All throws were performed during flat-ground throwing sessions spanning 30 to 300 ft. Only distances with greater than 1000 recorded throws were included to ensure the stability of the model. A second-order polynomial regression was used to characterize the relationship between throwing distance and peak elbow varus torque (Figure 1). During data collection, wearable sensor and sleeve (Driveline Pulse; Driveline Baseball, Went WA) placement was standardized and verified by a single investigator (BD) throughout the data collection to ensure measurement quality.

Wearable Sensor Validity and Reliability
The wearable sensor used to generate the distance-torque model has demonstrated strong validity and reliability in prior validation. Camp et al.21 reported high agreement between sensor-derived and motion capture-derived elbow varus torque (r = 0.93). Intra-thrower reliability has been reported as excellent, with Reinold et al.22 observing an intraclass correlation coefficient of 0.99, and Leafblad et al.23 describing excellent test–retest reliability for this device in an independent cohort. Collectively, these findings support the use of the sensor as a valid and reliable tool for quantifying throwing arm loads; although its outputs might not be identical to 3D motion capture, they represent a consistent, field-deployable measurement system that provides a complementary method for estimating elbow varus torque in applied settings.
Workload Calculations
The validated model was applied to construct 3 distinct new ITPs of varying duration: 6 weeks, 12 weeks, and 5 months, in addition to the previously published 7-month program.15 Each program was designed to progressively increase throwing workload through controlled manipulation of throwing volume and distance) while striving to maintain the ACWR in the optimal range throughout the entire program. Previous research has shown that injury risk increases when the ACWR either surpassed or fell below an optimal range of 0.7-1.3.18,20,24,25
For each program, every prescribed throw was assigned a distance and intensity consistent with contemporary return-to-throw progressions, and the corresponding peak elbow varus torque was estimated using the established distance–torque relationship. Daily workload was calculated as the sum of estimated torque across all throws for that day, and these values were used to derive rolling 7-day (acute) and 28-day (chronic) workloads. Acute-to-chronic workload ratio (ACWR) was calculated as the ratio of the average daily workload from the previous seven days compared to the average daily workload from the previous 28 days.
Interval Throwing Program Development
The initial phase of all the ITP variations began with throws between 30 and 45 ft, followed by gradual increases in both throwing distance and volume until 120 ft was achieved. This progression was designed to promote confidence with throwing while allowing for a controlled and steady increase in chronic workload. Long toss throwing past 120 ft was not included in this program as past research has reported that the torque observed at 120 ft is similar to pitching off a mound.26–28 Once an athlete reaches 120 ft, their tissues are prepared for the throwing load experienced off the mound.
Previous modeling has demonstrated that throwing every other day with two rest days per week maintains ACWR within the optimal range and minimizes large workload fluctuations.14 Long toss throwing sessions incorporated throwing with a step/shuffle and arced trajectory to allow distance to dictate intensity, progressing towards an on-the-line throw as tolerance improves. Once pitchers completed the long toss phase, they were instructed to perform flat-ground pitching to reacclimate to the pitching motion from a stationary position before initiating the mound phase.
Athletes transitioned to the structured mound sequence designed to replicate the gradual return to competitive throwing demands. This progression incorporated alternating light and heavy flat-ground days, bullpen sessions, and light catch to modulate daily workload. Higher intensity throwing days included pulldowns, in which athletes performed a shuffle step and delivered the throw with intent on a line. Mound throwing began with fastball pitches delivered at 50% effort, progressing incrementally to 75%, 90%, and ultimately 100% as tolerance improved. Secondary pitches were reintroduced in a staged manner. As previous biomechanical findings demonstrated differences in elbow varus torque among fastballs, curveballs, and sliders (with greater torque throwing fastballs),29–31 specific pitch distributions were not prescribed, allowing for individualized variation based on the athlete’s repertoire.
Strategically placed ‘deload’ weeks were incorporated into the longer duration five-month and seven-month programs. These periods of reduced training load are common within strength and conditioning practices32 and designed to mitigate physiological and psychological fatigue, promote recovery, and enhance preparedness for subsequent throwing sessions.33 The lower volume periods consisted of three days of light shorter distance throwing only. Each deload week was tailored relative to the surrounding workload to facilitate smooth transitions and minimize abrupt changes in workload.
RESULTS
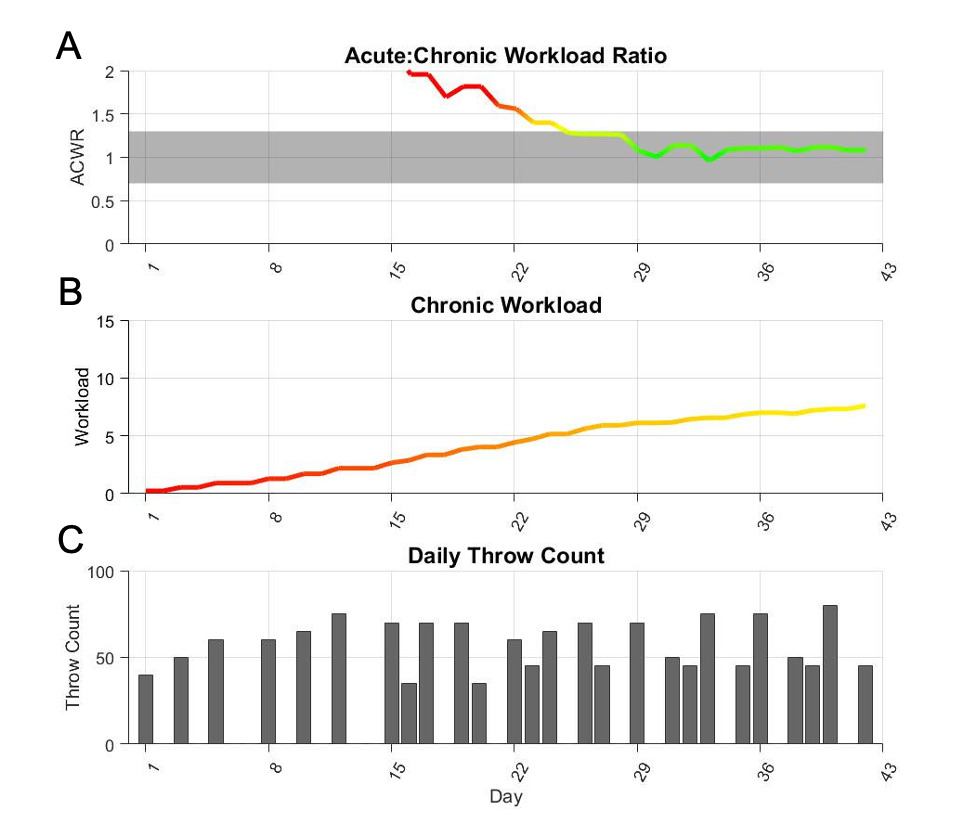
The 6-week program was 42 days (Figure 2 and Appendix 1). The flat-ground progression was 28 days with 19 days of actual throwing. The mound progression was 14 days with 10 days of throwing which included four bullpens. The program finished with a chronic workload of 7.6. After the initial 28 days, the program’s ACWR stayed within the optimal range (0.7-1.3) for entire duration of the program.
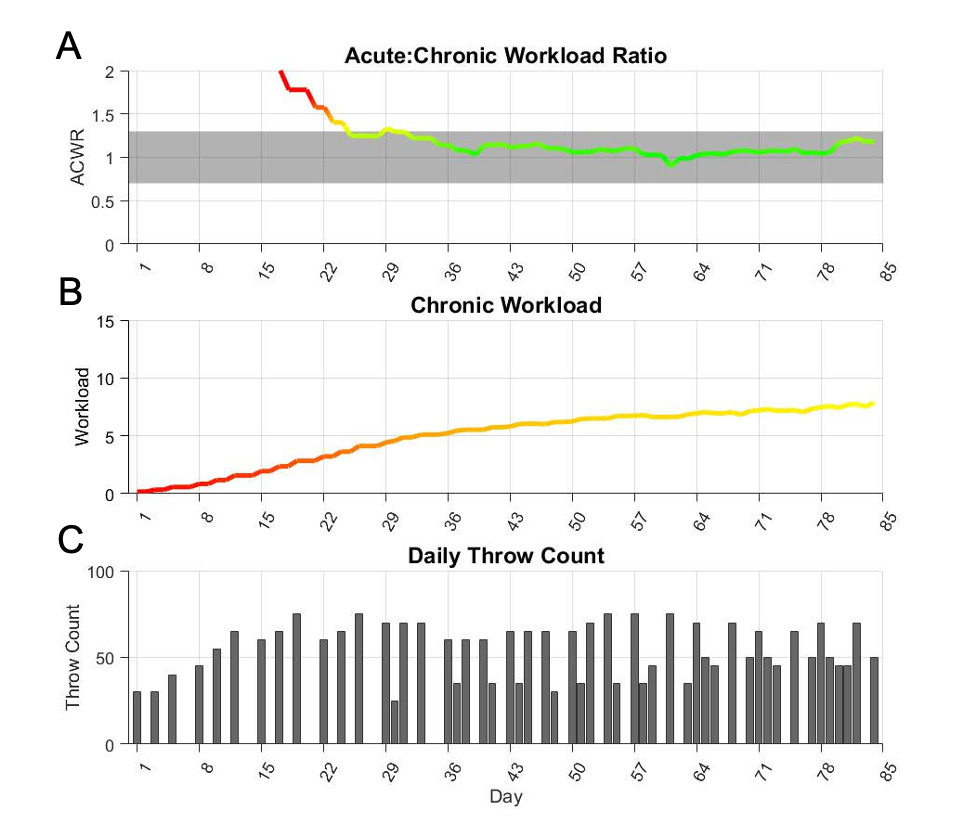
The 12-week program was 84 days long (Figure 3 and Appendix 2). The flat-ground progression was 56 days with 31 days of throwing. The mound progression was 28 days with 21 days of throwing, which included 8 bullpens. The program finished with a chronic workload of 7.9. After the initial 28 days, the 12-week program did not deviate below the optimal range (0.7) the entire time but did go slightly above 1.3 only one time to 1.33. Thus, ACWR stayed within the optimal range (0.7-1.3) for 98% of the time.
The 5-month program was 140 days long (Figure 4 and Appendix 3). The flat-ground progression was 56 weeks with 24 days of throwing, which included one deload week. The mound progression was 84 days with 53 days of throwing, which included 17 bullpens and 2 deload weeks. The program finished with a chronic workload of 10.0. After the first 28 days, ACWR slightly exceeded 1.3 only 1 time, peaking at 1.31. ACWR stayed within the optimal range (0.7-1.3) for 95% of the program.
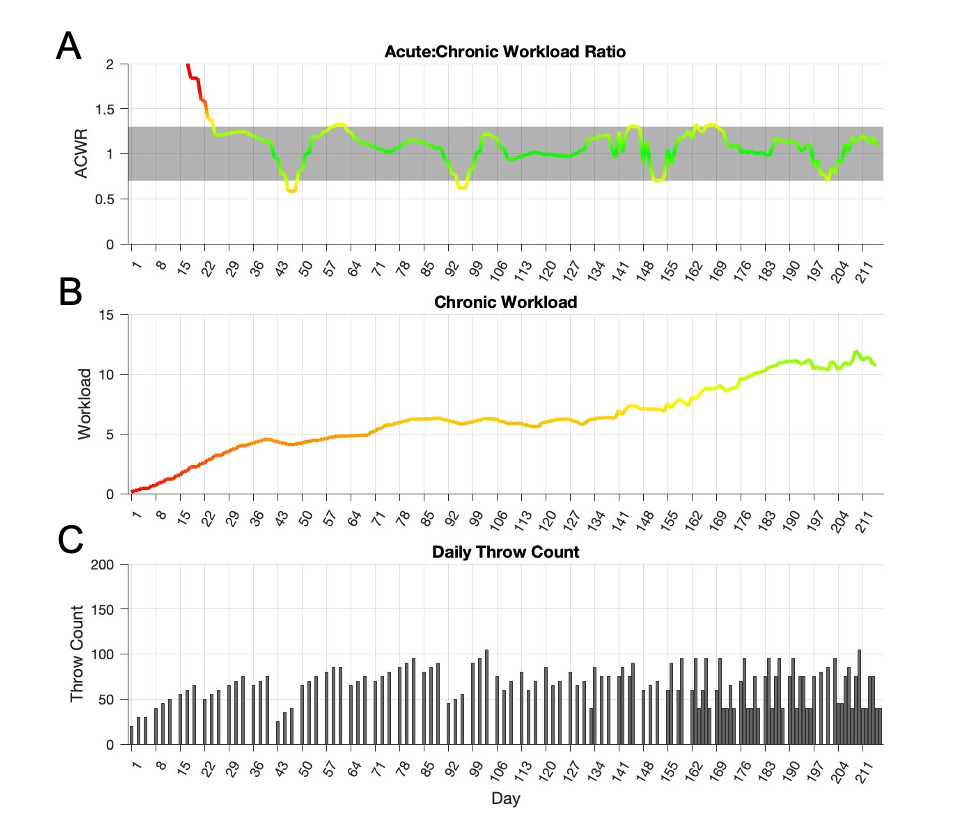
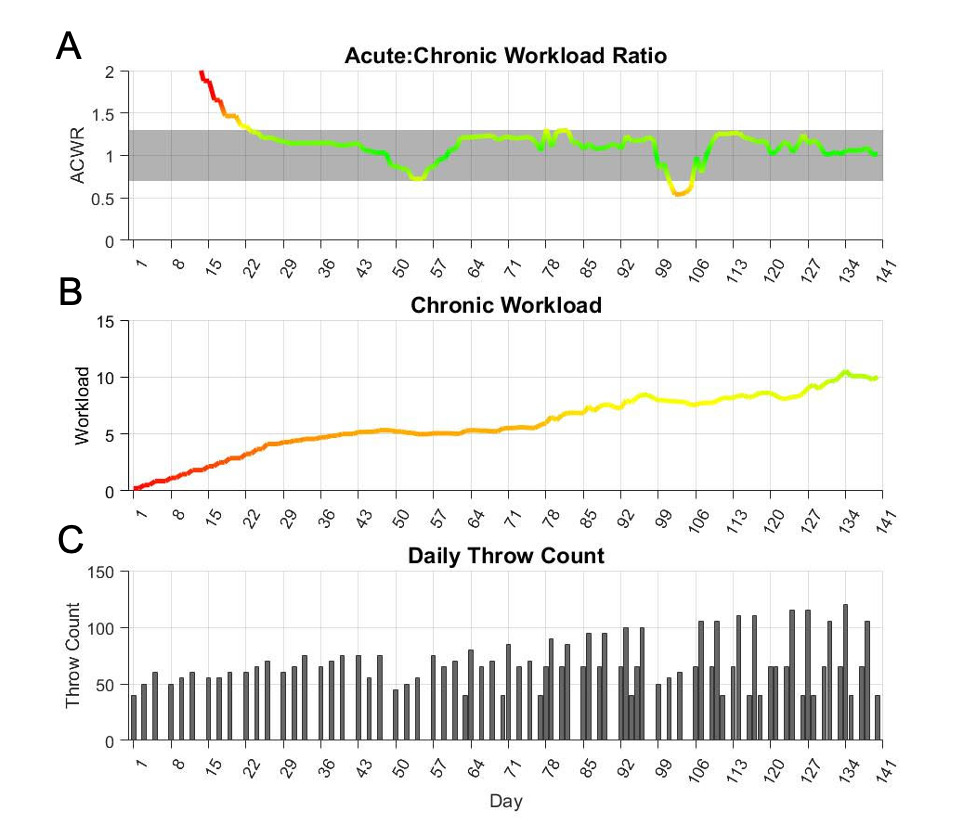
For comparison, the originally published 7-month program15 was 217 days long (Figure 5 and Appendix 4). The flat-ground progression was 105 days with 45 days of throwing, as well as 1 deload week. The mound progression was 112 days with 75 days of throwing, which included 19 bullpens and 2 deload weeks. The program finished with a chronic workload of 10.8. After the initial 28 days, the program’s ACWR exceeded 1.3 11 times, peaking at 1.33, and fell below 0.7 7 times. ACWR stayed within the optimal range (0.7-1.3) for 91% of the program.


DISCUSSION
The 7-month ITP developed by Reinold et al.,15 grounded in biomechanical workload data, provides a robust framework for a long-term rehabilitation, such as UCLr . These programs were designed to monitor and gradually apply the accumulation of elbow varus torque, which the authors believe to be the most clinically relevant variable to build workload programs in comparison to other variables, such as radar velocity. Elbow varus torque is directly related to UCL stress and UCL injury.34,35 While these programs were designed based on elbow varus torque, the authors do not feel that this is a limitation for their use for injuries to other areas of the body. The programs can be used for a variety of shoulder and elbow injuries as past biomechanical studies have shown correlations between elbow and shoulder torque during throwing programs.28
Building on the model, three additional ITPs of varying duration were created to accommodate return timeframes associated with a broader spectrum of throwing related shoulder and elbow injuries and surgical procedures. These new programs were designed to reflect contemporary throwing practices that are familiar to today’s baseball athletes and caching staff.15 Rather than relying on traditional set- and repetition-based throwing prescriptions,13 each program emphasizes here a gradual progression in throwing workload, with every throwing session representing a deliberate increase in workload. Across all programs, long toss distance progresses systematically from 30 to 120 ft, with concurrent increases in throwing volume and weekly throwing frequency. Throwing intensity is primarily dictated by distance, with addition of increased intent during pull-down phases later in the program.
A distance-based approach was favored over velocity-based radar progressions because elbow varus torque has demonstrated a stronger relationship with throwing distance than with ball velocity,23 making distance a more biomechanically meaningful surrogate for intensity during rehabilitation progressions. Prior work has shown that long toss throwing can produce disproportionately higher joint loads relative to ball velocity, with 78% of maximal ball velocity corresponding to 87% of maximal elbow varus torque.36 To date, there has been no evidence offered that validates velocity-based progressions as a more efficacious methodology for an athlete to return to pitching faster or safer. Velocity metrics may be gathered throughout a throwing progression to monitor intent. However, if velocity is used as a workload metric it can easily lead to higher workloads compared to distance based programs and is therefore not recommended as a basis of progression during an interval throwing program.
The chronic workload progression of each program was designed to prepare the athlete for the cumulative demands of in-season competition by the end of the ITP. The previously published seven-month program builds to a final chronic workload of 10.8. The final chronic workloads for the three new ITPs presented herein were 7.6 for the 6-week, 7.9 for the 12-week, and 10.0 for the 5-month program. These chronic workload values were selected to align more closely with chronic workloads observed during a typical competitive season, in contrast to historic throwing programs that have been shown to either exceed or fall short of in-season workload levels.14,15 The authors believe this approach facilitates a more successful initial return to competition while reducing excessive fatigue and overuse that can negatively impact performance and velocity development during the first season back.
In addition to chronic workload, all programs were constructed to maintain the ACWR within the desirable range (0.7-1.3) for the majority of the program. This design minimizes spikes or drops in workload which have been associated with increased injury risk.18,20,24,25 The 6- and 12-Week programs did not have any deviations from the optimal ACWR after the initial 28 days. The 5-month program deviated slightly from the desirable ACWR range six times throughout the program, which largely occurred during planned increases in volume or intensity; however, these excursions remained limited in magnitude and duration compared with traditional return-to-throwing approaches that often produce larger, unplanned spikes in workload.14,15 By applying the same workload model across multiple program durations, clinicians are provided with flexible evidence-informed options that can be tailored to a wide range of injuries, timelines, and athletes. Most importantly, the chronic workload buildup and ACWR in each program ensure a gradual application of load within the desirable ranges. Anecdotally, the authors believe the use of programs based on biomechanical workload data have been effective at returning athletes back to competition without set-backs, delays, or reinjury, and allow athletes to be more effective and successful their first season back than previous ITPs that demonstrated higher chronic workloads at the conclusion of the program.
Clinically, these programs can be used for a variety of injuries; however, exploring the use of these programs in the context of UCL injuries provides a clinical example. For nonoperative injuries, athletes are often instructed to abstain from throwing during the initial phases of rehabilitation for six weeks. The six-week and 12-week programs can be used based on the competition level of the athlete, timing of the year, and extent of the pathology. Typically, athletes are progressed through the six-week program in attempt to return to play again during the same competitive season or determine if surgery may ultimately be needed. For younger athletes with less significant pathology or injuries that occur towards the end of the season, a slower progression of 12-weeks can also be used. The six-week and 12-week programs can be applied to a variety of nonoperative injuries, for a return to throwing after a less invasive surgery such as elbow loose body removal, or even used as a ramp up to prepare for the season in healthy athletes.
Due to the nature of the UCL repair with internal brace procedure, athletes are allowed to progress through a rehabilitation program faster than a traditional reconstruction. In the authors’ experience, athletes often begin an ITP at approximately 10-12-weeks following surgery and progress through a five-month ITP, allowing an athlete to return to sport around seven to eight months postoperatively.
The 7-month ITP may be used for both traditional UCLr, as well as the hybrid reconstruction with internal brace. While the duration of the ITP does not change between these procedures, the start date of the program after surgery does vary. The hybrid procedure typically begins the ITP one month earlier; that is, the ITP begins at Week 20 for a UCLr versus Week 16 for a hybrid reconstruction with internal brace. This allows the athlete to return to sport around 11-12 months after these procedures, with some athletes returning as early as 10 months under ideal conditions. The 7-month program may be applied to gradually increase throwing exposure during rehabilitation protocols following procedures for capsulolabral tears, SLAP tears, rotator cuff injuries, and latissimus injuries, as an example. It should be noted that the present workload model is based on estimates of elbow varus torque and does not necessarily apply to shoulder kinetics. However, prior biomechanical studies have demonstrated that shoulder internal rotation torque during throwing is similar in magnitude to elbow varus torque,28,30,35,37 suggesting that the shoulder is subjected to comparable loading demands. Given the incidence of shoulder pathology in baseball players, future research should expand upon this framework to incorporate shoulder kinetic modeling and investigate its relationship to throwing distance and volume.
This study has several important limitations that warrant consideration. The workload analyses were derived from data sets of healthy college athletes and may not fully capture loading patterns in athletes of different demographic or competition levels, as well as athletes who have been injured and are rehabilitating with the intention of returning to sport. These results present general outcomes. Relationships between elbow torque, workload, and specific pitch types are likely influenced by age, body size, and throwing mechanics, so ITPs should be tailored to the unique demands of each athlete. Additionally, the most appropriate ITP structure may differ depending on the underlying diagnosis and stage of rehabilitation, as well each athlete’s unique response and pain level during the program.
CONCLUSION
Three new interval throwing programs spanning 6-weeks, 12 weeks and 5-months were developed using biomechanical workload data from healthy, uninjured baseball players using the same modeling framework as the previously described 7-month program.15 Collectively, these four ITPs provide clinicians with a variety of evidence-informed options that can be matched to the athlete’s injury severity, surgical procedure, competitive calendar, and time constraints while maintaining consistent workload principles. Each program systematically builds chronic workload and constrains the ACWR within recommended ranges, offering a practical strategy to progress throwing volume and intensity while minimizing large workload spikes during return to pitching after shoulder and elbow injury. Clinicians are encouraged to select the program duration that best fits the individual athlete and to integrate workload-based monitoring with clinical findings (pain, strength, range of motion) when advancing or regressing phases of rehabilitation