Introduction
Anterior cruciate ligament (ACL) injuries represent one of the most common causes of knee dysfunction among athletes and physically active individuals.1 In Italy, more than 30,000 ACL reconstruction (ACLR) procedures are performed each year, with the highest incidence rate per year in 100,000 inhabitants of 3,711 ACLR performed per 100,000 inhabitants observed in individuals aged ≥15 who participate in high-impact sports such as soccer, skiing, and basketball.2,3 ACL injury results in a substantial loss of knee joint stability and neuromuscular control, often accompanied by pain, swelling, and proprioceptive deficits that hinder a safe and effective return to sport.4
After ACLR, one of the main barriers to functional and muscle recovery is arthrogenic muscle inhibition (AMI), a neuromuscular impairment in which voluntary quadriceps activation is reduced due to mechanical or nociceptive alterations within the joint.5,6 Despite the anatomical integrity of the quadriceps muscle being preserved, adequate force production cannot be achieved because cortico-spinal drive is compromised.7,8 As described by Rice and McNair, AMI is a clinical hallmark of ACL injury and reconstruction, characterized by the inability to fully contract the quadriceps despite the absence of structural damage or acute pain.9 This phenomenon is driven by altered afferent signaling from the injured/operated joint, including effusion and mechanoreceptor disruption, that modulates both spinal and supraspinal pathways.10,11 While AMI is traditionally associated with the injured/operated limb, contemporary evidence suggests a centrally mediated component leading to bilateral motor reorganization.12 In addition to the quadriceps, the hamstring muscles play a key role in knee joint stabilization by limiting anterior tibial translation and protecting the ACL graft.13 In the presence of reduced quadriceps activation, increased hamstring co-activation is commonly observed as a compensatory strategy to enhance joint stability. However, excessive or prolonged co-activation may contribute to altered knee mechanics and reduced movement efficiency.14
The precise patterns of early post-operative quadriceps inhibition and hamstring co-activation remains poorly characterized. Quantifying these neuromuscular alterations is critical, as they can compromise knee joint mobility and early ACLR rehabilitation outcomes.15,16 The early post-operative period (within the first two to three weeks after ACLR) represents a critical window for neuromuscular recovery, as arthrogenic muscle inhibition is typically most pronounced during this phase due to joint effusion, pain, and altered afferent input. Investigating neuromuscular activation at approximately 15 days post-surgery allows for the assessment of these early inhibitory mechanisms before substantial rehabilitation-induced adaptations occur.17,18 If not addressed, initial or early AMI may evolve from a transient protective response into a persistent dysfunctional motor pattern, contributing to chronic quadriceps weakness and compensatory strategies.19 While many authors have described longer-term deficits, characterizing neuromotor impairments in the immediate post-operative period (e.g., the first two weeks) is essential to understand when inhibitory quadriceps mechanisms emerge and how they generalize.19,20 Specifically, objectively quantifying early alterations in quadriceps voluntary activation and quadriceps/hamstring co-activation in both the reconstructed and contralateral limbs can clarify whether AMI-related patterns are localized or reflect a broader, centrally mediated neuromotor reorganization.21 To compensate for reduced quadriceps efficiency, the nervous system increases hamstring co-activation with the quadriceps as a compensatory strategy.4 Furthermore, individuals with ACLR exhibit increased hamstring co-activation together with reduced voluntary quadriceps activation, resulting in a compensatory pattern that, while passively stabilizing the knee, reduces the mechanical efficiency of movement and promotes the development of knee joint stiffness.22,23 The biceps femoris and the medial hamstrings were analyzed separately because they may exhibit distinct activation patterns: the biceps femoris primarily contributes to lateral knee stabilization and resistance to anterior tibial translation, whereas the medial hamstrings act as key medial stabilizers and have been shown to display selective recruitment patterns after ACLR.24 Comparing these muscles allows determination of whether early post-ACLR co-activation reflects a generalized neuromuscular response or a muscle-specific compensatory strategy associated with quadriceps inhibition in both the operated and non-operated limbs.24 Similarly, the vastus lateralis and vastus medialis were analyzed separately because they may show different inhibition patterns after ACLR: the VM is preferentially affected during arthrogenic muscle inhibition due to its role in active knee extension and patellar stabilization, whereas the VL contributes more to global force generation. Examining both heads allows for a more sensitive characterization of quadriceps activation deficits.25 Early recognition of altered activation patterns is therefore essential for implementing individualized ACLR rehabilitation strategies aimed at restoring extensor activation and limiting excessive hamstring co-activation.11,21,26
Early postoperative neuromuscular adaptations have been only partially described, and there is limited evidence objectively quantifying reduced quadriceps activation and hamstring co-activation in the two first weeks after ACLR particularly with simultaneous analysis of both the reconstructed and non-reconstructed limbs.27 The need to objectify what is currently assessed clinically has led to focused analysis of individual muscles through surface electromyography (sEMG), translating clinical observations regarding the progression of quadriceps activation into quantifiable neuromuscular patterns.
The primary objective of this study was to compare early quadriceps activation and quadriceps/hamstring co-activation patterns between individuals following ACLR and matched healthy controls (CTRL). The secondary objective was to determine whether these neuromuscular alterations were present bilaterally, affecting both the operated and non-operated limbs.16,28 It was hypothesized that individuals post-ACLR would demonstrate reduced voluntary quadriceps activation and increased hamstring co-activation compared to CTRL, as well as bilateral neuromuscular alterations within the ACLR group.
Materials and Methods
Study Design
This cross-sectional case–control study was conducted in accordance with the Strengthening the Reporting of Observational Studies in Epidemiology (STROBE) guidelines for reporting observational studies. Data were collected between July and September 2025 at the Restart Physiotherapy, Rome, Italy. The study protocol was approved by the institutional ethics committee GCS Ramsay Healthcare (COS-RGDS-2025-05-002-FORELLI-F; IRB: 00010835) and was conducted in accordance with the Declaration of Helsinki, and all participants provided written informed consent prior to inclusion.29
Sample Size Calculation
This study was designed as an exploratory feasibility investigation in the acute post-operative period after ACLR (≤ 20 days). Given the narrow recruitment window and the limited availability of robust prior estimates of variability and expected effect sizes for sEMG root mean square (RMS) and co-activation indices in the first weeks after ACLR, an a priori sample size calculation was not performed. Consequently, the sample size was determined by the number of eligible participants available during the study period. This study should therefore be interpreted as hypothesis-generating.
Participants
To reduce heterogeneity related to sex-specific neuromuscular characteristics, only male participants were recruited for this study.30 Patients who had undergone primary ACLR were assessed for eligibility. Inclusion criteria for the ACLR group were: unilateral ACLR using hamstring tendon autograft (non-contact mechanism) within 20 days prior to testing (mean 15.3 ± 0.7 days), a Stroke Test score < 1+, no passive extension deficit assessed with a digital goniometer,31 SANTI group (Scientific Anterior Cruciate Ligament Network International) classification of AMI type 1-2,26 and absence of other known neuromuscular disorders. Exclusion criteria included revision surgery (meniscus repair or meniscectomy, ACLR, cartilage repair, etc), history of contralateral knee surgery, and presence of neurological disorders. The time point of approximately 15 days post-ACLR was selected to capture the early post-operative phase, during which AMI is expected to be most prominent and neuromuscular adaptations are still developing.18 Healthy controls (CTRL) were required to have no history of ACL rupture and no current knee symptoms or pathology. Controls were recruited voluntarily from the local community and hospital staff. Frequency-based age-matching and activity-level matching (Tegner Activity Scale [TAS]: 7.3 ± 1.1) was performed to minimize confounding between groups.
Protocol and Instrumentation
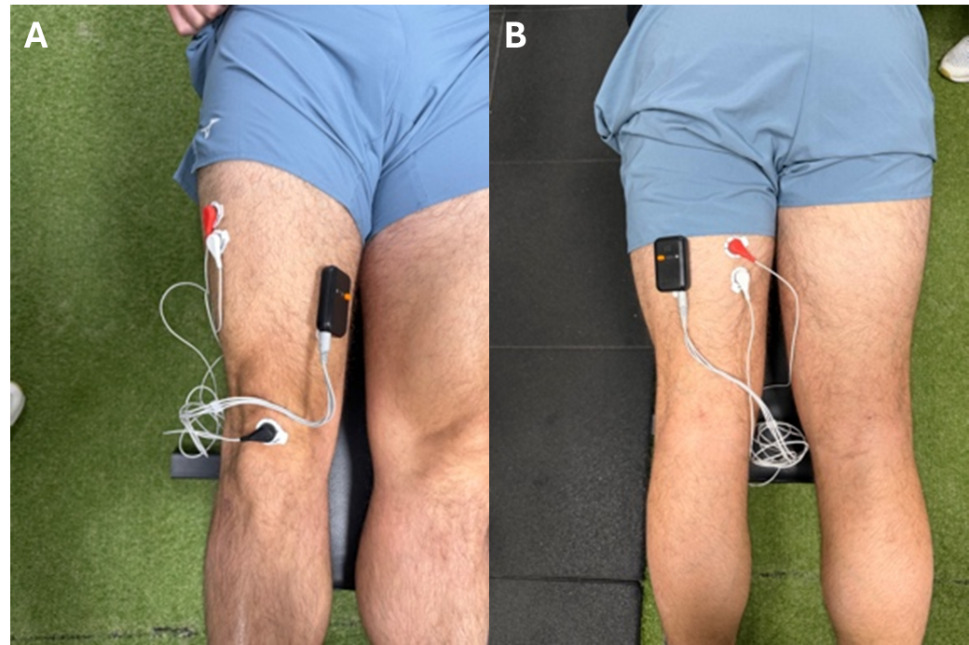
All participants attended a single testing session where sEMG signals were recorded using two dual-channel wireless K-MYO sensors (Kinvent®, Montpellier, France) at a sampling frequency of 1000 Hz. Electrode placement followed Surface ElectroMyoGraphy for the Non-Invasive Assessment of Muscles (SENIAM) recommendations.32 Bipolar electrodes were positioned over the vastus lateralis (VL), vastus medialis (VM), biceps femoris (BF), and medial hamstring (MH). Prior to electrode application, the skin over each muscle belly was prepared in accordance with SENIAM recommendations: hair was shaved when needed, the area was lightly abraded with fine sandpaper and cleansed with a 70% isopropyl alcohol wipe to reduce skin impedance.31 Disposable Ag/AgCl bipolar surface electrodes (inter-electrode distance: 20 mm) were then applied along the longitudinal axis of each muscle. The K-MYO wireless sensors were secured to the corresponding electrode pair through their integrated adhesive interface and additionally fixed with hypoallergenic adhesive tape to prevent sensor displacement during contraction. Specifically, electrodes were placed at two-thirds of the line from the anterior superior iliac spine (ASIS) to the patella for VL, at 80% of the line from the ASIS to the medial joint line for VM, and at 50% of the line from the ischial tuberosity to the lateral femoral epicondyle for BF and from the ischial tuberosity to the medial tibial epicondyle for MH; a reference electrode was secured over the patella (Figure 2). This configuration allowed simultaneous recording from the four muscles of a single limb. Both limbs were assessed during the same session and tested successively using identical procedures, with standardized rest periods between trials.
Participants were positioned supine on the examination table, with the hip in neutral rotation and the knee in full extension (0°), resting flat against the surface. No bolster or roll was placed under the popliteal fossa; participants were instructed to perform a maximal voluntary isometric contraction of the quadriceps by pressing the back of the knee firmly against the table, a position consistent with the standard quadriceps setting exercise commonly used in the early post-operative phase after ACLR.
Each limb performed three maximal voluntary isometric contractions (MVIC), each lasting 5 seconds and separated by 30 seconds of rest. Throughout each contraction, the same standardized verbal command was delivered (“contract your quadriceps as hard as possible for the full 5 seconds”) to maximize voluntary effort. Particular care was taken to minimize compensatory pelvic motion and maintain a consistent testing posture across trials. The supine fully-extended position was selected because it represents the most reliable and clinically reproducible posture in the early post-operative window, when patients typically present with reduced flexion tolerance, joint effusion, and pain that can compromise testing in flexed positions. All testing sessions were conducted by a single trained investigator using a standardized protocol to ensure consistency in electrode placement, participant positioning, and verbal cueing.
Signal processing was performed using the Kinvent Physio application (version 2.22.0). For each MVIC, the software computed the mean RMS (μV) over a stable 3-second plateau window as an index of muscle activation. Co-activation indices (CoI, %) were calculated for the antagonist–agonist pairs VL–BF, VM–BF, VL–MH, and VM–MH using synchronized sEMG signals acquired within the same trial. As no normalization procedure was applied (see below), all mean RMS values are reported as raw EMG amplitudes in microvolts (μV) and should be interpreted as relative within-task activation levels rather than absolute normalized amplitudes. To ensure internal consistency, identical hardware, electrode placement procedures, and software settings were used for all testing sessions, and all recordings were anonymized prior to analysis.
__for_the_biceps_femor.png)
Outcome Measures
The primary outcomes were the raw mean RMS values, expressed in microvolts (μV), for the VL, VM, BF, and MH. For each MVIC, the mean RMS — which represents the signal’s power and reflects the level of muscle activation — was calculated over a 3-second stable plateau window of the 5-second contraction. Among the three MVIC trials performed for each limb, the contraction yielding the highest mean RMS value (i.e., the best of the three trials) was retained for statistical analysis, as this provides the closest estimate of the participant’s maximal voluntary activation capacity for that muscle.
Additionally, CoI were computed for the agonist–antagonist pairs (VL–BF, VM–BF, VL–MH, and VM–MH) on both the operated and non-operated limbs. The CoI was derived from synchronized sEMG signals recorded during the same MVIC trial, and expressed as the relative simultaneous activation of the antagonist muscle as a percentage of the agonist activation. For consistency with the muscle-specific RMS analysis, CoI values were extracted from the same trial selected as the best MVIC for each limb.
Although sEMG normalization to a reference contraction is commonly recommended to enable between-subject comparisons, normalization was not performed in the present study due to the acute post-operative condition (=15 days post-ACLR). In this phase, true maximal voluntary contractions are difficult to obtain reliably because of AMI, which may lead to inconsistent or underestimated normalization values. This limitation is directly related to the presence of AMI, which reduces the ability to fully recruit motor units and may prevent participants from achieving true maximal voluntary contraction. As a result, RMS values obtained during MVIC should be interpreted in light of this limitation, as they may underestimate the actual activation capacity of the quadriceps. Therefore, RMS values are reported in microvolts and should be interpreted as relative within-task activation levels rather than absolute measures of muscle activation capacity. To minimize variability, all recordings were obtained under strictly standardized conditions, including electrode placement, participant positioning, and acquisition settings.
The TAS (range: 0–10; higher scores indicate higher sport/activity demands) was used to quantify physical activity level. For the ACLR group, the scale referred to the pre-injury level, whereas in CTRL it referred to the current habitual activity level..
Statistical analysis
Descriptive statistics are presented as mean ± standard deviation (SD) for continuous variables and as counts (percentages) for categorical variables. Because both limbs were tested, the unit of analysis was defined at the participant level. In the CTRL group, values from the two limbs were averaged to obtain a single reference value per participant, whereas in the ACLR group the involved and uninvolved limbs were retained as separate limb-specific values. Accordingly, between-group comparisons were performed separately for: (i) the ACLR group involved limb vs CTRL, and (ii) the ACLR uninvolved limb vs CTRL (to evaluate potential bilaterality). Within the ACLR group, paired (inter-limb) comparisons were performed between the operated and non-operated limbs. The inclusion of limb-specific analyses was considered essential to address the study objective of exploring potential bilateral neuromuscular adaptations. Comparing operated and non-operated limbs within the ACLR group allows for the identification of asymmetries and the detection of centrally mediated patterns that would not be captured by between-group comparisons alone.
For each outcome, distributional assumptions were assessed visually (histograms/Q–Q plots) and formally (Shapiro–Wilk test). Homogeneity of variance for between-group comparisons was evaluated using Levene’s test. When assumptions were met, independent-samples t-tests were used for between-group comparisons and paired-samples t-tests were used for within-ACLR inter-limb comparisons. When assumptions were not met, the corresponding non-parametric tests were applied (Mann–Whitney U test for between-group comparisons and Wilcoxon signed-rank test for within-ACLR comparisons). All tests were two-tailed with α = 0.05.
To support interpretation in this exploratory study, effect sizes were reported alongside p values. For both the Mann-Whitney U test and the Wilcoxon signed-rank test, the rank-biserial correlation, together with its 95% confidence interval, was calculated and interpreted as an index of effect magnitude and direction. Absolute rank-biserial correlation values of approximately 0.11, 0.28, and 0.43 were interpreted as small, medium, and large effects, respectively; values close to 0 indicated negligible group differences, whereas the sign of the coefficient indicated the direction of the effect.33Analyses were performed using JASP (Version 0.95.3).
Results
Participants
A total of 30 participants were enrolled: 15 individuals who had undergone ACLR and 15 healthy controls. There were no significant differences between the groups. No missing data or analytic exclusions were recorded. Participant characteristics are presented in Table 1.
Inter-group comparisons: ACLR group vs CTRL.
Compared with CTRL, the ACLR group operated limb showed lower site-specific mean RMS at the VL and VM (Table 2), with reductions of approximately 47–55%. Specifically, VL and VM were significantly different (p < 0.001) with an effect size of 0.778 and 0.893 respectively. BF was also significantly different (p = .011) with an effect size of 0.538, whereas MH did not differ significantly between groups (p = 0.250; effect size 0.253).
Compared with CTRL, the ACLR operated limb exhibited higher CoI across all agonist–antagonist pairs (Table 3). Between-group differences ranged from +15.70 to +19.73 %, with the largest difference observed for VM–BF (Δ = +19.73, 95% CI 14.12 to 25.34) and VM–MH (Δ = +19.06, 95% CI 13.20 to 24.92). Effect sizes are reported in table 3.
ACLR group within-subject comparisons
Within the ACLR group, the operated limb showed consistently lower muscle-specific mean RMS than the non-operated limb across all recorded head muscles (Table 4). The largest inter-limb mean reductions were observed in the VL (4.15 ± 2.24 vs 7.54 ± 1.65 μV; Δ = −3.40 μV, −45.0%, p <0.001) and VM (4.07 ± 2.25 vs 8.06 ± 1.87 μV; Δ = −3.99 μV, −49.5%, p<0.001). Significant differences were also detected in the hamstring muscle, with lower mean values in the operated limb for BF (Δ = −1.20 μV, −24.4%, p= 0.030) and MH RMS EMG (Δ = −0.57 μV, −10.7%, p-value = 0.041)
CoI were consistently higher in the operated limb than in the non-operated limb across all agonist–antagonist pairs (Table 3). The largest inter-limb asymmetry was observed for VM–BF (48.83 ± 8.98% vs 33.77 ± 9.83%; Δ = +15.06%, p<0.001), followed by VL–MH (Δ = +13.76%, p-value), and VM–MH (Δ = +12.51%, p=0.002). All inter-limb differences displayed large effect sizes (rank-biserial correlations ranging from 0.850 to 0.983; Table 5).
Discussion
The primary aim of this exploratory case–control study was to characterize neuromuscular activation patterns 15 days after ACLR. In the early post-operative period there is a significant reduction in quadriceps activation with the operated limb exhibiting a reduction in the mean of 47.5% for the VL and 55.2% for the VM compared to healthy controls. The magnitude of these effects further reinforces this interpretation: rank-biserial correlations were 0.778 for VL and 0.893 for VM, both indicating large between-group effects and a strong separation between the ACLR and CTRL distributions. From a clinical and physiological perspective, these effect sizes suggest that the reduction in quadriceps activation represented a substantial early post-operative impairment in the ability to recruit the knee extensors during a standardized maximal isometric task. The larger effect observed for VM may be relevant, as VM dysfunction may contribute to impaired terminal knee extension control and altered patellofemoral mechanics in the early phase after ACLR. The hamstring muscles displayed a divergent pattern in the magnitude of between-group effects: the BF showed a significant but smaller reduction (rank-biserial 0.538, large by conventional thresholds but markedly lower than the quadriceps effects), while the MH was the only muscle with both a non-significant difference and a small effect size (0.253). This dissociation in effect magnitudes between BF and MH is the most important quantitative argument supporting a selective preservation of MH activation and aligns with the hypothesis of a centrally driven compensatory recruitment of the medial hamstrings to provide dynamic posterior stability in the presence of quadriceps inhibition.
The same pattern of large between-group effects emerged for the co-activation indices: rank-biserial correlations ranged from 0.787 (VL–BF) to 0.947 (VM–BF), with all four agonist–antagonist pairs displaying large to very large effect sizes. The largest effects involved pairs containing the VM (VM–BF: 0.947; VM–MH: 0.924), consistent with the previously discussed VM-specific activation deficit and supporting the interpretation that the elevated CoI is primarily driven by reduced agonist drive rather than by hamstring overactivation per se. From a clinical standpoint, the convergence of large effect sizes for both reduced quadriceps activation and elevated CoI provides quantitative evidence that the surgical event produced a coherent and substantial reorganization of agonist–antagonist activation in the early post-operative phase.
It is important to clarify that while these findings primarily reflect a reduction in volitional quadriceps activation, they are likely associated with AMI. Although the present study does not directly assess the full neurophysiological scope of AMI (e.g., through twitch interpolation, H-reflex, or motor unit decomposition), the data quantify its clinical surface expression — i.e., a reduced sEMG amplitude (mean RMS) during maximal voluntary effort — which is consistent with diminished neural drive to the quadriceps but does not allow direct inference at the motor unit level. Parallel to this quadriceps deficit, there was a divergent behavior in hamstring activation; while BF activity was lower than healthy controls, MH activation remained comparable to healthy controls. This ‘medial hamstring maintenance’ may reflect a selective compensatory strategy where the central nervous system preferentially recruits the MH to provide dynamic posterior stability and limit anterior tibial translation in the presence of quadriceps inhibition, with relative preservation of MH activation compared to the biceps femoris. This muscle recruitment is further described by the analysis of CoI, which were 15 to 20% higher in the operated limb compared to controls, particularly in VM–BF and VM–MH pairs. Such elevated CoI may reflect a ‘flexor facilitation’ or ‘stiffening strategy’ aimed at joint protection, though it may concurrently hinder the recovery of terminal extension. Although direct comparisons with normative CoI values are limited by the strong task, joint-angle, and contraction-intensity dependence of co-activation indices, similar elevations of hamstring co-activation have been described in patients evaluated several years after ACLR (e.g. 27% vs 14% in ACLR vs controls during isokinetic knee extension at flexed positions34), suggesting that the early elevations observed here may represent a precursor of a chronic neuromuscular pattern if not adequately addressed during rehabilitation.34 Within-study comparisons with the matched CTRL group therefore provide the most appropriate internal reference for interpreting the magnitude of co-activation observed in this cohort. Crucially, these alterations were not confined to the operated limb, as the non-operated limb also displayed significantly higher CoI in both VL–MH and VM–MH than healthy controls.
It is very important to note, in the absence of sEMG normalization, differences in RMS amplitude between groups should be interpreted with caution, as they may reflect both differences in neural activation and inter-individual variability in signal amplitude. It is important to distinguish between reduced sEMG amplitude and true voluntary activation failure. In the present study, lower RMS values do not directly quantify voluntary activation capacity, as no interpolated twitch or similar neurophysiological measures were used. Rather, reduced RMS amplitude should be interpreted as indicative of reduced neural drive to the quadriceps during the task, which is consistent with the clinical manifestation of AMI. From a mechanistic perspective, this reduction in quadriceps sEMG amplitude may be related to altered afferent input from the joint (e.g., joint effusion, mechanoreceptor disruption), which has been shown to modulate spinal and supraspinal pathways and limit effective motor unit recruitment in the early post-operative phase. However, these interpretations remain speculative, as this study did not include direct assessments of spinal or supraspinal neurophysiological mechanisms.
Limitations
This study has several limitations that should be considered when interpreting the findings. First, an a priori sample size calculation was not performed, as the study was designed as an exploratory feasibility investigation based on the availability of eligible patients within a narrow post-operative window. While the sample size is consistent with similar exploratory sEMG studies, the relatively small convenience sample may limit the generalizability of the results. Given the relatively small sample size and the use of non-parametric analyses for some comparisons, the statistical power may be limited, and the results should be interpreted with caution. Although effect sizes with confidence intervals were reported to support interpretation, these findings should be considered exploratory and require confirmation in larger samples. Additionally, the analytical approach to limb-specific comparisons, while aligned with the study objectives, may increase the complexity of interpretation and should be confirmed in larger studies with more robust statistical power. Second, only male participants were recruited to reduce heterogeneity related to sex-specific neuromuscular characteristics; therefore, these results may not be generalizable to female populations, who may exhibit different neuromuscular activation and co-activation patterns after ACLR.
Third, although sEMG is a standard tool for assessing muscle activation, it is susceptible to cross-talk, which may influence the specificity of the recorded signals and lead to potential overestimation or contamination of muscle activity from adjacent muscles.
Fourth, as previously mentioned, no sEMG normalization procedure (e.g., MVIC, sub-maximal reference contraction) was applied. This was a deliberate methodological choice driven by the acute post-operative condition (~15 days post-ACLR), in which AMI prevents reliable maximal voluntary contractions and may yield inconsistent or underestimated normalization values. As a consequence, mean RMS values are reported as raw EMG amplitudes in microvolts, and between-group differences in RMS amplitude should be interpreted with caution, as they may reflect both genuine differences in neural drive and inter-individual methodological variability (e.g., subcutaneous tissue thickness, electrode-skin impedance). For the same reason, direct quantitative comparisons with studies using different normalization procedures are limited.
Fifth, this study did not directly assess spinal or supraspinal excitability; consequently, mechanistic interpretations regarding the role of the gamma-loop or cortical reorganization remain speculative and should be framed with caution.
Finally, the use of a maximal isometric task does not fully capture the complex, dynamic neuromuscular control required for sport-specific movements; however, this configuration was selected as the most clinically feasible and reproducible option for the very early post-operative period, when patients typically present with limited flexion tolerance, joint effusion, and pain. Future research incorporating larger, multicenter cohorts and dynamic functional assessments is warranted to further validate these early post-operative patterns.
Conclusion
The results of the current study indicate that male patients assessed approximately two weeks after ACLR showed lower quadriceps sEMG RMS amplitude and higher quadriceps–hamstring co-activation in the operated limb compared with matched healthy controls. Higher co-activation values were also observed in the non-operated limb for selected muscle pairs, suggesting that early post-operative neuromuscular alterations may not be confined to the surgical limb. However, because AMI and central mechanisms were not directly assessed, these findings should be interpreted as descriptive evidence of altered task-specific (isometric knee extension exercise) sEMG activation and co-activation patterns. Further longitudinal studies incorporating normalized EMG and direct neurophysiological measures are required to confirm these observations and determine their clinical relevance.
COI disclosure
The authors declare that they have no conflicts of interest.