
INTRODUCTION
Hamstring strain injury (HSI) occur frequently in sport and represent a major issue in terms of participation time loss, which ranges from 8 to 80 days.1–4 Particularly, HSI represents around 17% of muscle injuries in track and field (T&F) and up to 24% of all injuries reported in professional soccer (SOC).5,6 HSI are nine times more frequent in competition than training, underlining its relationship with high intensity demands.2 Two main non-contact mechanisms are commonly described for HSI that affect dominant and non-dominant limbs equally.7–9 The most frequent injury situation occurs during high-speed running (i.e. “sprinting type” mechanism), particularly in the late swing phase, when the hamstrings are subjected to substantial activation and rapid lengthening, as a result of simultaneous hip flexion and knee extension.10–12 Hamstring muscle overstretching (i.e “stretching type” mechanism) also occurs in sport specific-event such as cuts, deceleration or kicks.7,8 However, uncertainty remains about the specific injury etiology when considering overstretch solely or combined effect of overstretch with muscular activation.8 These biomechanical conditions appear to impose excessive eccentric load on hamstring muscle, in a mechanically vulnerable position (i.e. lengthened position), leading to strain injury.
As muscle flexibility may influence hamstring ability to mitigate high strain during sports activities,13 it has been suggested as a modifiable risk factor of HSI14–16 and has been extensively assessed through passive and active evaluations for pre-season, follow-up or return to sport (RTS) testing after injury in SOC and T&F.17–21 However, despite conceptual agreement about the relationship between overall flexibility and (re)injury risk, conventional passive tests are poor predictors of first time or recurrent HSI22,23 and remain elusive for best practices and cut-off criteria to guide RTS decision.24,25 Flexibility data are commonly interpreted through limb symmetry index (LSI), a metric widely used to evaluate athletes’ functional capacities at both prevention and rehabilitation stages, yet the validity and predictive value of LSI related to flexibility remain debated.26 Indeed, previous studies assessing hamstring flexibility through passive tests in healthy SOC and T&F athletes report no asymmetry.18,19 In fact, side to side differences (e.g. in flexibility) may emerge due to the specific constraints imposed by the discipline and could be interpreted as a positive adaptation. Such asymmetries may reflect adaptive responses to sport-specific constraints rather than dysfunction, and their interpretation is therefore highly task-dependent.27 For example, asymmetries in musculoskeletal morphology (i.e. stance leg compared to kicking leg) increase over time among football players.28 Conversely, Avrillon et al. reported no significant between-limb differences in hamstring shear modulus, an index of muscle stiffness, even among expert soccer players.29 The limitations in flexibility assessment and their interpretation through LSI underscore the need to refine current approaches and explore alternative measures that better capture functional and sport-specific adaptations.30
To complement passive flexibility assessment and build rationale around RTS criteria continuum, the H-test was developed by Askling et al. as a dynamic flexibility test evaluating ballistic hip flexion at high angular velocity.31,32 It involves a large hip flexion range of motion, with values approximately 25% greater than those observed during the passive straight leg raise test.31,33 Moreover, moderate posterior-thigh muscle activation occurs toward the end of the hip-flexion, reflecting active lengthening of the hamstrings.33 This likely results in greater hamstring constraint than in any other passive and active flexibility test. Interestingly, when using patients’ self-reported apprehension during the H-test, the RTS time was delayed by seven days and allows a decrease in re-injury rate to only 1-3% in SOC and T&F athletes,34,35 a marked improvement compared to the 17–34% typically reported.36 As a consequence, the H-test is cited as a relevant tool to assess dynamic flexibility ability in published consensus statements25,37 but utilization has failed to reach unanimity, probably because the H-test relies only on subjective measurement. As part of consideration measurement for RTS,38 subjective feedback from the patient must be complemented by objective data. Indeed, subjective assessments can be strongly influenced by stakeholder biases, performance expectations, and the pressure on RTS in competitive sport.39
Therefore, a recent study has investigated two dimensional (2D) video analysis of H-test kinematics and found that it was reliable and valid across test-retest protocol.32 In this context, objective parameters such as range of motion (ROM), hip angular maximal velocity (Vmax) and angle at peak velocity (APV) can be easily measured in clinical settings. However, large databases of results of H-testing in healthy athletes in various sports disciplines at-risk of HSI are lacking. Gathering such data would help to better interpreting results of seasonal screening measurement (i.e. establishing pre-injuries performances) or refine RTS decision threshold in athletes.
The aim of this study was to establish normative values for the main H-test kinematic outcomes in healthy competitive T&F and SOC athletes, and to examine the effects of sport discipline and limb dominance on H-test performance. It was hypothesized that SOC players would exhibit greater bilateral asymmetry than T&F athletes.
MATERIALS AND METHODS
Participants
In this cross-sectional cohort study, recruited participants were competitive T&F and SOC athletes from the department of sports sciences of University Savoie Mont-Blanc. Participants were included if they i) were over 18 years ii) had no history of lower limb or lower back injury in the past six months and iii) were engaged in at least four hours of specific sports training per week (i.e. SOC or T&F). Athletes were included between April the 1st and June 2025. Participants were asked to be free from strenuous physical activity focusing on lower limb posterior chain and hip flexor muscle during the 24 hours before the test. Participants were excluded from the study if they reported pain during the test. All participants received information about the study along with a non-opposition form, and those who did not return the form were deemed to have consented to participation. This study was approved by the local Ethical Committee (2025-09-NORMH) and was conducted in accordance with the ethical standards set out in the 1964 Declaration of Helsinki.
An a priori power analysis was conducted using G*Power software (version 3.1.9.4, Germany) to determine the sample size required to detect a significant interaction effect between group (i.e., discipline) and limb dominance, using a fixed-effects ANOVA model (main effects and interactions). Due to limited specific data on the H-test, the expected effect size was based on33 and set to a moderate value (0.30), acknowledging the variability reported in previous literature.31,32 With significance level and power set at α = 0.05 and a power of 0.80 a total sample size of 111 participants was deemed sufficient.
Procedures
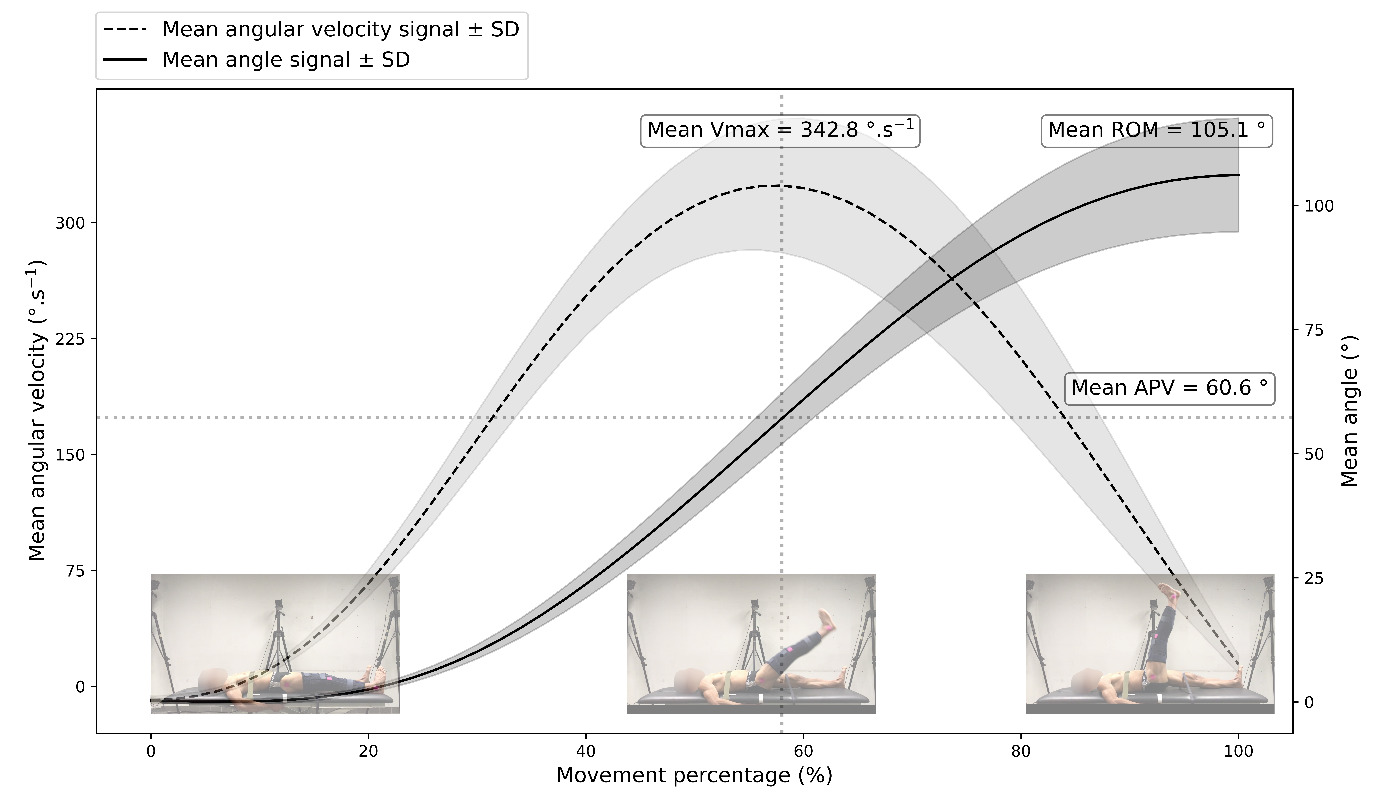
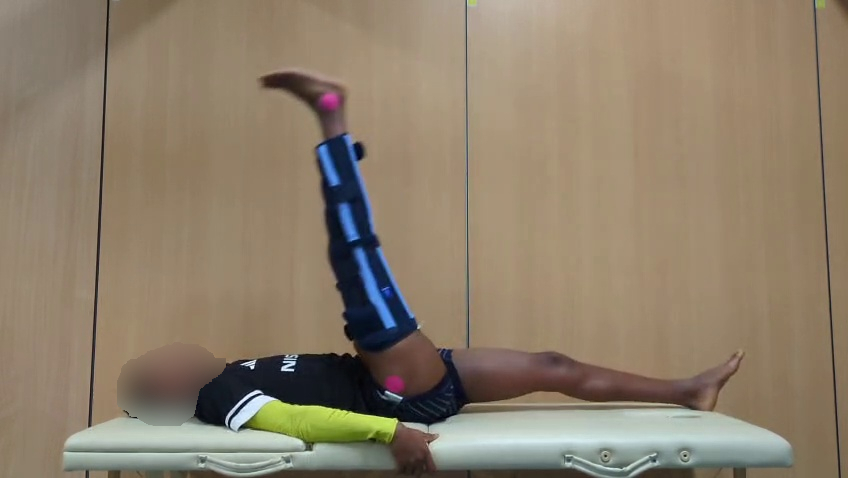
The H-test procedure consisted of three consecutive maximal hip flexion movements in supine position with the knee of the tested leg maintained in full extension by a rigid brace (Figure 1).31 Each movement had to be performed with full range of motion (ROM) at maximal angular velocity (Vmax). Participants were asked to grab the lateral side of the table firmly to avoid any translation of the trunk or pelvis during the movement. Based on preliminary unpublished data, test–retest reliability of this procedure (no straps used to stabilize the pelvis and contralateral limb) was high and comparable with the brace-plus-straps configurations.31 To ensure reliability and improve understanding of the task, a standardized video of H-test’s execution was shown to the participant before familiarization and measurement. A familiarization protocol was then conducted before testing trials consisting of four H-test movements performed to full ROM but with gradual increase in self-perceived hip flexion angular velocity (i.e. about 50%, 75%, 90% and 100% of maximal angular velocity). Participants were asked to relax at least one second between trials,32 with the tested leg and foot maintained in stationary standard neutral position, and to avoid compensatory movement (trunk and neck flexion or contralateral leg displacement) during the test. Each participant performed three trial per limb with both limbs tested in a randomized order. Trials were visually monitored and additional measurement were performed if compensatory movement were observed, following a sufficient rest period, until valid trial was obtained. The dominant limb was defined as the one used to kick a ball as hard as possible with maximum precision.40
Video recording
A set of four passive markers (∅⋍4cm) was placed by the same experimenter on the following anatomical landmarks identified by palpation: bilateral greater trochanters (GT) and the apex of the lateral malleoli (LM). Movements in the sagittal plane were recorded using an Ipad Pro (Apple Inc., Cupertino, CA, USA iOS version 13.2.3, 2.07MPX) with a 60 FPS sampling frequency positioned 2.5m perpendicular to the participants’ sagittal plane using a tripod. Camera lens position was adjusted to fit and align with GT markers.32
Video analysis
Video streams were processed using a custom Python 3.12 script with OpenCV 4.10.0 to extract time dependent planar coordinates of passive markers. Joint angle calculation was processed through geometrical planar vectorial calculation between the vector formed by the current position of GT and LM against the initial GT and LM position. The raw hip flexion angle signal obtained with video analysis was low-pass filtered with a fourth-order Butterworth filter and a 4Hz cutoff frequency. First and second time derivatives of the filtered angle signals were performed to compute angular velocity and acceleration. For each trial, a 10°.s-2 threshold of acceleration was used to identify the beginning of the movement. ROM was calculated as the difference between the initial angle and the peak angle.32 Additionally, Vmax, APV°33 and APV% were extracted from angulation time derivatives signals. Lastly, coefficients of variation (CV) for ROM, Vmax and APV% were extracted, representing the ability to repeat maximal performance and stability across a single session. The LSI (%), calculated as the ratio between the dominant (DOM) and non-dominant (NDOM) limb, for each performance criteria was calculated. An LSI value <100 reflects a non-dominant limb deficit whereas a value >100 a dominant limb one. Each criterion was calculated as the mean of the three trials.
Statistical analysis
Normative values stratified by sport, limb dominance and sex were reported using means ± standard deviation (SD) for each criterion’s raw values (ROM, Vmax, APV° and APV%), as well as for relative within-session variability (CVs calculated from the three repeated trials) and limb symmetry index (LSI). Normality and homogeneity of data were checked using Shapiro Wilk’s and Levene’s test. A two-way ANOVA was used to assess the effects of sport discipline, limb dominance, and their interaction. Due to the low number of included females, no statistical analysis was performed to assess sex differences. The magnitude of difference was interpreted using partial eta squared (ηp²) interpreted with the following guidelines : ηp²<0.01 = Trivial ; ηp²< 0.06 = Small ; ηp²<0.14 = Medium ; ηp²>0.14 = Large.41 Tukey’s post-hoc tests were performed to determine between factors interaction and interpreted using effect sizes through Cohen’s d, according to the following thresholds: <0.2=trivial; 0.2–0.5=small; 0.5–0.8=moderate; >0.8=large.42 Differences were also compared and contextualized using the Minimal Detectable Change (MDC) previously established.32 The level of significance was set at 0.05. All statistical analyses were performed using JASP© software (0.19.3.0, University of Amsterdam).
RESULTS
A total of 116 participants were recruited for this study and three were excluded due to experimental failure during data recording. No participant reported pain during the test. Therefore, 113 individuals were retained for analysis. Participants’ demographic data are summarized in Table 1.
Mean values were 105.1° ± 10.8 (LSI = 101.5%), 342.8°.s-1 ± 49.5 (LSI = 102.7%), 60.6° ± 7.9 (LSI = 100.6%) and 57.6% ± 3.6 for ROM, Vmax, APV° and APV% respectively. These normative values are summarized through kinematic profile in Figure 2. Table 2 presents reference values for H-test kinematic criteria stratified by sport, limb dominance and sex.
_kinematic_profile_for_angle_and_angular_velocity_expressed_.png)
No significant main effects of sport discipline, limb dominance, or interaction were observed for ROM (sport: F = 2.120, p = 0.147, ηp² = 0.009; limb dominance: F = 0.709, p = 0.401, ηp² = 0.003; interaction: F = 0.270, p = 0.604, ηp² = 0.001). Similarly, no significant main effects of sport discipline, limb dominance, or interaction were found for Vmax (sport: F = 0.530, p = 0.468, ηp² = 0.002; limb dominance: F = 1.317, p = 0.252, ηp² = 0.006; interaction: F = 0.074, p = 0.787, ηp² = 0.000).
For APV° a significant main effect of sport discipline was observed (F = 6.385, p = 0.012, ηp² = 0.028), with T&F athletes reaching peak angular velocity at higher joint angles than SOC players (DOM: 61.9° ± 8.5 vs 59.7° ± 6.5; NDOM: 62.4° ± 9.8 vs 59.3° ± 7.1). A similar significant main effect of sport discipline was found for APV% (F = 7.122, p = 0.008, ηp² = 0.031), with higher values in T&F athletes compared with SOC players (DOM: 58.0% ± 3.2 vs 56.7% ± 3.7; NDOM: 58.6% ± 3.7 vs 57.4% ± 3.4). These differences (<3%) were interpreted as small and fall under non meaningful differences considering minimal detectable change (MDC) calculated in a previous preliminary study, giving respectively 6.9° and 4.1% MDC for APV° and APV% (nonpublished data, study currently in revision).
DISCUSSION
The aim of this study was to establish normative kinematic data of the H-Test in a cohort of HSI’s at-risk healthy athletes participating in T&F and SOC. Indeed, only few data from small sample sizes and heterogeneous populations studying the H-test are available in the literature. Examples include a study of 11 healthy and 11 injured participants from different sports,31 a study of 12 healthy male active soccer and rugby players33 and a study of 30 healthy participants from different sports.32 Moreover, all these studies used different measurement methods and slightly different kinematic outcomes, leading to some discrepancies in reported values.33 To the best of current knowledge, this is the first study to assess a large number (n = 113) of competitive T&F athletes (n = 46) and SOC players (n = 67) with no recent history of HSI (< 6 months), using a consistent measurement method (internal reliability data, nonpublished data, study currently in revision). These two groups were selected due to their high exposure to HSI, especially repeated sprints or high velocity running.5,8
Pooled normative values were 105.1° ± 10.8, 342.8°.s-1 ± 49.5, 60.6° ± 7.9 and 57.6% ± 3.6 for ROM, Vmax, APV° and APV% respectively. Differentiated values across sex, limb dominance and discipline are also presented. These values are consistent with previous data. Reported ROM values range from 97.2° ± 5.8 to 116.6° ± 8.8,31–33 Vmax values from 337.6°.s-1 ± 37.2 to 370.3°.s-1 ± 45.0,32,33 and APV° values of 48.8° ± 6.1.33 The mean difference between values discerned in the current study and previous ones could be attributable to measurement method (e.g. electrogoniometer,31 optoelectronic device33 or low frequency video capture32) as well as variations in population sample size, as previous studies were conducted on smaller sample. In this study, CVs were consistently reported under 5% and similar to previous study suggesting low intra-individual variability.33
Data showed high consistency among sport discipline and limb dominance. General reference values for males (n=94/116 participants) were 104.5 ± 10.2° 95%CI [103.0;105.9] in ROM, 350.0 ± 47.4°.s-1 95%CI [343.3;356.8] for Vmax and 60.3° ± 6.9 95%CI [59.3;61.2] for APV°. Nevertheless, as few female athletes were included, H-test values for this population must be interpreted with caution and generalizability is limited. Results from a previous study32 indicating that females perform the H-Test with larger ROM and at lower speed than males, are consistent with the present findings and align with previous report on sex related differences in flexibility and force velocity profile.43,44 However, future studies with larger sample sizes would be necessary to draw firm conclusions regarding sex-based differences.
A secondary objective was to assess the effect of limb dominance and sport discipline on H-test performance outcomes. Contrary to the study hypothesis that SOC players would exhibit larger ROM in their DOM (i.e. kicking leg), no significant effect of sport, limb dominance, nor between factors interaction was found. Indeed, mean differences in ROM between DOM and NDOM were low regardless of discipline. These results are consistent with results reported in previous study among various healthy athletes31,32 and more specifically in soccer players that exhibited symmetrical active knee extension.18 In addition, no between groups (T&F vs SOC) differences were observed in this study, suggesting no significant differences in the abilities of the hamstrings to lengthen at high velocity across disciplines.
To the best of current knowledge, direct sport-specific comparison of dynamic hamstring flexibility remains scarce in the literature. While sport-specific engagement seems to influence passive stiffness of muscular tissue,29 with lower hamstring stiffness among SOC player compared to control and T&F athlete, these adaptations do not necessarily translate into measurable functional differences in functional ROM at high velocity. A possible explanation of the lack of significant differences in H-test outcomes between groups lies in the exposure amount of both population to high velocity running. Although type of sprinting sequences differs between SOC and T&F, in terms of intensity, repetition and duration45,46 in training and competition, both impose repeated high speed lengthening of the hamstring, promoting convergent adaptation. Also, study population could partly explain the absence of between group differences, as participants were specialized but not professional top-level athletes. Finally, the constrained nature of the H-test and the supine position may limit its sensitivity to detect sport-specific differences. Indeed, sporting tasks such as sprinting and kicking are performed upright and involve multi-joint kinematic, especially pelvis-thigh interactions, which are known as a strategy to mitigate hamstring strain.30
The H-test is a movement performed with full ROM at high angular speed. Therefore, performance criteria such as hip angular velocity (Vmax), and APV are of primary interest as they reflect an important part of the mechanical demands imposed on the hamstrings muscle. Similar to ROM data, results show no sport, dominance, or interaction effect for Vmax. These findings do not support the study hypothesis which expected a dominance effect in SOC player, suggesting that high-velocity hip flexion capacity in the H-test may be similar between limbs in this population. Thigh angular motions (e.g. peak angular velocity and acceleration) are important parameters when examining running performance, showing high correlation with top speed sprinting performance.47 However, the angular velocities assessed during the H-test may not directly reflect those observed during sprinting. The reduced specificity of the H-test may partly explain its limited ability to detect subtle differences between limbs and groups. Also, recent data in SOC revealed that sprinting sequences in SOC matches has grown up to 50% in past years,48 with players covering more distance at high velocity during matches and more training sessions that include repeated sprint.49 This evolution in SOC practice could therefore narrow the gap between T&F and SOC players in terms of sprint performance and exposure amount to cyclic and symmetrical constraints. However, field SOC data indicates that top speed is rarely reached in matches and training configuration, while acceleration abilities are more frequently required.50 As no sprint kinematic data were collected during this experiment, such interpretation must be considered carefully. Additionally, the sensibility of the velocity criteria could be impacted due to the relatively low sampling frequency (60Hz). Better precision could rise by increasing sample rate up to 120 or 240hz if available. Results show a slight difference in angle at peak velocity (APV°) with T&F athletes reaching peak velocity at higher joint angle and at a later point in the ROM compared with SOC players. APV is purported to reflect the ability of the participant to decelerate and dissipate energy throughout the full ROM and represents the transition between the acceleration and deceleration phases of the movement. Although statistically significant, the difference was small, with a trivial effect size (ηp² = 0.03), and remained below the established MDC, making a true between-discipline difference unlikely. Both errors of measurement, test reliability and athletes’ level of play could impact the precision and significance of these findings.
Overall, these results suggest that normative values presented in this study can apply to both DOM and NDOM limbs and the two included sport disciplines. Results show high consistency across athletes with moderate standard deviation. As H-test outcome seems influenced by participants’ feeling of insecurity31 and psychological ability to tolerate strain, higher inter-individual variability could be expected from an injured population. It is important to not generalize the current findings to injured populations.
A secondary question concerns the use of LSI and how much quantification of asymmetries in such tests can constitute a goal to reach for injured patients to increase decision threshold at RTS.27 Data from the present study among uninjured athletes revealed no side-to-side differences and LSI values of all criterions that reached 100% with standard deviation under 10%. Thus, an LSI greater than 10% may be considered as exceeding normative limits and may alert clinicians to a potentially substantial asymmetry. In the H-test preliminary study, authors identified an 8% difference threshold in ROM in injured limb for active patients.31 The results of this study tend to support the assumption of symmetry between limbs in H-test outcomes but standard deviation as well as reliability must be considered. Therefore, a conservative 10% value of asymmetry should be considered as out of normative value range. However, caution is needed when interpreting larger asymmetries in relation to injury risk or indicators of full recovery in injured athletes returning to sport.
Indeed, the direct association between active flexibility and hamstrings injuries is still controversial.51 While the H-test effectively isolates hip flexion and knee extension under pelvic constraint (through instruction regarding keeping contralateral leg on the table and avoiding pelvic motion), recent methodological advances such as the Jurdan Sprint Table Test30 make the case for assessments capturing the simultaneous kinematics of the ipsilateral thigh, contralateral limb, and pelvic motion. Consequently, although the H-test provides robust normative data for constrained flexibility, its interpretation should be nuanced as it may not fully reflect the complex, multi-segmental coordination occurring during the sprint late swing phase, where pelvic motion and dynamic extension of the knee joint play a critical role. Nevertheless, by measuring high velocity hip flexion range of motion, the H-test offers a closer sprint related analysis than conventional flexibility tests, while remaining a clinically valuable tool due to its rapidity and ease of implementation.
Several limitations in this study should be acknowledged. First the low number of female participants prevented robust statistical analyses of sex differences. As a consequence, male and female athletes were pooled assuming that sport participation and limb dominance effect were comparable between sexes. Consequently, potential sex-specific differences may not have been fully captured. Second, the ecological validity of the H-test may be limited, because although it is closer to a dynamic injury situation than other flexibility passive tests, it is still highly constrained. The H-test provides information on hip flexion capacity at high angular velocity but in a supine position and straight-leg controlled condition, which differs from the upright and multi-joint nature of the sport-specific movement. As a result, the H-test may not fully reproduce the complex intersegmental coordination occurring during the late swing phase, where pelvic motion and dynamic knee extension play a critical role.
Despite these limitations, the H-test may still provide relevant practical applications for both performance monitoring and return-to-sport decision-making process. The results of this study suggest two considerations for the use of the H-test as a measurement. H-test outcomes could be assessed during pre-season functional testing giving reference values for each athlete. Also, H-test outcomes could be considered at RTS and interpreted based on pre-injury data, if available, or compared to uninjured leg. Nevertheless, future data collection and study should work toward assessing the ability of H-test outcome to identify at-risk athletes for HSI or refine cut-off values helping mitigate re-injury occurrence. Recent evidence also supports the important role of pelvic-thigh interaction and its relationship with key injury-related parameter observed in sprint running,30 that should be investigate further in the context of H-test. Lastly, future studies should compare kinematic outcome (ROM, Vmax, APV) and muscular parameters (length, lengthening velocity, peak muscular activation) between sprinting and the H-test to discern ecological validity.
CONCLUSION
The results of this study, conducted on a large cohort of healthy soccer players and track and field athletes, revealed that the objectives data collected from the H-Test are highly consistent. No differences in measured parameters were found between the two sports disciplines, nor between the dominant and non-dominant legs. Clinicians can be confident in using these normative values as reference benchmarks when interpreting H-test outcomes in healthy athletes or during pre-season screening, and potentially as a comparative framework in injured population. Further studies are needed in other sports, in female athletes, and in professional athletic populations to establish broader normative values. Finally, prospective cohort studies are required to determine whether deficits identified with this test are associated with an increased risk of hamstring injury.
Funding Statement
The authors have nothing to declare.
Conflict of interest disclosure
The authors declare no conflict of interest.
Patient Consent Statement
Participants were informed about the study and were given the opportunity to object to the use of their data. In accordance with national regulations and the approval of the Ethics Committee, an opt-out written consent was used. Participants received information about the study along with a non-opposition form, and those who did not return the form were deemed to have consented to participation.
Data Availability Statement
The data that support the findings of this study are available upon reasonable request from the corresponding author (S.L). The data are not publicly available due to restrictions (e.g., their containing information that could compromise the privacy of research participants).