

Introduction
Isometric strength testing is an important tool for detecting deficits in injured populations and monitoring strength changes during rehabilitation and training. Historically, manual muscle testing has been used to assess muscle function. These measurements are convenient and often require no additional equipment, but measurements remain subjective and can vary widely between practitioners.1 For objective, quantitative strength testing, precision devices exist, such as the Humac Norm (CSMI Medical Solutions, Stoughton, MA, USA). These devices are typically comprised of a precision torque-sensing arm, a motor to enable dynamic or static measurements, and chair or bed with straps to restrain the test participant. However, due to their large size and prohibitive cost, such devices may not be found in clinical and athletic settings. Thus, it can be challenging for clinicians and trainers to obtain quantitative strength measurements for comparison with rehabilitation and performance guidelines.2
As the cost of measurement devices has decreased over time, there has been a proliferation of portable, low-cost dynamometer devices for measuring isometric muscle strength in clinical and athletic settings. There are two main types of portable dynamometers: hand-held and inline. Hand-held dynamometers are force sensors that are attached to, or held in, the tester’s hand.1 This removes some of the subjectivity of manual muscle testing; however, reliability remains limited by the strength of the tester.1 Inline dynamometers, also called “pull-type”3 or “portable-fixed”,4 utilize a force sensor attached in series between an individual’s limb (e.g. ankle, for testing knee strength) and a rigid mounting point. By removing the requirement for the tester to provide sufficient resistance, inline dynamometers can provide greater reliability and validity versus hand-held dynamometers, while still maintaining desirable characteristics such as portability and ease of use.4
Recently, Center et al.5 reported on the clinical validity of a commercially-available inline force sensor (Progressor 150, Tindeq, Trondheim, Norway) for measuring isometric knee extensor strength in individuals with unilateral knee disorders. Depending on the leg of interest, mean measurement error (bias) for the Tindeq device versus the Humac dynamometer ranged from 0.18 to 0.32 Nm/kg, and Bland-Altman limits of agreement (LOA) ranged from –0.46 to +1.10 Nm/kg, or roughly 25% error assuming a 3Nm/kg effort. The Tindeq device was highly accurate (96% sensitivity and 100% specificity) when identifying individuals who exceeded a limb symmetry index, LSI, of 70% (i.e. “return to run”6), but had reduced performance (78% sensitivity, 92% specificity) when detecting smaller asymmetries (LSI > 90%, “return-to-sport”7). The authors concluded that this performance supported validity of the Tindeq as a clinical strength measurement tool. However, relatively large LOA suggest potential for large differences between portable and lab-based devices when assessing individual participants and limbs; this is particularly important in a clinical context.
One potential source of error is inherent limitations in accuracy and reliability for the low-cost Tindeq device. While controlled bench-top tensile testing has demonstrated accuracy +/- 1% error and excellent repeatability (ICC3,1 >0.99) for the Tindeq,8 its relatively low sampling rate (80 Hz) could inhibit measurement of peak forces during human testing. Another source of error is that portable and lab-based trials often use a different apparatus (i.e. chair, straps, etc.) for each system, for example including torso restraint only for lab-based but not inline trials in the work of Center et al.5 Finally, although validation studies typically use verbal encouragement to improve reliability of maximum voluntary isometric contractions (MVICs),5,9 it is difficult to ensure that participant effort is consistent between trials. Although the relationship between muscle excitation and force is nonlinear and varies with many factors such as joint position, fatigue, and electrode placement,10 using techniques such as electromyography (EMG), or electrical stimulation to estimate voluntary activation (VA)11–13 can help verify that participant effort is consistent between trials.
Therefore, the objective of this study was to investigate agreement in maximum voluntary isometric knee extension torque measurements between a lab-based dynamometer, a low-cost wireless inline force sensor, and a wired inline force sensor. It was hypothesized that the Tindeq inline device, in comparison to the reference lab-based dynamometer, would exhibit small average error (measurement bias) across participants, but that LOA would exceed ±20% and therefore decrease confidence in individual measurements. Additionally, it was hypothesized that the low-cost wireless Tindeq force sensor would yield similar results to the wired inline dynamometer.
Methods
Sample size estimation
Similar studies have used 1414 to 2015 participants. In this study, a minimum sample size of N=13 was estimated (G*Power 3.1.9.7),14 based on paired two-tailed t-tests with a large effect size (1.05), 80% power, and Bonferroni-adjusted significance threshold (α) of 0.05/3 = 0.0167 for multiple comparisons between three dynamometer systems (see Equipment, below). Estimating the between-systems standard deviation as 0.19 Nm/kg,3 this sample size would be sufficient to detect a mean difference between dynamometer systems of at least 0.2 Nm/kg, which has been reported as the difference in knee extensor strength between intact and ACL-reconstructed limbs.15
Recruitment and Inclusion/Exclusion
Fifteen healthy participants were recruited via email, posters, and word of mouth. The study was reviewed by the institutional ethics review board, and each participant provided written, informed consent. Participants were eligible for inclusion if they were greater than 18 years old and did not have any recent or past injuries or invasive procedures that would prevent safe performance of warm-up exercises (lunges, jogging in place) and maximum effort knee isometric extension tests. Exclusion criteria included inability to perform the warm-up or knee extension exercises, and presence of metallic or electronic implanted devices. Additionally, participants were excluded if they were unable to achieve a minimum voluntary activation exceeding 90% based on the electrically evoked interpolated twitch contraction method or if they exhibited any of the following symptoms during warm-up or testing: lightheadedness, shortness of breath, chest pain, numbness, fatigue, coughing and/or wheezing.
Equipment: Lab-based and Portable Inline Dynamometers
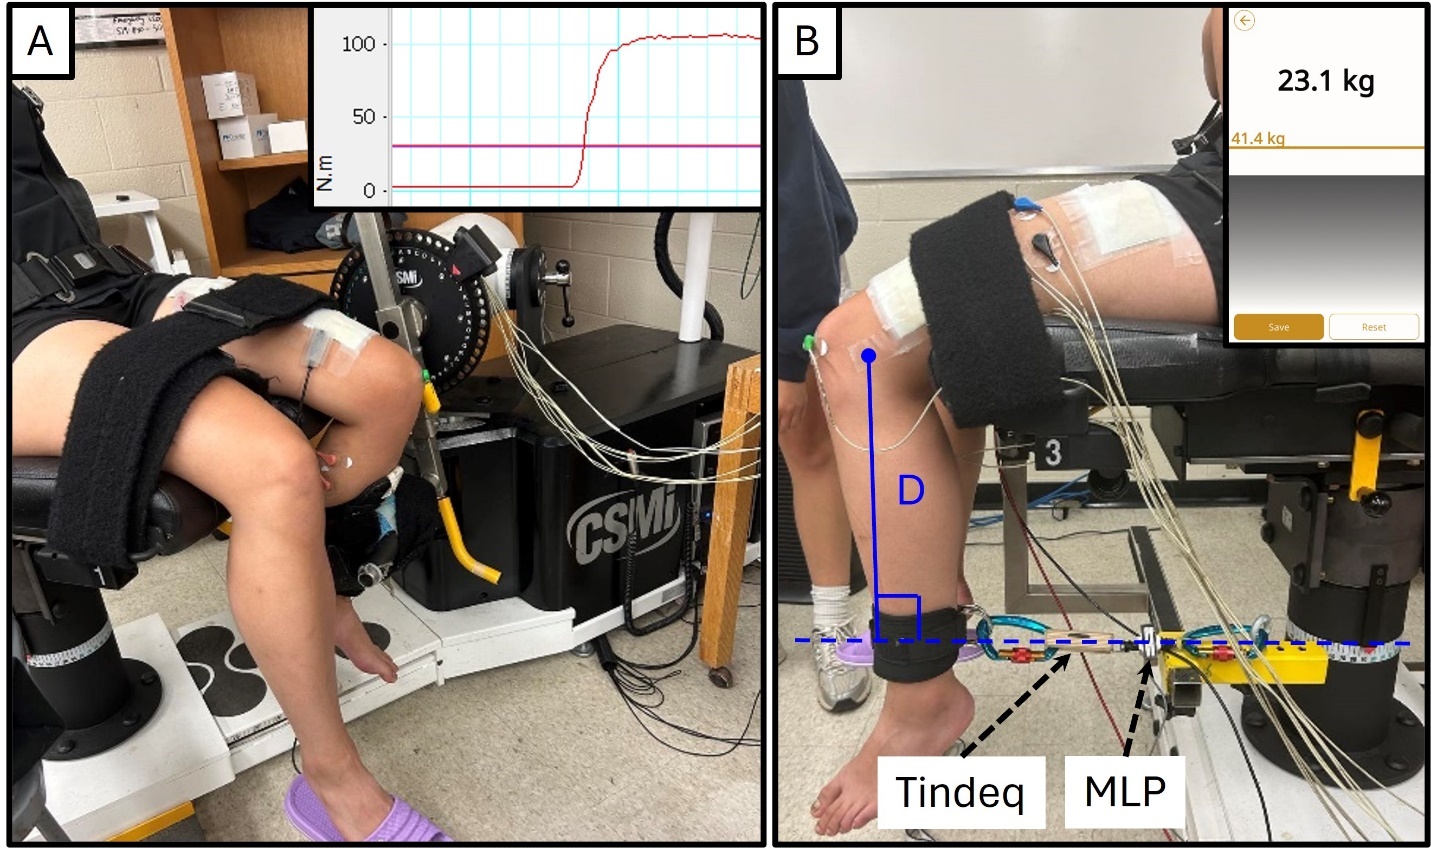
Peak knee extension MVIC torque was measured using three dynamometer setups. First, an isokinetic dynamometer (Humac Norm, CSMI Medical Solutions, Stoughton, MA, USA, Figure 1A), which was considered to be the reference standard,5 was used to measure knee extension torque (Nm) at knee angles of 15, 45, and 90 degrees. The participant was seated on the Humac chair with a hip flexion angle of approximately 100 degrees, and strapped at the waist, shoulder, and thigh. The lateral epicondyle of the participant’s left knee was aligned with the dynamometer’s axis of rotation during a submaximal contraction to account for soft tissue and seat foam compliance, while the shin pad cuff was strapped just proximal to the participant’s ankle joint to hold the participant’s knee at the desired testing angle. Knee angles were measured using a manual goniometer. Second, a portable inline dynamometer setup, which is viable in a clinical setting due to lower cost and portability, was constructed using a low-cost portable wireless force sensor (150 kg capacity, Progressor 150, Tindeq, Trondheim, Norway), in series between the participant’s lower leg and a rigid bracket on the chair, attached using a VelcroTM cuff, chain, and carabiners (Figure 1B). The cuff was positioned proximal to the participant’s left ankle joint. Importantly, for 45- and 15-degree tests the participants had to produce a small amount of extension torque to remove slack from the chain prior to recording each knee extension trial. Knee extension torque (Nm) was computed as the product of measured force (N) multiplied by the perpendicular distance (m) from the lateral epicondyle of the knee joint to the line of action of the inline force sensor; this distance (“D” in Figure 1) was measured using a tape measure. Finally, a wired force sensor (226 kg capacity, MLP-500, Transducer Techniques, CA, USA, Figure 1B) was attached in series with the Tindeq force sensor to investigate the effect of force sensor selection on measured torque. To control for postural variability, the participant remained seated and strapped while the chair was swiveled to engage between Humac and Inline dynamometer setups.

Electromyography and Electrical Stimulation
Each participant’s ability to generate a maximal contraction (i.e., >90% voluntary activation, VA) was verified for each apparatus (Figure 1AB) using an electrically-evoked interpolated twitch technique (electrical stimulation ), as previously described.12 Briefly, two custom-made rectangular aluminum electrode pads (approximately 8cm by 10cm) were wrapped in damp paper towels, covered in conductive gel, and placed on the anterior surface of the thigh (Figure 1). The cathode was placed approximately 6cm proximal to the patella, while the anode was approximately 7cm distal to the groin. During each voluntary contraction, electrical stimulation was delivered via a 200 μs square-wave pulse at 400V using a constant current stimulator (DS7AH, Digitimer Ltd, Welwyn Garden City, UK). Stimulation current was tuned to each participant as described below.
Electromyography (EMG) electrodes (735, Kendall, Mansfield, MA) were adhered on the participants’ leg, superficial to the bellies of agonist (vastus lateralis and rectus femoris) and antagonist (biceps femoris and medial gastrocnemius) muscles per SENIAM guidelines.16 A reference electrode was adhered on the patella to minimize electrical interference (Figure 1B).
Procedure
Prior to testing, participants completed a brief warm-up consisting of one minute of running in place and one minute of body weight squats. Then, all electrodes were placed and subjects were strapped into the Humac dynamometer with their left knee flexed 90 degrees (Figure 1A). Participants performed maximum isometric knee flexion contractions for 2 seconds, with verbal encouragement, to calibrate biceps femoris EMG, then began participant-specific tuning of the electrical stmiulation as follows.12 Briefly, a series of individual twitch pulses was delivered while the participant was at rest with their knee flexed 90°; current was increased in increments of 20mA until Resting Twitch torque plateaued, and pulses were separated by approximately 30 seconds of rest. Next, a Superimposed Twitch was obtained by manually delivering an electrical stimulation pulse during a MVIC, followed by a Resting Twitch pulse delivered approximately two seconds after the MVIC (Figure 2). Participants were accepted to continue in the study if they achieved a minimum Voluntary Activation (VA) (Equation 1) exceeding 90%.
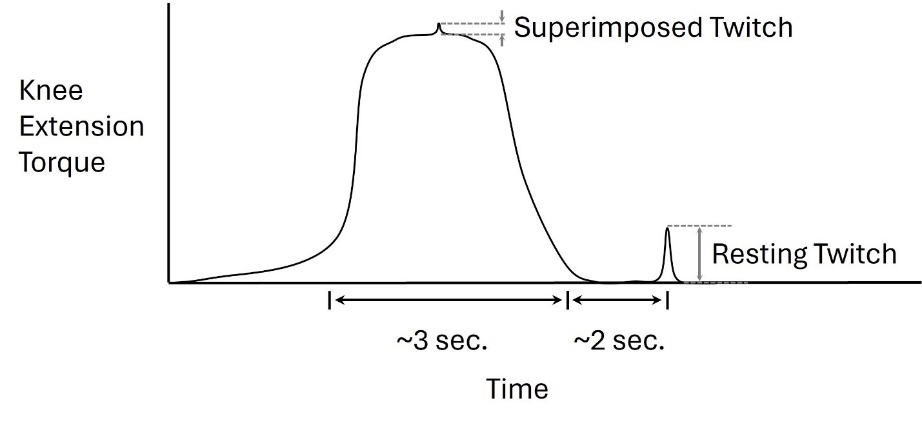
VA (%)= [Resting Twitch−Superimposed TwitchResting Twitch]∗100
Each participant completed a total of twelve knee extension MVIC trials. For both setups (Figure 1), two repetitions were performed at each of three knee flexion angles in the following order: 90°, 45°, 15°. Each 2-3 second MVIC repetition was separated by three minutes of rest, and both verbal encouragement and visual feedback (Figure 1, inset) were provided. To facilitate electrical stimulation tuning (described above), the first set of six trials (two trials each at 90°, then 45°, then 15°) was always performed using the Humac (Figure 1A) with the knee at 90°. For both Humac and inline setups, only the first trial at 90° included a superimposed twitch to verify voluntary activation.
Signal Acquisition and Processing
Humac knee extension torque (1000Hz), EMG (2000Hz), and MLP wired inline force sensor voltage (1000Hz) were sampled synchronously using a 12-bit analog-to-digital converter (PowerLab System 16/35, ADInstruments, Bella Vista, Australia). MLP voltage was converted to force via a linear calibration equation, obtained using a dead-hang procedure based on ASTM E74-18e1.17 Tindeq force was sampled via Bluetooth at 80Hz using a proprietary application (Tindeq Progressor) on a tablet (Android 11, Lenovo Smart Tab M8, Morrisville, NC, USA). Inline force measurements (Tindeq, MLP) were multiplied by the participant-specific lever arm (Figure 1B) to compute joint torques.
Data were post-processed in MATLAB (2022a, The Mathworks, Natick, MA, USA). Torque data were lowpass filtered (6Hz, 2nd order Butterworth, zero-lag) and normalized to participant mass. Peak torque was extracted for each dynamometer (Humac; MLP; Tindeq), for each trial. EMG data were bandpass filtered (20-450 Hz), rectified, enveloped (6Hz, 2nd order Butterworth, zero-lag),18 and normalized to the maximum isometric contraction value. Peak EMG, the maximum EMG magnitude during the trial, was extracted for each muscle, for each trial. For 45- and 15-degree conditions, data were averaged across both repetitions. At 90 degrees, only one repetition was retained; electrical stimulation trials were omitted to avoid confounding results from the superimposed twitch.
Statistics
Peak knee extension torque was compared between the three dynamometry systems (Humac, Tindeq, and MLP), using a repeated measures ANOVA for each angle (90, 45, 15 degrees) with Greenhouse-Geisser correction for sphericity and a significance threshold (α) of 0.05. Effect sizes were quantified using partial η2 and interpreted as small (<0.01), medium (<0.06), and large (>0.14) effects per Cohen’s 1988 suggestions.19,20 When ANOVA main effects were significant, Holm-Bonferroni post-hoc tests were performed. Additionally, agreement between dynamometry systems was assessed using Pearson’s Correlation, Interclass Correlation Coefficients (ICC3,1, absolute agreement), Minimum Detectable Change (MDC95),21 and Bland-Altman Limits of Agreement.22 Finally, peak EMG data were compared at each knee angle using paired t-tests. All statistical analyses were performed in JASP (version 0.95).23
Results
Participants
Of the fifteen recruited participants, one was excluded due to lightheadedness during the protocol. Thus, 14 participants (3 male, 11 female; 26 ± 8.97 years; 1.71 ± 0.11 m; 66.75 ± 15.9 kg) completed the study.
Peak Torque: Comparison and Limits of Agreement
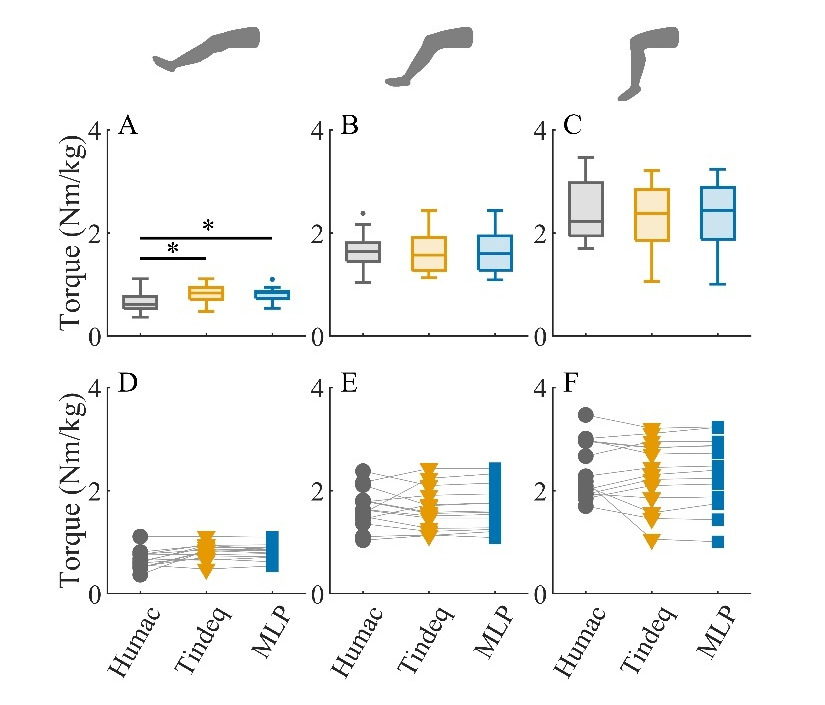
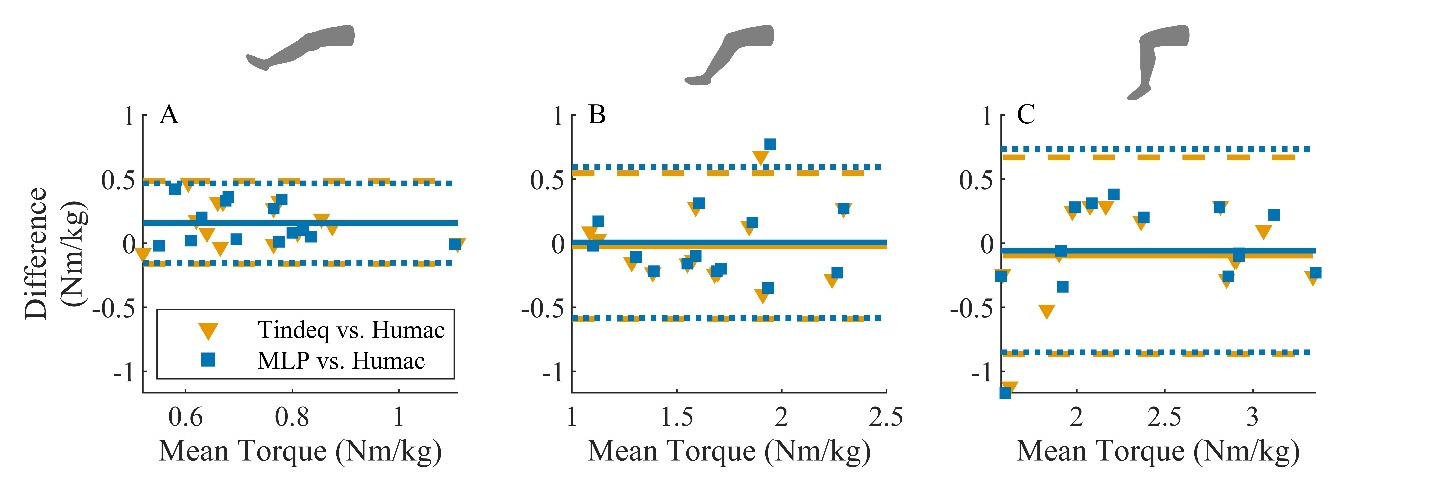
There was no difference between measurement systems at knee flexion angles of 45 degrees (F(1.02,13.25) = 0.117, p = 0.74, ηp2 = 0.009) and 90 degrees (F(1.03,13.40) = 0.64, p = 0.44, ηp2 = 0.047) (Figures 3B, 3C). This was further supported by the Bland-Altman analysis, where the mean difference between inline systems and the reference standard Humac was less than 0.1 Nm/kg (Figures 4B, 4C). For the Tindeq device, the mean (95% confidence interval, CI) difference was −0.02 Nm/kg (−0.19 to 0.14 Nm/kg) at 45 degrees and −0.10 Nm/kg (−0.32 to 0.13 Nm/kg) at 90 degrees. However, LOA were much larger than the mean difference (−0.60 to 0.55 Nm/kg at 45 degrees; −0.86 to 0.67 Nm/kg at 90 degrees). Similarly, for the MLP device, the mean (95% CI) difference was 0.00 Nm/kg (−0.17 to 0.18 Nm/kg) at 45 degrees and −0.06 Nm/kg (−0.29 to 0.17 Nm/kg) at 90 degrees of knee flexion. LOA were −0.56 to 0.60 Nm/kg at 45 degrees and −0.85 to 0.73 Nm/kg at 90 degrees.
_for_14_healthy.png)
At a knee flexion angle of 15 degrees, knee extension torque was greater for MLP and Tindeq inline systems than the Humac (F(1.15,15.00) = 12.83, p < 0.01, ηp2 = 0.497). Specifically, mean torque was 0.16 Nm greater for both Tindeq (t(13) = 3.66, p <0.01, d = 1.01) and MLP (t(13) = 3.69, p <0.01, d = 0.98) inline systems (Figure 3A). This was further supported by Bland-Altman plots, (Figure 4A) which revealed mean (95% CI) differences of 0.16 Nm/kg (−0.06 to 0.25 Nm/kg) for MLP and 0.16 Nm/kg (−0.07 to 0.26 Nm/kg) for Tindeq systems. LOA were −0.60 to 0.55 Nm/kg for MLP and −0.86 to 0.67 Nm/kg for Tindeq.

Peak Torque: Correlation between Systems
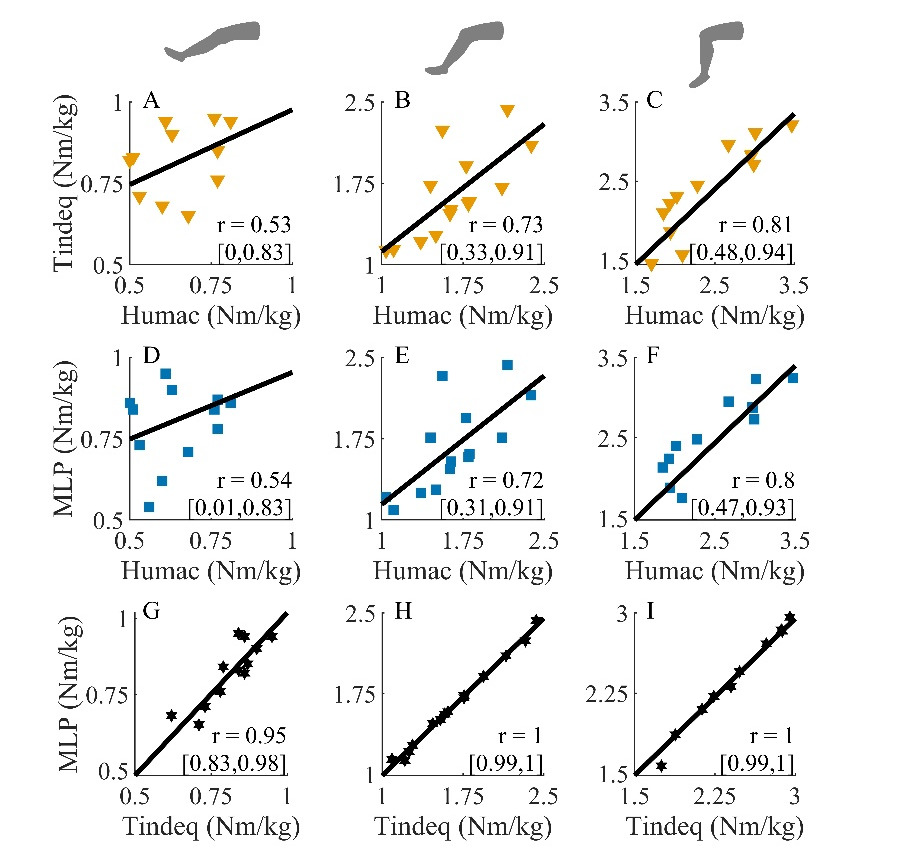
Pearson Correlation analysis revealed very strong correlations between inline MLP and Tindeq systems (r > 0.95, Figure 5 G, H, I), with moderate to strong correlations between each of these devices and the Humac (r = 0.54 to 0.81, Figure 5 A-F) at each of the three knee flexion angles.
Peak Torque: ICC and MDC95 between Systems
Intraclass correlation coefficients provided additional evidence of excellent agreement between Tindeq and MLP devices (ICC3,1 = 0.94-1.00, Table 1), and poor to good agreement between the Humac and either portable device (ICC3,1 = 0.37-0.80, Table 1). Agreement between the Humac and other devices was strongest at 90 degrees (ICC3,1 = 0.8), but decreased as the knee moved toward extension (ICC3,1 = 0.37 at 15 degrees). Based on the observed ICC and variance, the study was powered to detect a minimum change of approximately 0.3Nm between the Humac and other systems, or 0.01 Nm between the Tindeq and MLP systems (Table 1).
EMG
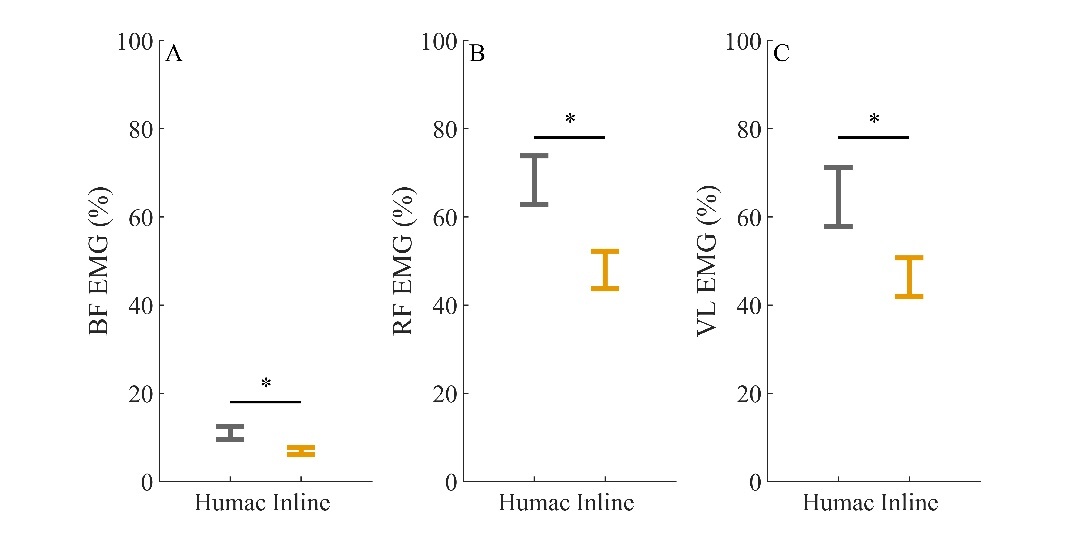
At 90 degrees of knee flexion, peak EMG was significantly greater for biceps femoris (BF, t(13) = 3.81, p< 0.01, d = 1.02), rectus femoris (RF, t(13) = 4.65, p< 0.01, d = 0.32), and Vastus Lateralis (VL, t(13) = 5.00, p < 0.01, d = 0.19) for the Humac versus Inline (Tindeq and MLP) apparatus (Figure 6). No difference was detected for medial gastrocnemius (MG, t(13) = 0.74, pt = 0.47, d = 0.21) at 90 degrees, and no differences were detected for any muscles at angles of 15 and 45 degrees (all p> 0.16, all d <0.25).
_electromyography_(emg)_during_isometric_knee_ext.jpeg)
Discussion
The primary objective of this study was to quantify agreement in measurements of peak isometric knee extension torque between a large, precision, laboratory-based isokinetic dynamometer (Humac) and a low-cost wireless inline force sensor (Tindeq). Consistent with the hypothesis, the mean difference (not statistically significant) between systems was less than 0.1 Nm/kg at knee flexion angles of 45 and 90 degrees (Figure 4); this indicates that if sufficient measurements are recorded (e.g. across numerous participants or visits), the average peak torque from the Tindeq readings will closely approximate the reference standard.
However, in clinical practice one is usually concerned with individual measurements, not population averages. Bland-Altman Limits of Agreement (LOA) provide an effective means to quantify and visualize the range within which 95% of individual measurements are likely to fall. In this study, LOA were approximately +/- 0.75 Nm/kg (Figure 4) at 90 degrees of knee flexion. These results agree closely with Center et al.,5 who similarly tested the Tindeq device versus a Humac dynamometer in 31 subjects and reported LOA of approximately ±0.78 Nm/kg for an uninjured limb. Compared with peak isometric knee strengths of approximately 2 to 3 Nm/kg (Figure 3), this implies that individual measurements using the low-cost inline device (Tindeq) could differ from lab-based dynamometer measurements by 25 to 37.5%; thus, individual measurements could fail to detect clinically-relevant changes or asymmetries less than 0.2Nm/kg, or roughly 10%.5,7 Based on this observation, when using an inline dynamometer, it is important to base clinical decisions not on a single test result, but on multiple, consistent test results in conjunction with a battery of related clinical and functional tests.25
Importantly, error between low-cost Tindeq and Humac measurement systems was not related to force sensor cost, or quality. This study included a redundant, wired, force sensor (MLP, 1000Hz sampling frequency) in series with the low-cost wireless sensor (Tindeq, 80 Hz sampling frequency) to distinguish error from the Inline apparatus (i.e. use of an ankle strap and chain) versus the choice of force sensor. Results were consistent between both inline force sensors, with very strong correlations (Figure 5), nearly identical LOA (Figure 4), small MDC95 (Table 1) and similar measurements (Figures 3D, 3E, 3F). This finding is unsurprising, given that the Tindeq device has previously been shown to provide excellent linearity, test-retest reliability (Interclass correlation, ICC(3,1) ≥ 0.999) and agreement (Lin’s concordance correlation, ρc ≥ 0.999) versus a lab-based tensile testing apparatus (Instron Dynacell 2527-202 load cell, ElectroPuls E10000, Instron, Norwood, MA, USA).8 Thus, the present study provides further evidence that low-cost wireless force sensors, such as the Tindeq device, have sufficient accuracy to measure peak isometric loads, with the caveat that each sensor should be validated for its intended purpose.
Having ruled out force sensor inaccuracy, a likely explanation for the relatively large LOA between Tindeq and Humac measurements is differences in the physical apparatus. When using a lab-based dynamometer, the participant is rigidly and isometrically strapped to the force sensor with the joint (e.g. knee) aligned with the torque and rotation axis. However, in the inline apparatus the participant is only restrained in the extension direction and thus must adjust their joint posture and maintain slight knee extension torque to remove slack in the Inline apparatus (e.g. chain) before the isometric condition applies. It is possible that this dynamic postural shift, as well as differences in straps, could have influenced inline results. A similar study, comparing inline Tindeq measurements of ankle plantarflexor strength versus an isokinetic dynamometer (Biodex™ System 4 Pro, Biodex Medical Systems, Shirley, NY, USA), found LOA of approximately 33 kg relative to forces ranging from 60 to 200 kg, or roughly 17-55% error for individual measurements.26 The authors attributed this error to differences in fixation of the participant between dynamometer systems. In the present study, the participant remained seated and strapped in the same chair for both Humac and inline tests, with the only difference between devices being the ankle restraint (Figure 1). As noted by others,26 this likely represents a best-case scenario; apparatus-related errors are likely to be either equivalent or larger, not smaller, when inline devices are used outside of these carefully-controlled laboratory conditions (e.g. at home, or in-clinic).
A second likely, and perhaps related, explanation for measurement error between inline and Humac measurements is that lab-based Humac dynamometer directly measures torque (Nm), while inline measurements do not. Inline force (N) must be converted to torque (Nm) via the lever arm that is manually measured as the perpendicular distance from the line of force application (e.g. ankle strap) to the joint axis of rotation (e.g. lateral epicondyle of the knee). Lever arm measurement error could occur, for example, due to inaccurate palpation of the epicondyle, slippage or inaccurate placement of the ankle strap, or measurement of the lever arm in a direction that is not perpendicular to the force. The act of removing slack from the inline restraint (e.g. chain) requires postural adjustment, which could cause slippage of the straps, compression of cushioning or soft tissue, and potential errors in the lever arm. While no such methodological errors were noted in the present study, given the observed LOA (Figure 4) it appears imperative to provide thorough user training and carefully control lever arm measurements when using inline methods to quantify isometric strength.
In this study, peak EMG throughout the contraction was used to quantify participant effort. At 90 degrees of knee flexion, significantly greater EMG was observed during Humac trials versus Inline in both knee extensors (RF, VL) and knee flexors (BF) (Figure 6). However, there was no evidence that this resulted in significantly greater torque (Figure 3), perhaps due to antagonist co-activation reducing net torque generation. Given the nonlinearity of the muscle force-EMG relationship,10 it is important not to over-interpret such EMG magnitude changes. Nevertheless, it is possible that these findings point to differences in participant effort, which may partly explain variability and wide LOA in peak torque measurements.
A strength of this study was the use of the interpolated twitch technique (electrical stmiulation) to calculate VA to confirm that each subject was generating a near-maximal and equivalent effort for both the Humac and inline device trials (Figure 2). While this technique has been used to investigate joint injury,11 muscle fatigue,12 and neuromuscular asymmetry,13 this technique has not been used to assist in ensuring equivalent participant effort when validating dynamometry. Due to differences in shank strap configuration, participant comfort, and potential familiarization throughout the experiment,27 it was conceivable that participants might exert more effort on one device than the other. However, in this study, all participants satisfied the requirement that their VA met or exceeded 90% (Equation 1), therefore it is unlikely that error between the two systems was substantially influenced by participant effort.
Pearson Correlation analysis revealed moderate to strong relationships between the inline and Humac devices. Correlations can be misleading because devices can be significantly correlated but still yield quite different measurements.28 Correlations were included in this study to facilitate comparison with previous studies8,29–32 and to visualize relationships between devices (Figure 5). Based on this analysis, it was readily apparent that measurements from the Tindeq and MLP inline devices agreed closely, particularly at 45- and 90-degree angles (Figures 5H, 5I), and that agreement was worse at 15 degrees (Figure 5 A, D). However, in future comparisons of measurement systems, it is preferable to use Bland-Altman analysis, which enables similar observations but has the advantage of separately quantifying bias and LOA.
Limitations
Although the sample size in the present study (N=14) was informed by a priori sample size calculations, participants in this study exhibited greater variability in peak knee extensor torque between devices (standard deviation ~ 0.32 Nm/kg) than in previous literature (approximately 0.19 Nm/kg).3 Thus, the present study was underpowered to detect small differences in peak torque between systems, with post-hoc paired-t-test analysis (effect size = 0.625, alpha = 0.05, sample size = 14) in G*Power14 indicating achieved power of only 58% to detect a clinically-relevant bias (0.2 Nm/kg, or the reported difference between operated and non-operated limbs15) between systems. A larger sample size may have revealed a small but significant measurement bias between systems, which would need to be considered if comparing Tindeq-derived isometric strength measurements versus guidelines for return to running post-ACL surgery that are derived from lab-based dynamometers, such as a recommendation of 1.60 Nm/kg at 4 months.2 However, the present results showed small bias (mean difference at 90 deg <0.1Nm/kg, Figure 4) relative to the LOA (95 % confidence interval approximately +/- 0.75 Nm/kg, Figure 4), so even if significant there is no indication that the magnitude of measurement bias is a primary concern.
Although ICC was used to quantify absolute agreement between systems, a second limitation of this study was the lack of reliability and repeatability analysis; each participant only visited the laboratory once, and all experiments were conducted in the same trial order by a single researcher. Other similar studies have performed inter-rater and between-day reliability studies to validate inline33 and hand-held34 dynamometers. Given that these studies generally report moderate to excellent reliability,33,34 and that the between-day reliability of the Tindeq device has previously been demonstrated for ankle strength measurement,26 it is expected that the present device would similarly demonstrate good reliability for measuring peak isometric knee extensor strength.
A third limitation, inherent in the inline method, was that slight muscle activation was required to remove slack from the chain during inline dynamometer tests at 45 and 15 degrees, which could have influenced peak torque output and may have contributed to observed torque differences between systems at 15 degrees (Figure 3). However, given that trials were maximal-effort, it is unlikely that any potential lower-level background activation during the inline dynamometer testing would have substantially altered the findings of this study. Furthermore, pre-loading of the load chain was not a factor at 90 degrees as the subject was seated and the leg was hanging vertically, at rest, for both Humac and Tindeq trials.
Finally, this study included methodological simplifications: only healthy participants were included, trial order was fixed (both between devices and between angles), and VA testing was only performed at 90 degrees. A previous study (N=-31 individuals) found wider LOA in the uninvolved (-0.46 to 1.1 Nm/kg) versus involved (-0.22 to 0.57 Nm/kg) limbs.5 Thus, it is possible that by including only healthy participants, the present study found larger LOA than would be expected in an injured population, although this effect may be partly due to larger torque measured in the healthy population. In this study, trial order was fixed with Humac trials first, and always followed the same sequence (90 degrees, 45 degrees, and 15 degrees). Thus, the possibility remains that bias between Tindeq and Humac trials was influenced by either fatigue or training effects. However, sufficient rest was provided (~3 minutes) to minimize fatigue, and mean torque was not different between systems at 90 degrees or 45 degrees (Figure 3), so the trial order effect is unlikely to have confounded our results. Future work should utilize a randomized order, perhaps with reduced trial conditions (e.g. fewer test angles) to reduce fatigue and experiment duration. Finally, for simplicity and participant comfort, VA was measured only at 90 degrees for each system (Humac and Tindeq). Because VA was not measured at each joint angle, it is possible that participant effort differed between trials and contributed to significant differences observed at 15 degrees (Figure 3). Thus, conclusions about agreement at 45 and 15 degrees of flexion should be interpreted with greater caution than the results obtained at 90 degrees.
Conclusions
The results of this study show that, on average, peak knee strength measurements from the low-cost wireless force sensor (e.g. Tindeq) were similar to measurements from a lab-based Humac dynamometer, with bias less than 0.1 Nm/kg. Additionally, outcomes from voluntary activation and EMG provided evidence that participant effort was equivalent between trials. However, Bland-Altman LOA revealed that peak knee extensor strength for a single participant may differ from measurements using a lab-based dynamometer by approximately ±0.75 Nm/kg, or approximately 25% of a typical individual’s peak torque. Thus, although results in this study were limited by small sample size, it appears important to avoid over-interpreting differences that are less than this threshold of agreement (~25%) when comparing strength between participants, with literature, and over time. Low-cost devices such the Tindeq show promise for clinical use, but individual measurements should be interpreted with caution.