
INTRODUCTION
Running is one of the most widely practiced and accessible exercise activities worldwide,1 offering many benefits such as improving overall fitness and cardiovascular health.2 However, running-related injuries (RRIs), which often result from repetitive loading forces and/or aberrant biomechanics, are very common among recreational and competitive runners.3 The estimated prevalence of these injuries ranges from 10% to 90%, with an average annual injury rate of 42.7%.4 RRIs are often multifactorial, with underlying biomechanical, sex-related, genetic, and training-related factors.3,5 Biomechanical kinetic parameters that may predispose runners to specific types of injury include vertical ground reaction force (GRF) and vertical average loading rates (VALR).6,7 GRF represents the force application pattern during stance phase which may contribute to performance and injury risk. Higher VALRs have been associated with certain RRIs such as patellofemoral pain syndrome and plantar fasciitis,8 indicating that elevated loading rates may increase injury likelihood. In contrast, lower VALRs have been correlated with runners without prior injury,9 suggesting that lower values could be protective.
Efficient, effective screening for these kinetic factors in runners is important for rapidly identifying individuals at higher risk for injury and for initiating injury prevention strategies in busy clinical settings. Potential screening methods include functional movement tests and motion capture with instrumented treadmills. Multicomponent movement assessments10 offer a practical and inexpensive way to evaluate multiple kinematic aspects of mobility, balance, and neuromuscular control. Plyometric tests, such as the vertical jump or drop jump tests, focus on performance values like jump height, and frequently inform clinical and athletic performance decisions.11 However, these movement-based tests are unable to measure kinetic values such as GRF and VALR and thus lack the ability to provide a more wholistic view of biomechanical risk. Motion analysis, (2-D video, 3-D optical camera based) is a common and accessible method that is regularly used to evaluate running mechanics, although 2D can be subjective12 and it does not directly measure kinetic data. Tools like force plates or instrumented treadmills are the primary methods for collecting kinetic data in the research and elite sport settings.13 However, these methods are costly, have limited measurement scope, require sufficient laboratory space, and need skilled technicians to maintain calibration, keeping them out of reach for many clinicians. Other technologies, such as wearable sensors, are convenient, though limited by their accuracy and scarcity of validation studies.14 There remains a need for cost-effective and accessible alternatives to detect kinetic chain deficits and screen for injury risk factors in runners, and to ensure any sex differences can be detected.
Markerless motion capture systems are newer and less expensive than 3D marker-based motion analysis systems with instrumented treadmills. These systems have been successfully used to study kinematic variables15 but have not been widely used to study kinetic metrics in runners. Markerless motion capture estimates forces on the body and has demonstrated comparable results to marker-based systems.16 It is currently unknown whether kinetic measures such as GRF, obtained from markerless motion derived functional tests (such as DARI® Motion, Inc.) correlate with GRFs and VALR obtained with the gold standard 3D motion capture and instrumented treadmill in runners. If strong associations exist, these simple markerless motion tests could significantly improve screening capacity in both male and female runners by efficiently capturing both joint motion and forces. Moreover, the time and operational savings could be substantial. Typical 3D and instrumented treadmill testing takes anywhere from 45-90 minutes and requires more than one staff member, depending on protocols, preparation and marker sets, whereas markerless motion functional tests can be completed in a few minutes with one staff member. Moreover, the automated output provides both kinetic and kinematic insight to clinicians.
The purposes of this study were to 1) characterize functional test performance in endurance runners using markerless motion capture, and 2) determine the strength of associations between markerless motion capture-based functional movement performance and instrumented treadmill-based kinetic features of running. Sex differences in functional performance tests and in gait characteristics were secondary exploratory analyses. Given that these functional tests involve impact with loading, it was hypothesized that the correlations values would be strong.
METHODS
Study Design. This was a cross-sectional study of running gait and physical function performance of endurance runners. This study and its procedures followed the guidelines for the Declaration of Helsinki’s Protection of Human Subjects. The study, materials, and procedures were approved by the University of Florida Institutional Review Board (study #202500700). The manuscript follows the format for observational studies as described by the statement in Strengthening the Reporting of Observational Studies in Epidemiology.17
Setting. The Exercise Medicine and Functional Fitness Laboratory was located in a quaternary health care facility. After physician referral or self-referral into the Laboratory, the team provides numerous performance assessments, nutrition and body composition testing, consultations, exercise programming, and motion analysis services to athletic individuals of all ages, sports, and experience levels (amateur to professional). Among these services is a 3D comprehensive running gait analysis for running athletes. This laboratory has partnered with medical providers to provide running gait testing for their referred patients for over 16 years.
Participants. Participants were obtained from the departmental research databank (Study #202101632). Participants who obtained services during the time frame of January 1, 2023, to April 10, 2025, and who met the following criteria were identified. Inclusion criteria were: 1) aged 18-70 years, 2) had performed both a comprehensive running gait analysis and a physical function screen using the markerless motion system as part of an assessment service in the Laboratory. Exclusion criteria were: 1) aged <18 years or older than 70 years, 2) no major traumatic musculoskeletal injury (i.e., anterior cruciate ligament rupture), and 2) other pre-existing neurological or orthopedic conditions that interfered with normal gait (i.e., scoliosis, sciatic pain, ataxias, cerebral palsy) or previous history or orthopedic trauma with resultant persistent motion aberrations.
Participant Characteristics. A background intake form was used to collect key information to characterize each runner. This form was derived from recommendations we have previously published for the clinical assessment of the runner.18 Information collected included a medical and injury history, and training details (e.g., running or training volume, running type in addition to endurance training [sprinting, interval training], cross-training activities, strengthening activity). Current training status for competition was obtained. Each runner used their regular, preferred training shoes for the testing to minimize any acute effects of changing footwear on biomechanical responses to the treadmill testing or dynamic physical function tests.
Kinetic Parameters of Running. Runners were provided standardized instructions to run at a self-selected velocity, described as ‘a typical pace used for a long run’. Previously published methods to perform this testing were used.19–22 Briefly, before running commenced, each participant warmed up by walking on the treadmill for five minutes. Then participants ran for eight-minutes before any data were collected. Slow-motion reference videos were captured in the sagittal and frontal planes (240 Hz, iPhone 11 camera). Between minute 9 and 10, a 10-second sample of force data was obtained that consisted of an average of 12-14 consecutive strides for analysis. Foot strike type was visually confirmed by the investigators upon review of the sagittal plane high-speed videos.
Force data were collected from the instrumented treadmill at a frequency of 1,200Hz (AMTI, Watertown, MA, USA). A threshold of 20N GRF was used to set the initial foot impact and push-off. GRF data were low-pass filtered with a cutoff frequency of 40 Hz using a 4th-order Butterworth filter. The peak GRF, VALR, and vertical impulses were normalized to body weight. The vertical component of GRF was chosen because it is a commonly-studied feature of loading in the running science literature. Although medial-lateral and antero-posterior GRF components provide insight into forces related to braking and propulsion and lower limb control during stance, they were not the focus of the present analysis. MatLab (The Mathworks Inc., v R2023a, Natick MA; USA) and Excel (Microsoft Office v. LTSC 2024; USA) VALR were used to determine the slope of the ∆F/∆t of the most linear portion of the force curve, where ∆F is the change of vertical force, and ∆t is the change of time (between 20%-80% of the first rise to the peak of the vertical GRF)23 or vertical GRF at 13% of stance when a first peak was absent. The time required to complete the process from start (initial preparation of participant) to the completion of the data generation (GRF and VALR from the test) was monitored.
Markerless Motion Capture of Physical Function Performance. Motion data during a battery of functional tasks were captured using the DARI® Motion system (DARI® Motion Inc., Overland Park, KS, USA), an FDA-cleared markerless motion capture system. Eight high-definition cameras were arranged around a 3.65 m × 3.65 m capture area, recording at 60 frames per second. Skeletal tracking within the DARI® system was performed by the Captury software engine (The Captury GmbH, Saarbrücken, Germany), which implements a previously published tracking algorithm.24 In this setup, the human body model and camera images are represented by Sums of spatial Gaussians (SoG). The motion of the skeleton is estimated by optimizing a continuous, differentiable similarity measure between the body model and the images. As originally described, the similarity measure is based on color similarity. The method used here combined the color similarity with a term derived from a Deep Convolutional Neural Network to improve tracking.
Before data collection, each participant’s height and weight were entered into the DARI® software to calibrate the skeletal model. The entered weight and skeletal segment information was used to estimate center of gravity and mass for each segment. Velocity, acceleration, and jerk were derived from the software kinematic calculations. Segmental forces were calculated using Newton’s second law and summed to produce whole-body GRFs, with the distribution of these forces determined by the position of the center of mass.
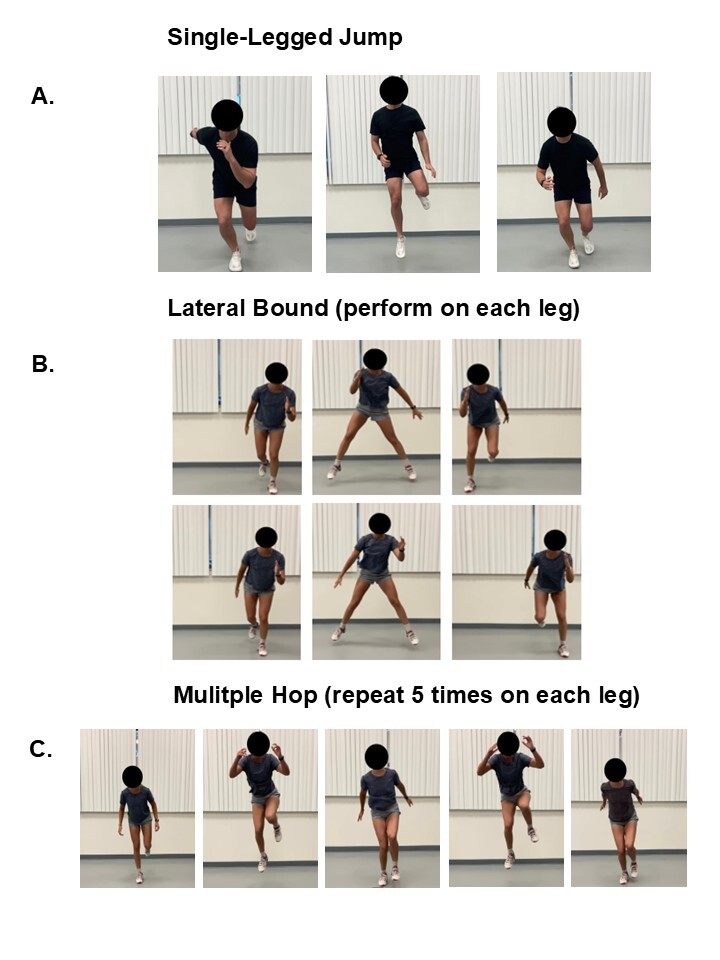
The three specific functional tests were chosen to represent body segment movements that have relevance to performing running motion and were comprised of single-legged dynamic tests. Specific tests were the single leg jump (both legs), the multihop test (five hops each leg), and lateral bounding motion (both sides). Figure 1 provides details of each of the three tests. These assessments were conducted after the instrumented treadmill run, once each participant reported that they had recovered enough to perform the tests. Participants were allowed to practice each test before data collection until they felt they could perform the test appropriately. Trials were captured for each test and the trial with the best score was saved. The DARI® system produced a 3D skeletal model for each participant estimating joint centers, capturing joint angles, center of mass excursions, and estimated force metrics. Performance and mobility scores were obtained by comparing individual data to the normative database in the DARI® system, which accounts for variables such as age, sex, and athletic background. Key metrics included performance variables (included jump height or distance) and estimated GRF upon landing and during loading. Scores were calculated using DARI® software proprietary calculations for each movement. Absolute interlimb GRF differences at takeoff and landing for each functional test were calculated as follows: Interlimb difference = (Right limb value [reference]-Left leg value). Values were also expressed as a percent value. Percent difference = [(Right limb value -Left leg value)/Right limb value]*100. The time to complete the three functional tests was recorded and documented.
Statistical Analyses. Statistical analyses were performed using SPSS version 29.0 (IBM, Armonk NY). Normality of the data (skewness, kurtosis) was assessed using Kolmogorov-Smirnov tests. Descriptive statistics for all study variables and demographics were calculated, and group differences between males and females were examined using one-way analyses of variance (ANOVA) for continuous variables and Chi square tests (χ2) for categorical variables. To determine whether any sex differences existed in any of the biomechanical variables, analysis of covariance (ANCOVA) were performed with age and running velocity as covariates in the models. The dependent variables were GRF, VALR, and physical function test performance scores (jump height, bound distance) and the independent variable was sex. Significance was established at p<0.05 for these statistical tests. Because several dependent variables were analyzed, a Bonferroni correction was applied to adjust the significance threshold. Effect sizes for these models were estimated using η2; this value quantifies the proportion of variance in the dependent variable explained by the independent variable. Values above 0.14 were considered a high effect, values of 0.06-0.14 were considered a moderate effect, and values <0.06 were deemed a low effect.
To determine whether associations existed between the biomechanical variables obtained from the markerless motion tests (GRF values at takeoff and landing, and performance scores) and those obtained from the running analysis, Pearson correlations were performed. A Bonferroni correction was applied to account for multiple comparisons, and an α value of 0.002 was deemed significant. Correlation coefficients were considered strong with values >0.8, moderate with values between 0.6-0.8, fair with values between 0.3-0.6, and poor with values <0.3.25
RESULTS
Runner Characteristics
A total of 62 runners met all inclusion criteria. Characteristics of the runners are shown in Table 1. Overall, participants averaged 31.5 ± 16.8 years of age, and 40.3% were female. The runners had an average of over eight years of experience, covering a weekly average distance of 37.1 ± 28.8 km, with the majority participating in speedwork. Approximately two-thirds of runners were in a competition preparation phase. The majority of participants were documented to be rearfoot strikers. The only sex differences that were detected were greater heights and weights among males compared to females (both p<0.001). Of note, the time required to complete the entire running assessment on the instrumented treadmill averaged 36 minutes and required three staff members (one engineer for data capture and processing, two for intake, preparation and testing). In contrast, the DARI® functional screen required one tester, 8 minutes of time.
Physical Function Performance Scores. A summary of key physical performance scores from the markerless motion physical tests can be found in Table 2. There were significant sex differences on both legs in the lateral bound jump distance and the multihop jump height; in both tests, men jumping further laterally and higher vertically than women (both p<0.05). Overall, small interlimb differences existed for lateral bound distance (3.6%) and single-legged jump height (14.3%). The interlimb difference for multihop jump height was negligible (0.2%). The average time needed to complete the testing and obtain the output averaged eight minutes and involved one staff member.
GRF Estimated from Markerless Motion. Table 3 provides the peak GRF values estimated from the three dynamic function tests. Sex differences were detected for the GRF values during lateral bound test and multihop test; men produced greater GRF peak values at both takeoff and landing (p<0.001). In the single-legged jump, males had a greater GRF peak during takeoff on their right leg compared to females (p<0.05). Interlimb differences were observed across all three tests during both takeoff and landing (ranges for lateral bound = 7.4% to 8.4%, Single-legged jump = 4.0% to 11.1%, and multihop test 6.0% to 6.2%).
GRF and VALR During Running. The GRF and VALR values obtained from the force plates during the running analysis are shown in Table 4. GRF values were higher in males for both limbs than females (p<0.001), but VALR values were not statistically different by sex. Overall, the interlimb differences in GRF and VALR for the whole cohort were small (0.7% and 1.0%, respectively).
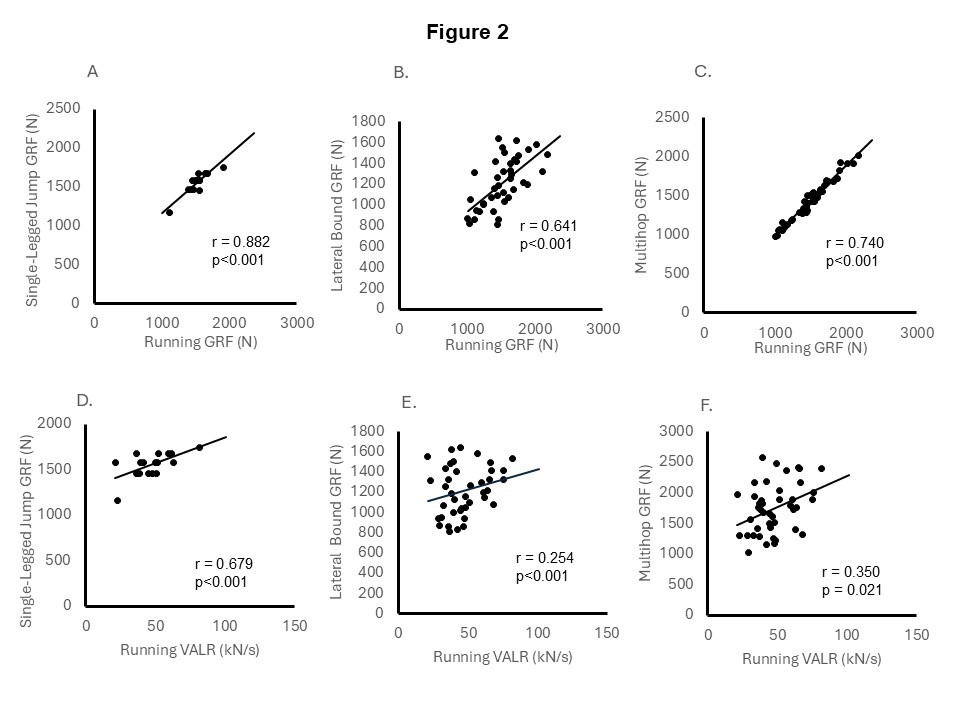
Correlations. Pearson correlations between running-derived GRF and VALR and markerless function test GRF with corresponding performance variables (jump heights, distances) are presented in Table 5. Correlation coefficients between GRFs from running, and markerless motion derived unilateral hop, lateral bound and multihop tests were moderate to strong (r=0.641 to 0.882; all p<0.001). Performance scores (jump heights and bound distance) were fair to moderate (r=0.478 to 0.625; all p<0.001). Correlation coefficients between VALRs from running and GRFs obtained from functional tests were fewer in number; unilateral jump GRFs and running VALR were moderate (r = 0.634 to 0.742; p<0.001). The jump distance obtained with lateral bound and VALR had a fair association (r=0.518; p<0.001). Figure 2 provides the scatterplots of select key associations.
_and_vertical_average_loading_rates_(valr)_ob.jpeg)
DISCUSSION
The physical function ability of male and female endurance runners was examined, and the strength of the associations between GRF and VALR (measured with an instrumented treadmill) and the same forces measured during three physical function tests (single-legged jump, multihop test [5-Hop Test], and lateral bound) using markerless motion capture was assessed. Interlimb functional differences for the three tests were relatively small. Overall, all three tests showed moderate to strong correlations with GRF during running, while only the single-legged jump GRFs showed a moderate correlation to running VALR. Functional test performance measures (jump height and jump distance) and their relationship to running kinetics were also assessed, which correlated most consistently with the lateral bound for both sexes. These findings suggest that the functional tests performed by the markerless motion capture system could offer translational value to running kinetics, particularly about GRF values.
GRF and VALR are related to bone and soft tissue stresses and injury.8,26 For example, runners with patellofemoral pain and plantar fasciitis have been observed to have 17.5–29% higher VALR and vertical instantaneous loading rates than healthy runners.8 There is evidence that VALR is better correlated with lower limb injuries compared with peak GRF values.9,27 However, some studies have linked elevated peak vertical GRF to specific injuries.28 The functional test GRFs, particularly the single-legged jump, are closely related to GRF during running. One possibility is that there are test-specific differences in the direction of force application upon loading that might more closely replicate those in running. For example, the single-legged jump is comprised primarily of vertical force application, whereas the multihop and lateral bound tests are characterized by relatively more medial-lateral application of force. Previous work has shown direction-specific differences in forces produced between the vertical jump and lateral jump tests.29 The single-legged jump using markerless motion capture may be a cheaper and more accessible method of estimating force loads during running compared with traditional laboratory-based approaches, such as instrumented treadmills. Importantly, compared to instrumented treadmills or commercial force plate systems, automated markerless motion systems also provide ability to capture and measure kinematics, which are also critical for running gait form and injury risk assessment. If cost is a factor for obtaining forces and other running related measures, systems that offer both kinetic and kinematic options may be most versatile and clinically useful.
VALR evaluates the rate at which force is exerted on the leg upon ground contact, and higher values have been associated with injury.9,30 Contrary to the correlation results for running GRFs, only the single-legged jump GRFs were moderately correlated with running VALR, while the lateral bound and multi-hop showed weaker, insignificant associations. This may be due to the innate variability of VALR as a rate measure compared to GRF as a single force value at one point in time. Previous studies are consistent with the current results, showing greater variability in VALR relative to peak GRF during running.31,32 The incorporation of frontal plane motion in the lateral bound, and the fatigue generated from subsequent jumps in the multi-hop, may create forces distinct from running compared to the single-legged jump. Taken together with the GRF findings, the single-legged jump appears to be the most clinically useful test for estimating running kinetics, providing clinically relevant information on limb asymmetry and neuromuscular control during running – all of which may be targeted therapeutically.
While not a primary purpose of the study, Table 2 lists the performance values (jump height and jump distance) obtained during functional assessments using the DARI system. The authors are not aware of any study that published these value ranges in runners from this markerless system. These values are within previously published ranges indicating that the measurement protocol utilized herein yields valid performance data.33,34 From the clinical perspective, dynamic tests with plyometric or higher-impact movements – as were tested here - are frequently used for return-to sport decision-making and to evaluate functional limitations and asymmetries.35 Some evidence shows correlations between poorer jump performance scores, interlimb asymmetries and higher injury risk,36,37 while evidence relating higher functional scores to performance after injury is inconsistent.38 Because these tests reflect lower extremity muscle power, strength, and leg stiffness,39,40 better performance scores were hypothesized to correspond with more favorable running kinetics. However, Table 5 shows inconsistencies in correlations between performance outcomes and running kinetics. Of the three functional tasks in this study, the lateral bound was the only test observed with a moderate, statistically significant correlation between jump distance and both running kinetic markers, while the multihop was correlated only fairly with GRF and the unilateral jump moderately with VALR. Lateral bound jump distance may provide the most accurate estimate of these aspects of running kinetics, though the overall the ability of these functional test performance markers to consistently reflect forces during running appears limited. Furthermore, these findings demonstrate that no single functional test fully encompasses both kinetic markers, and thus the use of multiple assessments (such as the single-legged jump coupled with the lateral bound, for example) may offer more comprehensive insight.
This study also revealed time savings with DARI® functional testing as a surrogate to complex 3D motion and treadmill testing to reflect running GRF measures. Recall that the time required to complete the entire running assessment on the instrumented treadmill averaged 36 minutes and required three staff members while the DARI® functional screen required one tester, 8 minutes of time. With a 28-minute time savings per assessment using DARI®, a total equipment cost difference of nearly 128,000 USD (25,000 USD for DARI) and a lower staff burden (estimated hourly cost difference at our institution for staffing is 310 USD) this markerless motion system with automated biomechanical metrics may enable providers the ability to implement these measures in a busy clinical setting.
Limitations and Strengths. An important limitation of the current study is the lack of follow-up to determine whether these DARI® data translate to future injury in runners. Methodological factors, including device and storage-related constraints on sampling rate, may have limited the temporal resolution and thus accuracy of the markerless motion capture (60 Hz in DARI® vs 1200 Hz in treadmill). Sampling bias may exist, as the sample consisted of runners seeking improvement in gait form; this population subset may be motivated to perform well in front of the performance team and reduce risk of injury compared with the general population, potentially limiting generalizability and reducing variability in running mechanics and functional performance measures. However, the participants included runners of all ages, both sexes, as well as varying running speeds and footwear, which strengthens our study’s generalizability. Another consideration is that alternative functional tests available in the markerless system menu not chosen for this study, such as the step-down, may have shown different or stronger correlations to running kinetics than those chosen. Strengths of the study include the comparison of the DARI® system to the gold standard of kinetic measures, with same testers conducting all the tests to reduce measurement variability. The DARI® functional tests chosen were simple and easy to implement, improving the applicability of our study’s outcomes to clinical practice. To expand the generalizability of these results to the clinical environment, future longitudinal studies are needed to assess whether markerless motion derived functional tests can predict running-related injury incidence over time. Additional research should also further elucidate the relationship between kinetic measures of running and performance outcomes in functional tests.
Conclusions. The results of this study indicate that peak running GRFs and markerless motion-derived single-legged hop, lateral bound, and multihop outcomes demonstrated moderate-to-strong correlations. Performance scores (jump heights and bound distance) demonstrated fair-to-moderate relationships and correlation coefficients between VALRs from running and GRFs obtained from functional tests were lower. These novel data offer a new perspective on how functional tasks relate to running-related GRF and VALR measures in male and female runners. It was demonstrated that commercially-available markerless motion capture systems correlate well with traditional methods to estimate running kinetics using physical functional tests.
Conflicts of interest
The authors report no conflicts of interest.
Acknowledgements
This work was supported by the UF Discovery Pathway for medical students (KT), at University of Florida, College of Medicine.