
INTRODUCTION
Jumper’s knee (JK), also referred to as patellar tendinopathy, is a functional overload injury that can occur after a time of intense and repeated stress to the patellar or quadriceps tendon.1,2 Sports that involve a lot of jumping or abrupt stops can increase the risk for developing JK. Soccer, considered as an explosive start-stop sport, is considered one of the high-risk sports.1 Epidemiological data show incident rates of JK of 13% in elite youth soccer players.3 Male adolescents4 aged 15 years or older1 are commonly affected. Elite and sub-elite youth soccer players have to perform repetitive maximal, multidirectional movements over a long period of time with only little time to recover.5 Although youth players have lower intensity of exercise and overall training volume in comparison to adult players, they have not reached their maximum physical and psychological capacity. Yet, they are required to perform high-intensity exercises and pressured to maintain a high level of performance during a competitive season,6 which could ultimately lead to a higher risk of injury. The large amount of total training and competition can result in an increased risk of sustaining an injury of the lower-extremity, 7 most commonly in form of overuse injuries like JK.8,9 In addition Kucera et al.10 described a consistently decreasing rate of injuries with increasing soccer and league experience in youth soccer players, which also leads to the conclusion that younger athletes are more susceptible to injury than adults.
Injury downtime due to ongoing symptoms along with recurring pain, as well as decreased mental or physical performance, can affect the level of competitive success and thus may impede the progress of an athlete’s career.11 Given the prevalence and high risk of sustaining JK at the beginning of a young athlete’s career, it is important to gather sufficient scientific data on performance changes that this injury results in. Previous studies12–20 that examined differences in physical and psychological characteristics in athletes with JK compared to healthy controls (HC) revealed varying results. For example, a cross-sectional study by Lian et al.13 showed a significantly better performance in vertical jump height for adult male volleyball players with JK (n=12, age: 23.6 ± 3.0 yr) in comparison with HC (n=12, age: 24.8 ± 4.6 yr). Siegmund et al.21 reported no significant differences in jump height in adult male basketball players (n=12, age: 18-29 yr) with JK compared to HC (n=12, age: 18-29 yr). Lastly, Cook et al.12 could not find a significant difference in jump height or 10-m sprint in affected (n=33, age: 14-18 yr) versus healthy (n=38, age: 14-18 yr) adolescent non-professional male basketball players. However, it is important to note that none of these studies compared subjects after a completed therapy to HC. Therefore, the final impact of JK on a youth athlete in the matter of physical performances following therapy has not been adequately reported upon in the current literature. Besides differences in physical performances, there is also evidence for discrepancies in psychological variables between injured and non-injured athletes. According to Nippert et al.,19 increased levels of psychologic stress, fear of injury or low self-esteem following injury can result in lower sport performance. In this regard, Zafra et al.20 compared psychological variables of injured tennis players with HC. They described a negative relationship between tendinitis and the influence of performance assessment as a psychological variable. Especially in players suffering from tendinitis, stress management during performance assessment was poor compared to HC.
In sum, the existing studies focus on varying attributes and do not look into the effects of JK on measures of physical and psychological performance in different dimensions of human performance, therefore not reflecting all the abilities required to perform physically demanding activities.22 Furthermore, the described studies were limited by (i) relatively small sample sizes of N=7-19 athletes,13,17,21 (ii) determining mostly physical but rarely psychological characteristics,12–14,16–18,21,23 and (iii) studying adult but not adolescent players.13,14,16–18,21,23 Moreover, previous studies have uniquely examined differences in physical12–18 or psychological20 performance in JK and HC. However, there is evidence that JK is an injury that affects an athlete over a longer period of time, varying from six months4 to four years.24 Therefore, a longitudinal approach was adopted in the present study in order to evaluate if the loss of performance could be observed only at the beginning of the season or if it also occured over the course of a season. Additionally, the occurrence of further injuries was considered because a lower level of physical25,26 or psychological27,28 performance measures is associated with an increased risk of injury.
The purpose of this study was to investigate differences in physical and psychological variables in a comparatively large sample (N=35) of sub-elite male youth soccer players, who previously underwent physical therapy for JK compared to HC over the course of a season. The authors hypothesized that subjects with previous JK would show significantly (i) worse physical and psychological performances and (ii) greater values of injury-/pain-related variables over the course of a season.
METHODS
Participants
Eighteen young sub-elite male soccer players, who previously underwent physical therapy for JK (n=18, age: 15.1 ± 0.8 yr, body mass: 60.5 ± 8.5 kg, body height: 170.7 ± 6.6 cm) and a group of 17 HC (n=17, age: 15.0 ± 1.0 yr, body mass: 62.9 ± 6.9 kg, body height: 170.0 ± 6.2 cm) participated in this study. The conventional therapy was conducted two to three times a week and was composed of unilateral eccentric squat exercises, as well as static quadriceps and hip flexor stretching. All subjects were originally examined by a physician and diagnosed with pain in the inferior pole of the patella or the proximal patellar tendon by palpation of the tendon and its attachments. An ultrasound was performed, and in cases where the tendon was classified as abnormal, a hypoechoic lesion and/or fusiform swelling was located in the proximal insertion of the patellar tendon. If neither of these pathological changes were evident the tendon was classified as being normal and therefore the subject excluded from the study. In addition, all included subjects reported pain during jumping exercises, as well as explosive stop-start movements at the time of the physical examination. Before entering the study, participants were familiarized with the testing protocol. Prior to each training session, participants were continuously questioned about their present level of pain using a visual analogue scale. The JK group was recruited from different soccer teams. At the beginning of the therapy program, the JK group was advised to maintain a pain-related rest period (13.3 ± 4.1 days) and to perform a limited training load during their period of therapy (58.2 ± 24.6 days). All subjects of the JK group had completed their therapy program and participated in at least one full team training session without experiencing pain in the week prior to the first testing for the current study. All participants were required to have at least four sessions of team practice per week and were questioned about their level of pain prior to each training session. Subjects were excluded if they had (i) surgical treatment in the last twelve months, (ii) any kind of other injury six weeks prior to the start of the study, (iii) any pain during full training load, or (iv) been originally diagnosed with patellofemoral pain syndrome, plica syndrome, Osgood-Schlatter, or Sinding-Larsen-Johansson syndrome. Furthermore, all participants were instructed to complete all tests without using any kind of pain medication, taping, or medical insoles and to discontinue testing immediately if any patellar pain occurred. Subjects were only allowed to participate in testing when no pain (visual analogue scale = 0) was present at the beginning of the test. The Human Ethics Committee at the University of Duisburg-Essen, Faculty of Educational Sciences approved the study protocol.
Procedures
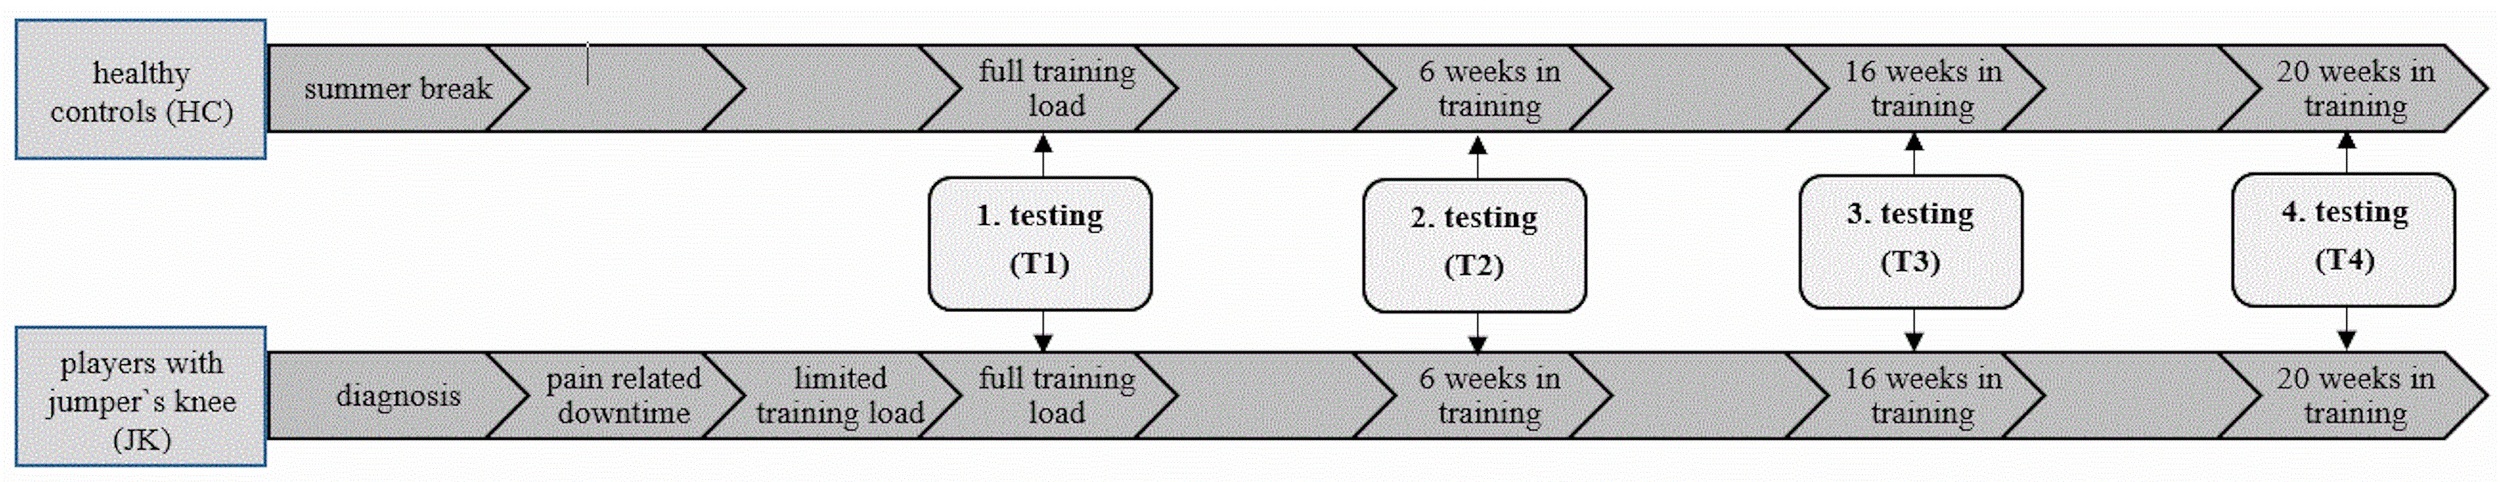
A longitudinal study design was used to assess physical, psychological, and injury-/pain-related parameters of both groups over the course of a competitive season. All athletes were tested four times (T1-T4) (Figure 1). The tests were conducted at start of the season (T1) as well as six weeks (T2), 16 weeks (T3), and 20 weeks (T4) after the start of the season. A variety of physical fitness tests were used, including 15-s foot tapping [FTT15], drop jump [DJ], jump-and-reach [JaR], acyclic sprint [AS], 30-m linear sprint, and Yo-Yo intermittent recovery test level 1 [YYIRL1]. All tests were performed on the same day in the order mentioned above and with 10-minutes rest periods between each test. A standardized warm-up protocol (i.e., 15-minutes of running, jumping, movement preparation, and change-of-direction speed [CODS] drills) was performed before the testing started. In addition, psychological variables were assessed using the Achievement Motives Scale (AMS) Sport29 prior to the physical tests. Concerning injury- and pain-related characteristics, the incidence rate of lower extremity injuries and non-contact lower extremity injuries per 1,000 houtrs (i.e., practices/competitions) as well as the period of injury-related rest and the number of pain-related training interruptions were documented.
Assessment of physical parameters
Muscle power
DJ and JaR were used to determine players’ muscle power.30,31 Both jump tests were performed on a gym floor wearing athletic shoes. For the DJ test, the players stood in an upright position on a box (height: 40 cm), with their hands on their hips. They were instructed to step off the box with one leg, drop down, and land on both feet immediately followed by a maximal vertical jump. This test procedure has been reported to have a high reliability (ICC = 0.95).32 Jump height was determined using OptoJump® photoelectric cells (Microgate, Bolzano, Italy), which were connected to a laptop using OptoJump® software. During the JaR, players stood in an upright position and were then asked to perform a maximal countermovement jump, which was clinically acceptable showing a nearly perfect reliability (ICC = 0.97).30 Subjects were instructed to touch a scale marked in 0.5-cm increments for measurement purposes attached to the wall leaving a mark with stamp ink at their maximal JaR height. Jump height was assessed by subtracting standing reach height from JaR height. Standing reach height was determined to the nearest 0.5 cm. All players were instructed to jump as high as possible (DJ, JaR) and to keep ground contact as short as possible during DJ. Both jump tests were performed a total of five times (two practice trials followed by three trials for data collection), of which the greatest jump height value was used for further analysis. Breaks of ten minutes and 30 seconds were given between jump tests and single jump trials, respectively.
Change of direction speed
The AS time was measured using timing gates (Smartspeed Lite®, Fusion Sport, Brisbane, Australia). The setup of the test is comparable to that of the modified agility T-test, which uses a shorter distance than the CODS test and shows a high reliability (ICC = 0.95).33 In the execution of the test, side-steps were replaced by sprints, because side-steps are less relevant in soccer than linear sprints.34 After the start of a trial, which was signaled using a visual stimulus, participants were instructed to run straight to the first cone (5-m distance), then change direction to the second cone (2.5-m distance), and return the same way back. The first trial was performed with a change of direction to the left (AS left) while the second attempt included a directional change to the right (AS right). The test was performed on a surface with artificial grass in dry weather conditions wearing soccer shoes. A total of six trials (three per direction) were executed with 60-s breaks in between. Only the fastest trial for each direction of movement was used for data analysis.
Speed
The FTT15 was used to assess cyclic speed performance and has been reported as moderate to nearly perfect (ICC = 0.69-0.98) regarding reliability.35 The athletes stood barefoot on a gym floor within OptoJump® bars with their feet hip-width apart. Athletes were instructed to perform as many floor contacts as possible with both feet during 15 s. Measurement started with an athlete’s first step. Three trials with 60-s rest periods in between were performed. Only the tapping frequency was assessed as it depends on a subject’s motor capabilities,36 thus representing a measure of speed whereas the fatigue-index is a measure of endurance. The trial with the highest frequency of taps of both legs combined was included in the analysis.
Sprinting performance was measured over a 30-m straight distance with interims at 5 m and 10 m using timing gates (Smartspeed Lite®, Fusion Sport, Brisbane, Australia). The start of a trial was signaled by a visual stimulus. The test was performed on an artificial grass surface in dry weather conditions wearing soccer shoes. Each athlete performed three trials with 60-s breaks between trials and the best result (i.e., shortest time) was used for further analysis. For this test procedure, large to near perfect ICC-values of 0.80 (5 m), 0.87 (10 m), and 0.97 (30 m) were reported.37
Endurance
As previously described by Krustrup et al.,38 the YYIRL1 was used to determine soccer-specific endurance and is described as a reliable test procedure for young athletes (ICC = 0.82-0.94).39 The test consists of 2 x 20-m sprints alternated with 2 x 5-m recovery phases and was performed at increasing velocities on artificial grass in dry weather conditions wearing soccer shoes. The progressive increase in velocity as well as the allocated time to reach the finish line were signaled acoustically using a portable CD player (JVC, RVNB20W, Yokohama, Japan). Following each 40-m distance, the athlete had a 10-m phase of active rest lasting a total of 10 s during which he jogged slowly. Testing was terminated after an athlete failed to reach the finish line twice within the given time over the course of the entire test. The total distance (m) covered was measured and used for analysis.
Assessment of psychological parameters
The AMS Sport was used to determine differences in psychological variables between athletes. The two achievement motive components “hope for success score” and “fear of failure score” were assessed using a questionnaire, which was filled out by the participants individually and without further explanation. Each scale has 15 items, with an answering scheme ranging from 1 (not true for me at all) to 4 (exactly true for me). To calculate the net hope, the sum of the component “fear of failure” was subtracted from the sum of the component “hope for success”.29
Assessment of injury- and pain-related parameters
Injury- and pain-related characteristics were assessed through day-to-day tracking of data by the coaches and the athletic department of the participating clubs using a visual analogue scale (0-10). Any injuries or pain-related training interruptions were continuously documented using an online database (SoccerWeb, SoccerCollection oHG, Iserlohn, Germany). The operational definition of injury was an injury acquired during training or competition within the club that completely prevents the player from continuing soccer for at least one day.
Statistical analyses
Data are reported as means and standard deviations (SD) after normal distribution was confirmed by the Shapiro-Wilk test (p > 0.05). For each testing session, a univariate analysis of variance (ANOVA) was applied to analyze differences in physical and psychological parameters between the two groups. Further, effect sizes were calculated by converting partial eta-squared to Cohen’s d.40 Statistical analyses were conducted using SPSS version 24.0 (IBM Corp., Armonk, NY, USA). Statistical significance was set at p < 0.05.
RESULTS
Differences in physical fitness and psychological variables of sub-elite youth soccer players, who completed physical therapy after JK compared to HC across the season are presented in Table 1.
Physical parameters
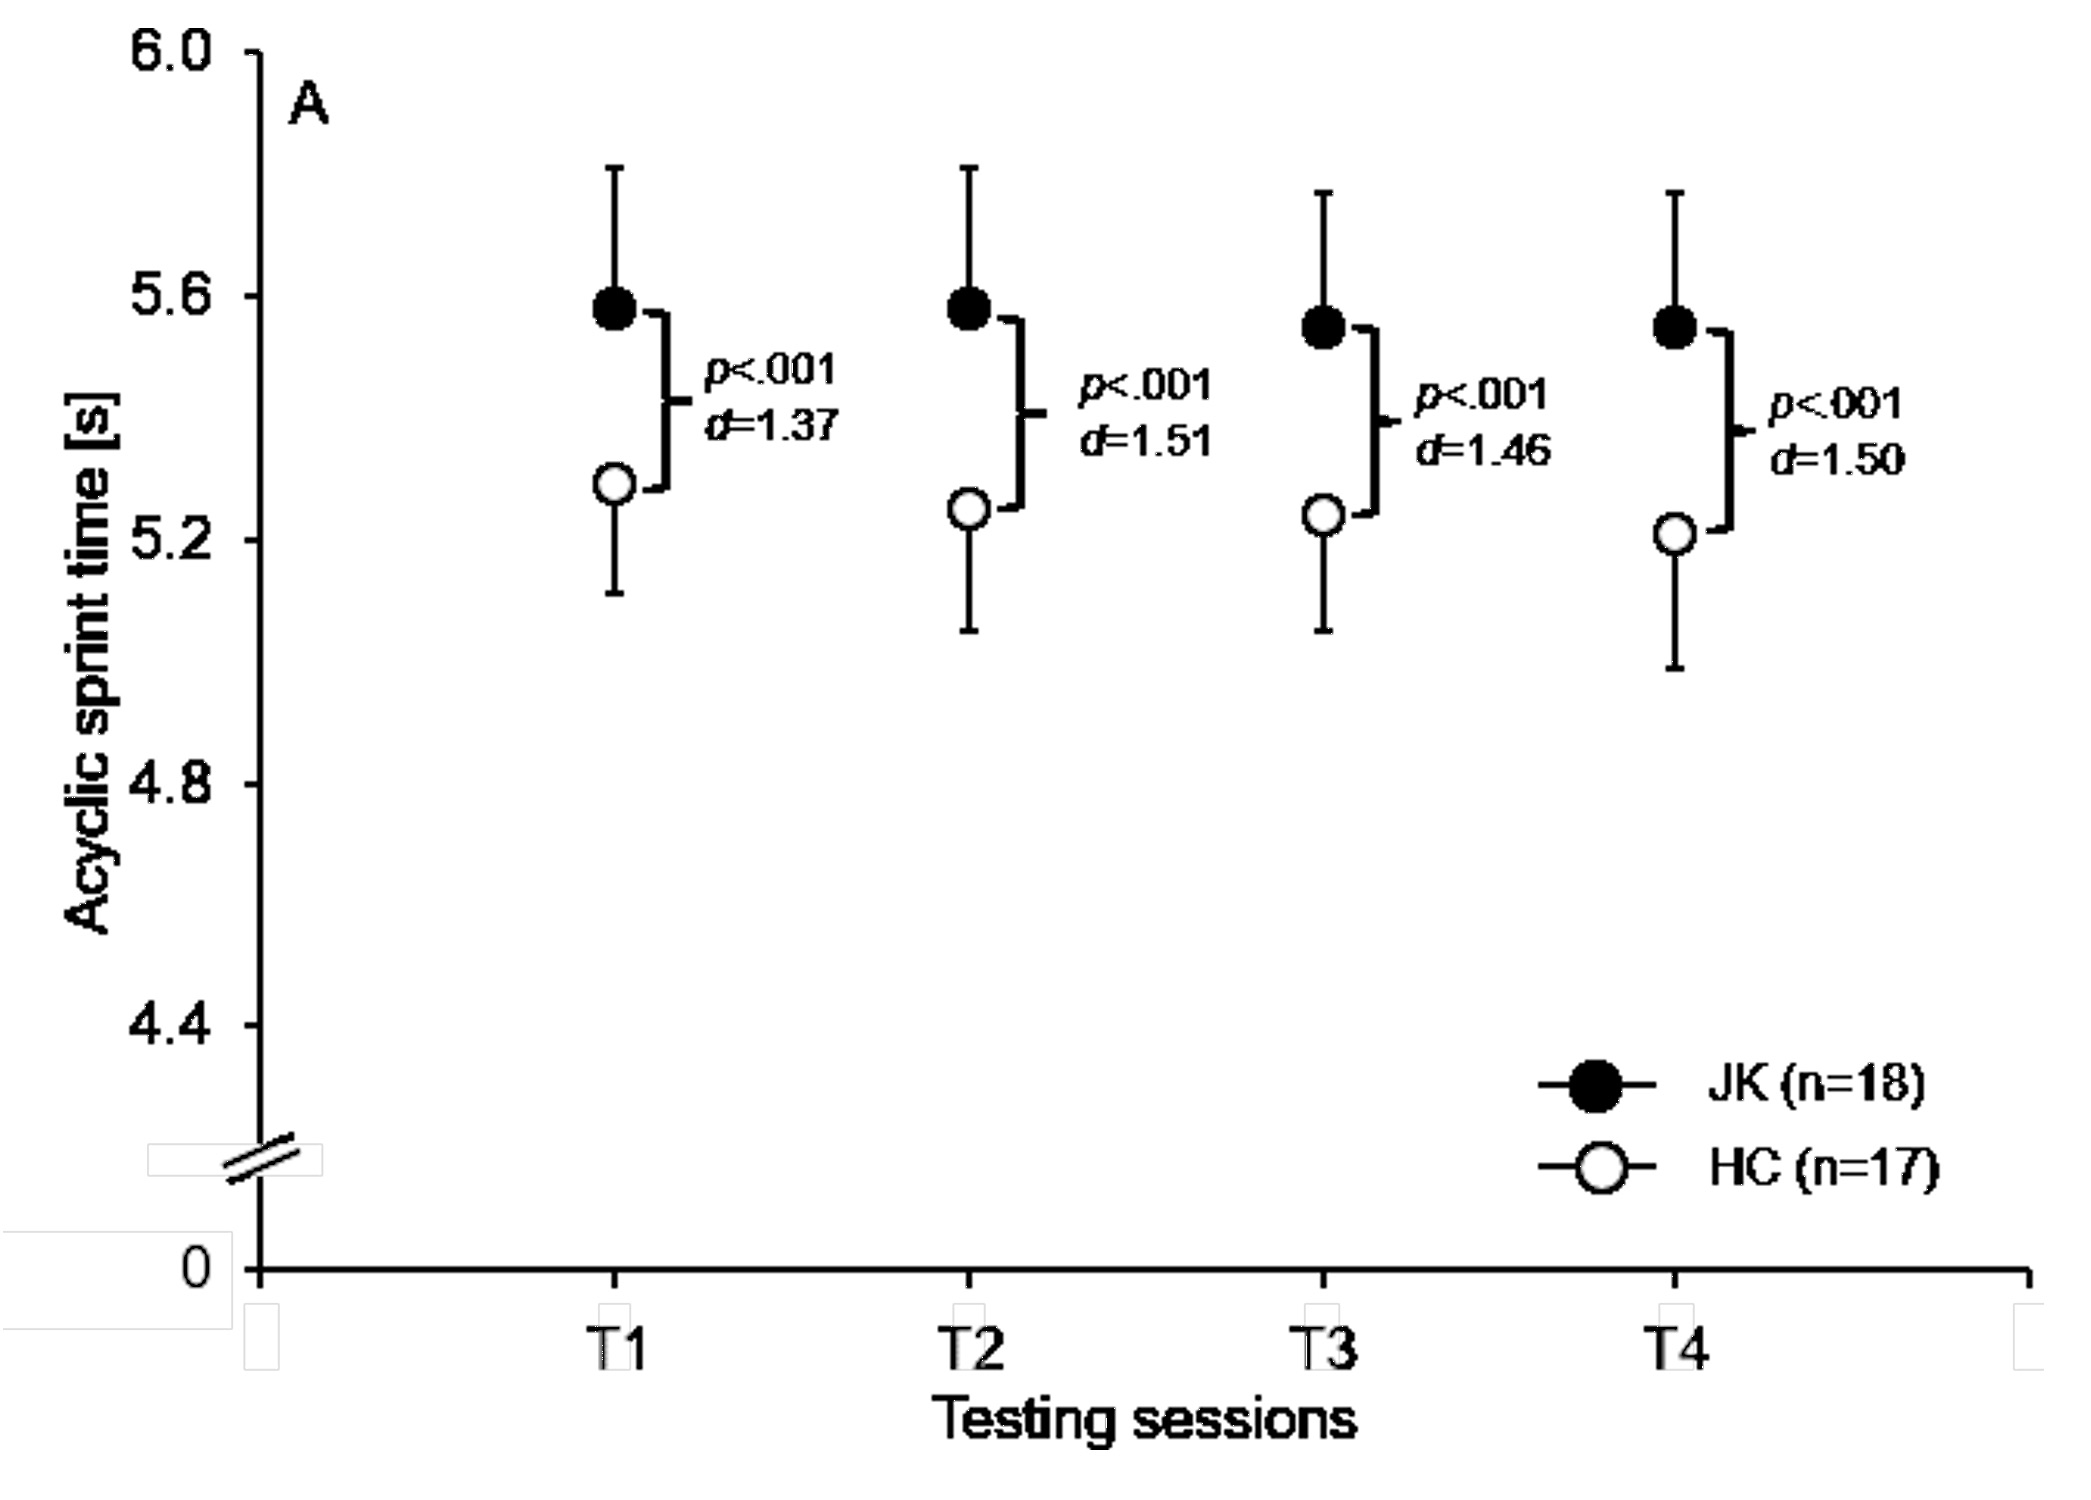
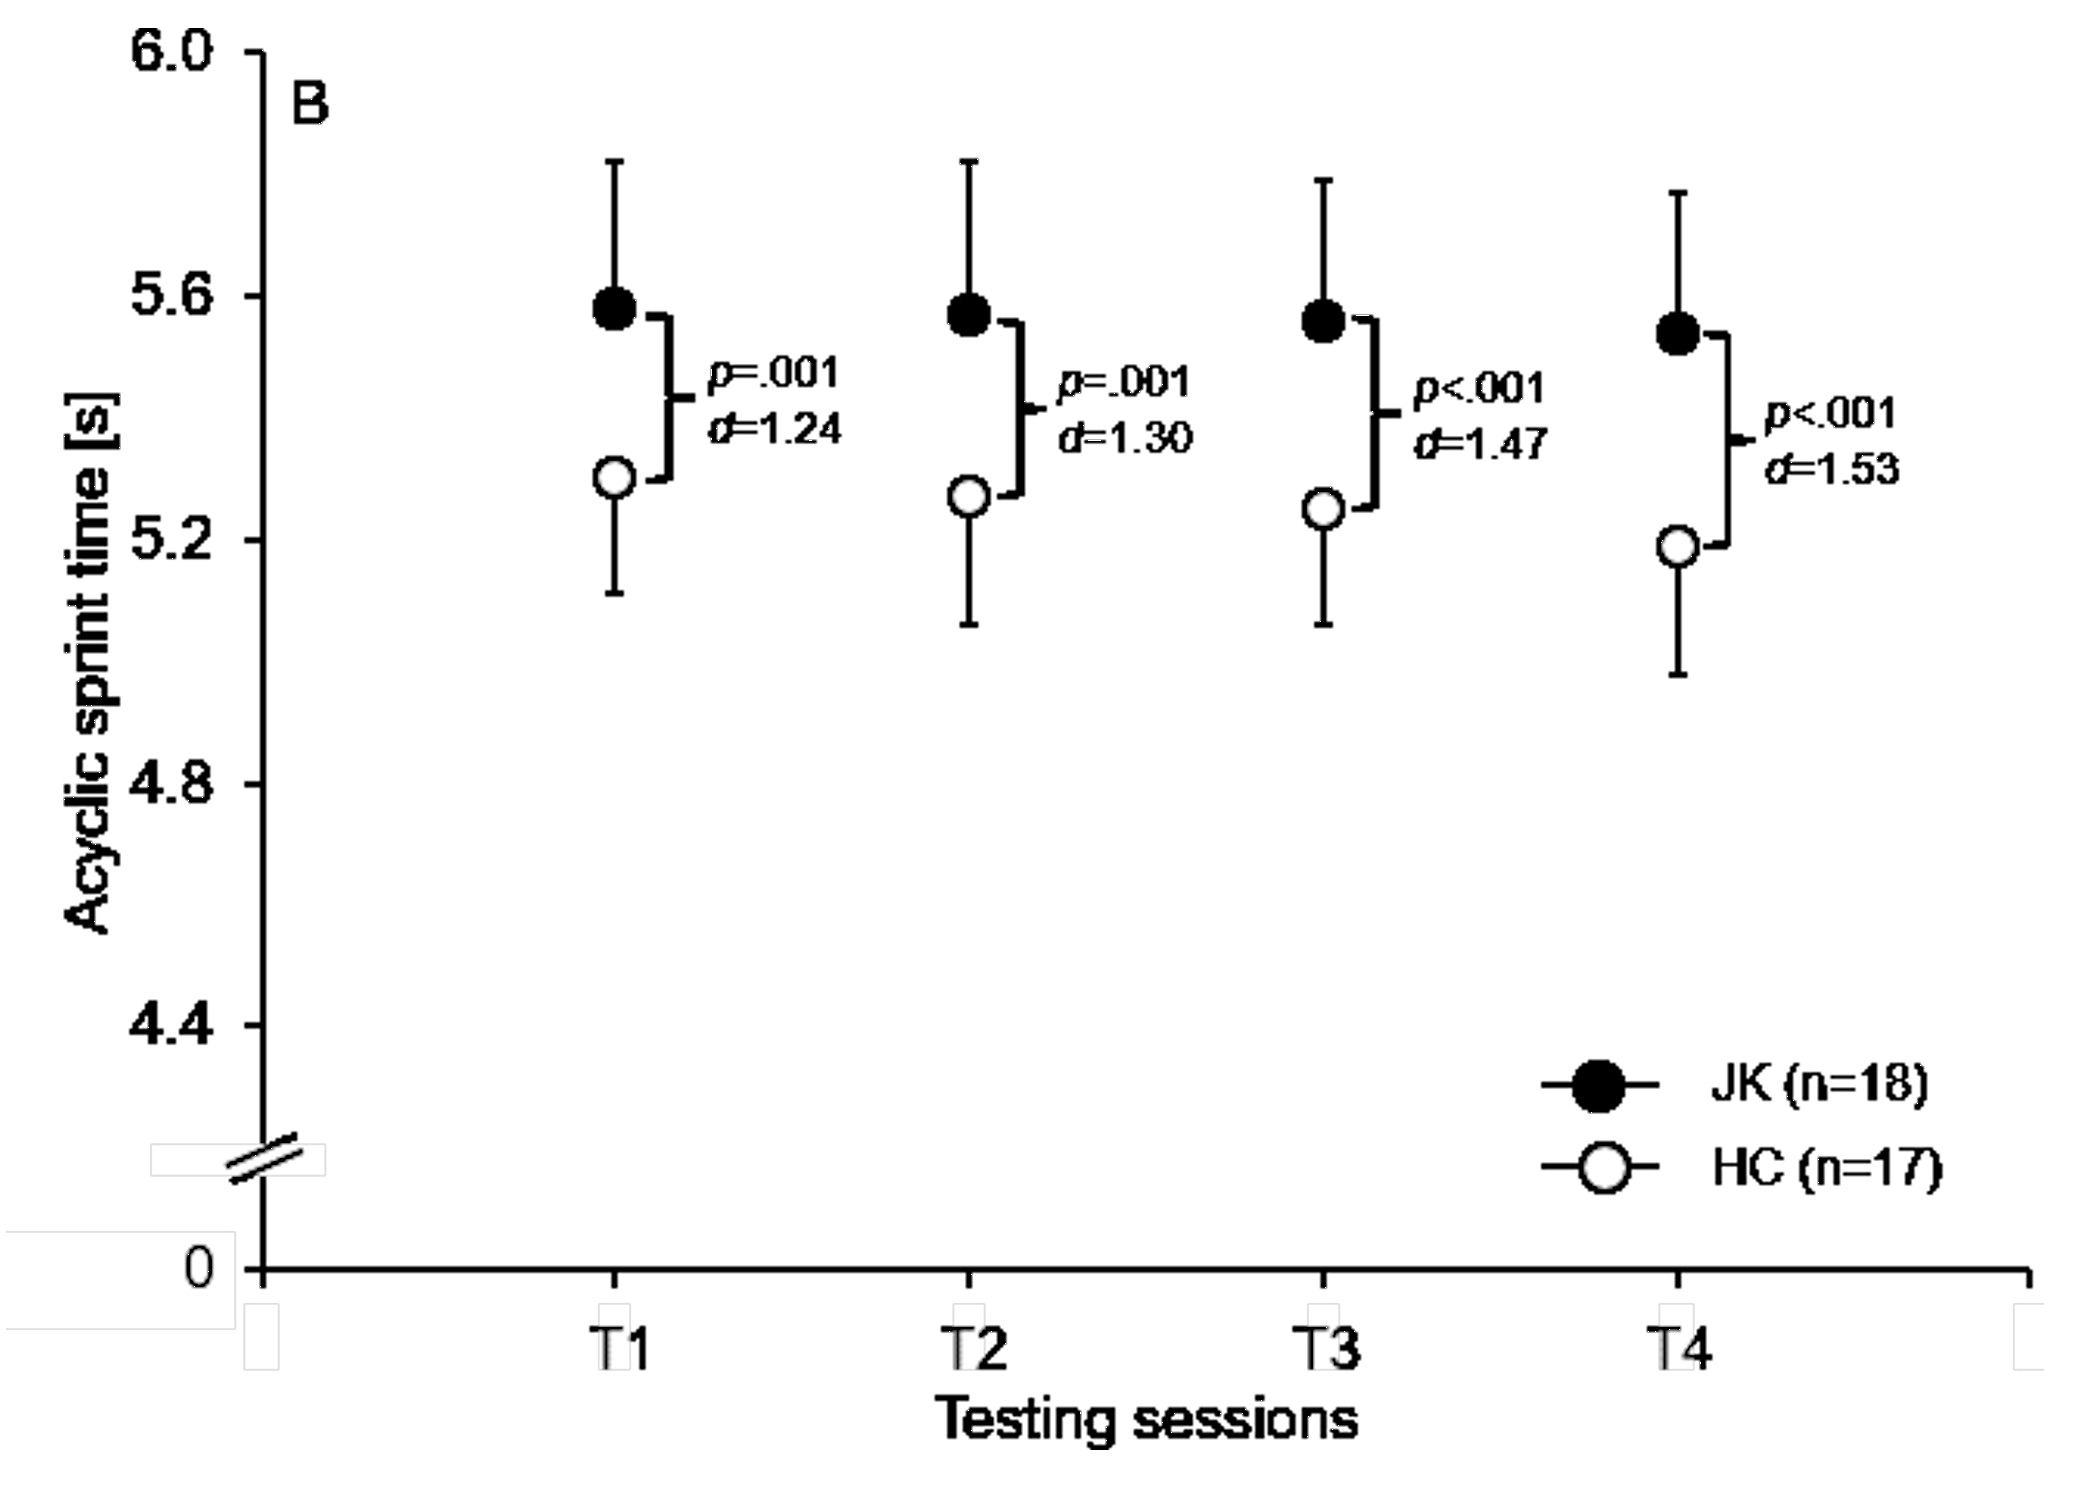
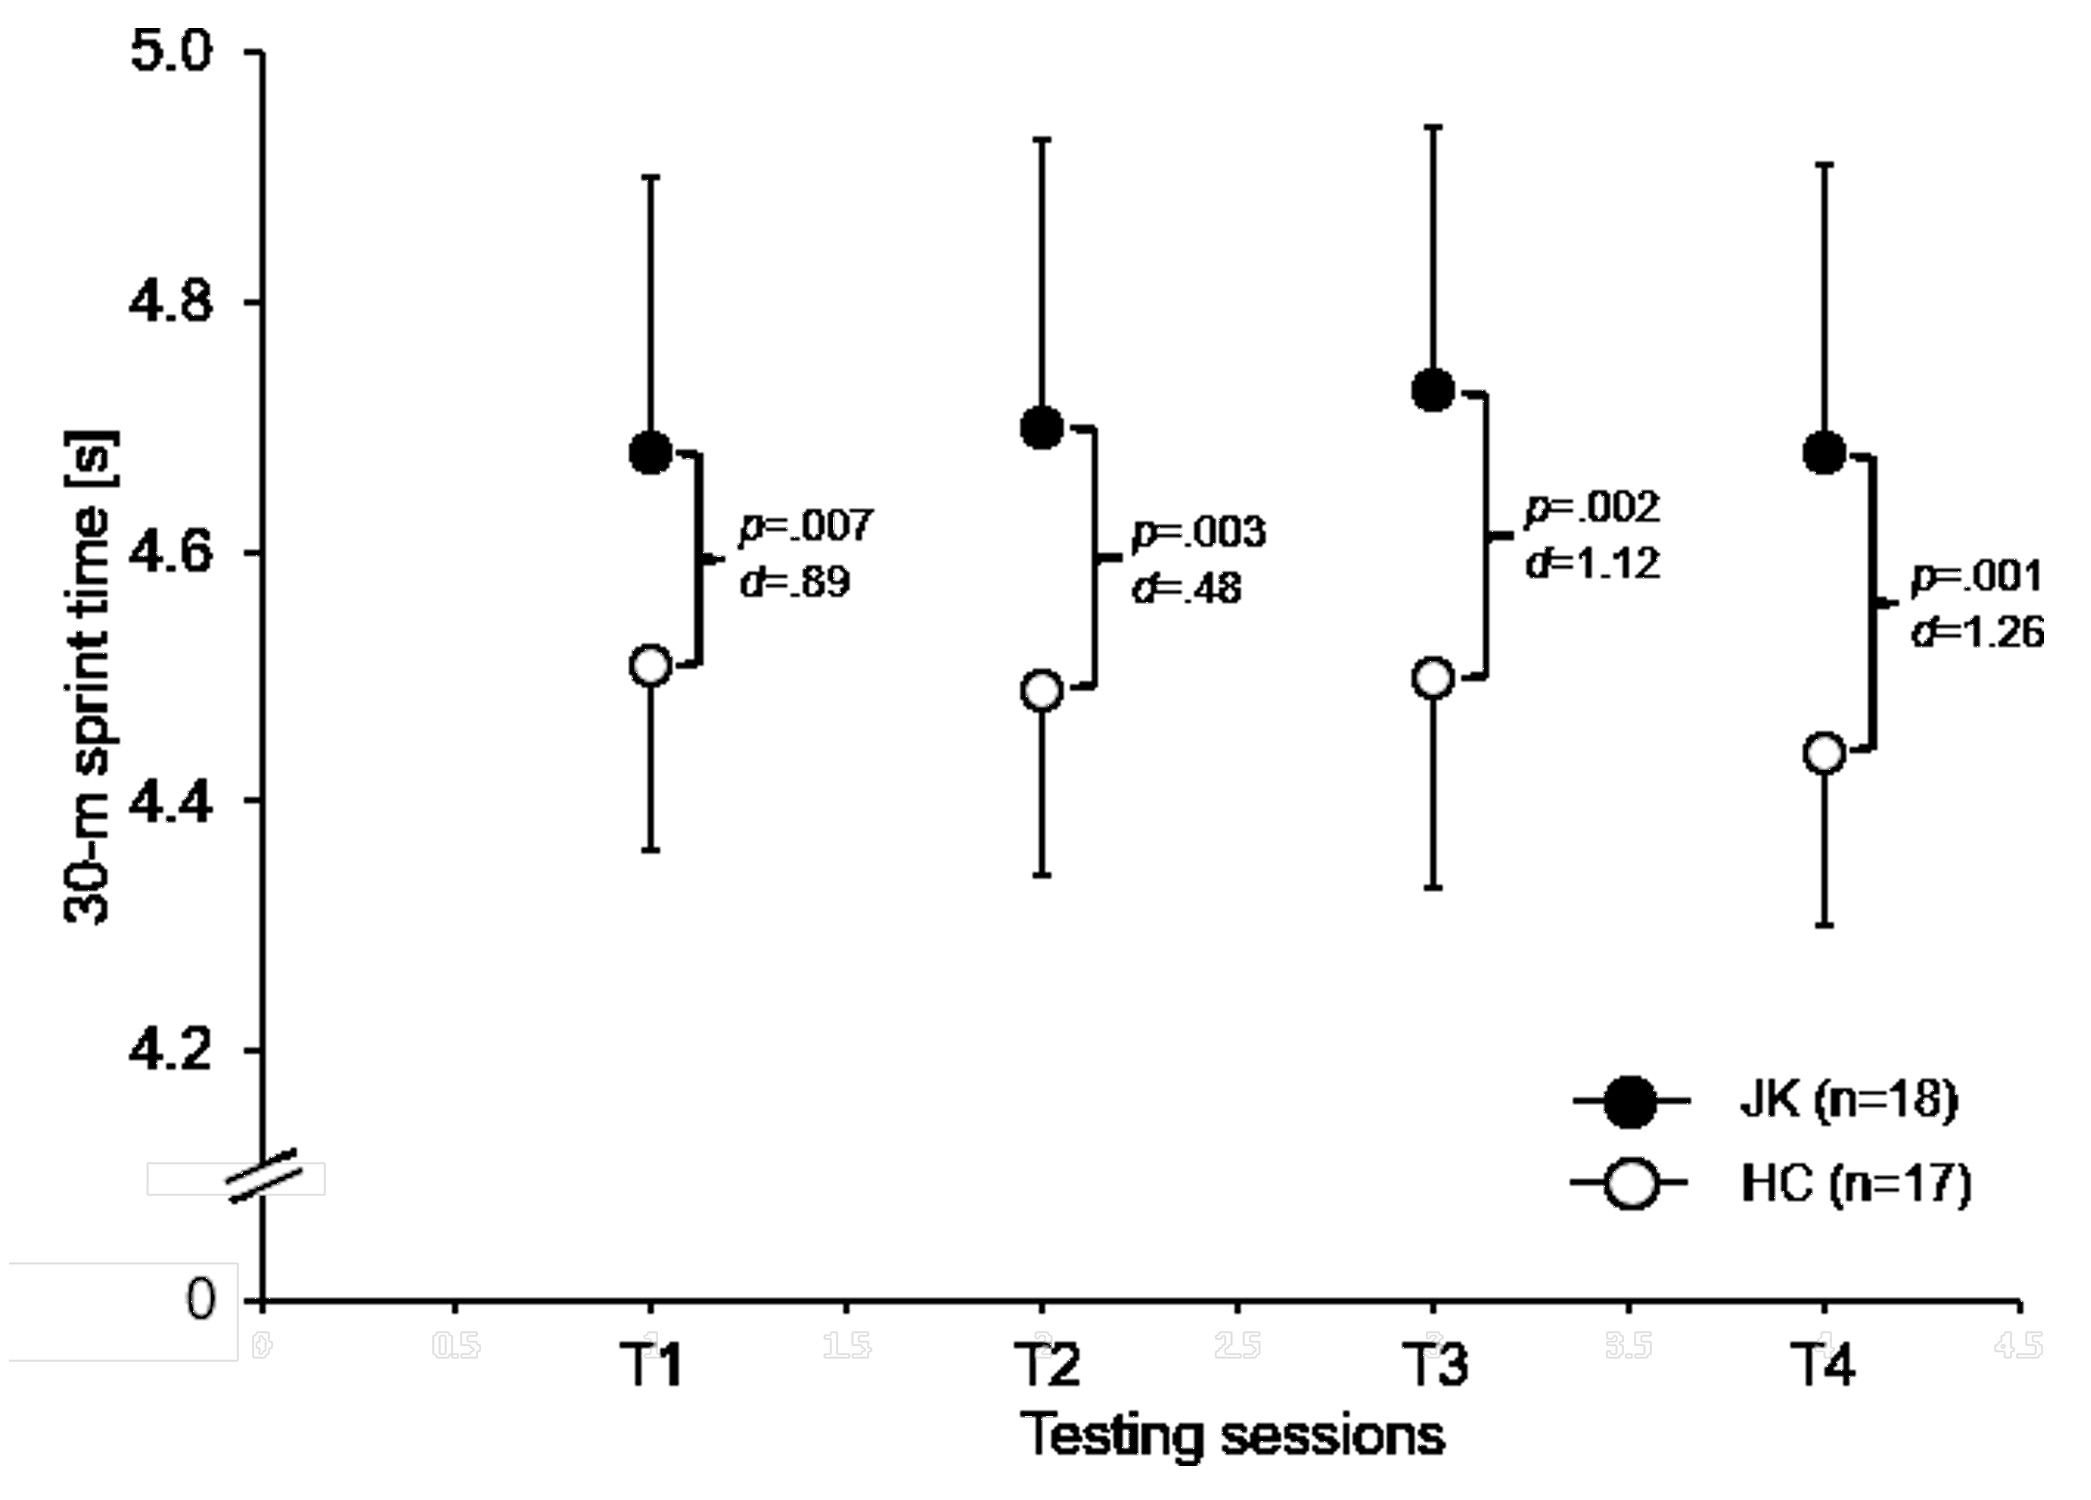
The ANOVA revealed significantly lower levels of performance for the AS left (∆ 0.29-0.34 s; ∆2.5-6.5%; p < 0.001; 1.37 ≤ d ≤ 1.51 [T1-T4]; Figure 2A), the AS right (∆ 0.28-0.35 s; ∆5.3-6.7%; p ≤ 0.001; 1.24 ≤ d ≤ 1.53 [T1-T4]; Figure 2B), and the 30-m linear sprint time (∆ 0.17-0.24 s; ∆3.8-5.4%; 0 p ≤ 0.007; 0.48 ≤ d ≤ 1.26 [T1-T4]; Figure 3) in players with previous JK compared to HC at each of the four testing timeframes. None of the other physical performance tests showed statistically significant differences at any of the four testing times.

Psychological parameters
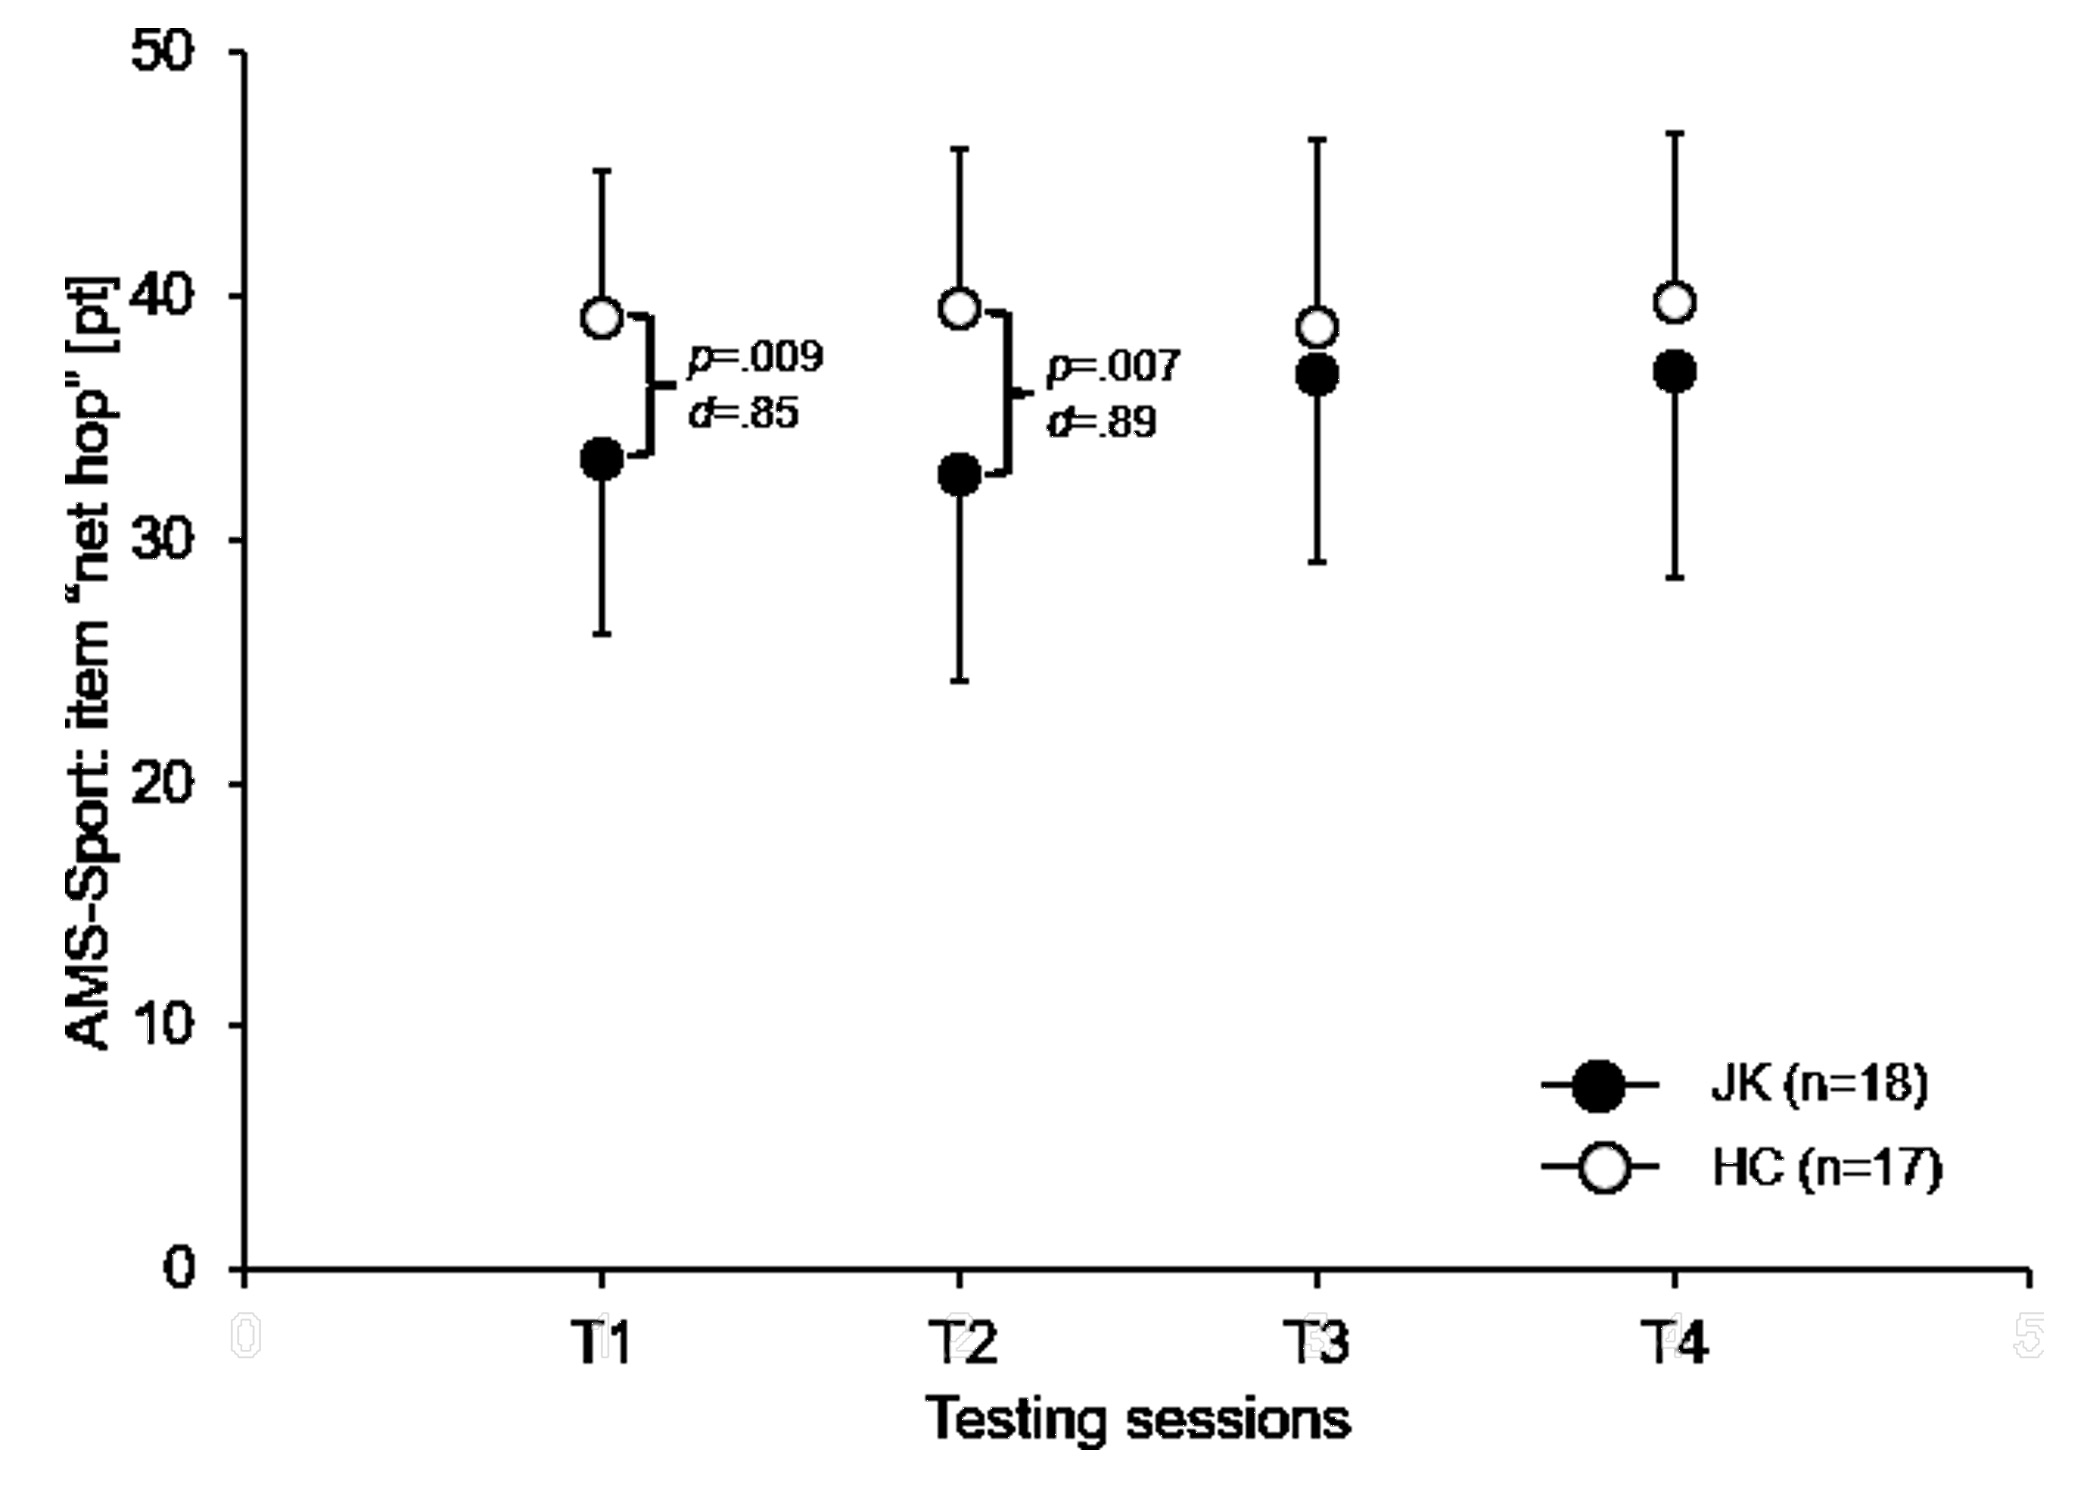
At the start of the soccer season (T1; ∆-14.8%; p = 0.009; d = 0.85) and six weeks after (T2; ∆-17.2%; p = 0.007; d = 0.89), “net hope” was significantly lower in players with previous JK than in HC (Figure 4). Further, the ANOVA yielded significantly lower values for “hope for success” (∆-2.5%; p = 0.032; d = 0.65) in players with previous JK compared to HC at T1 (Table 1). Lastly, significantly higher values for “fear of failure” occurred among players with previous JK as in HC at T1 (∆97.9%; p = 0.027; d = 0.68) and T2 (∆135.6%; p = 0.012; d = 0.80) (Table 1). No further differences were found in these variables for the remaining testing points.


_betwe.jpg)
Injury- and pain-related parameters
Differences in exposure time and injury-/pain-related variables between players with a history of JK and HC across the season are shown in Table 2. In terms of exposure time and incidence rate incorporating all injuries, the ANOVA showed no significant differences. However, significantly higher values for incidence for non-contact lower extremity injury (p = 0.049; d = 0.69), period of injury-related rest (p = 0.043; d = 2.06), and pain-related training interruptions (p < 0.001; d = 1.35) were found in players with previous JK compared to the HC over the course of the season.
DISCUSSION
To the authors’ knowledge, few studies have examined differences in physical, psychological, and injury-/pain-related variables over the course of a season between sub-elite male youth soccer players, who previously underwent physical therapy for JK versus HC. The main findings of this study revealed that players with a history of JK, in comparison to HC, have (i) significantly worse physical fitness values for measures of CODS (acyclic sprint time) and speed (30-m linear sprint time) at all four testing times, (ii) significantly worse values in psychological variables (i.e., net hope, hope for success, fear of failure) in the first two testing sessions after zero and six weeks (T1 and T2), (iii) no significant differences in muscle power (DJ and JaR) and endurance (YYIRL1), and (iv) significantly higher values for non-contact lower limb injuries, injury-related rest period, and pain-related training interruptions over the course of a competitive season. In addition to the p-value (indicator for statistical significance), the d-value was also quantified, which is used to determine whether a difference is of clinical relevance. According to Cohen40, the d-value can be classified as small (0 ≤ d ≤ 0.49), medium (0.50 ≤ d ≤ 0.79), and large (d ≥ 0.80). All of the detected significant differences in physical, psychological, and injury-/pain-related performance, can be considered as medium to large clinical relevance.
Differences in physical variables across the season
Differences in the level of physical performance were found at all four testing times measuring CODS and speed that concur with the initial hypothesis, suggesting that subjects with previous JK will show significantly worse physical performances over the course of a season. More specifically, acyclic sprint time (CODS) and 30-m linear sprint time (speed) were significantly worse in soccer players with previous JK compared to HC at all times of data collection covering a range of 20 weeks. This was supported by medium to large effect sizes (AS left: d = 1.37-1.50 / AS right: d = 1.24-1.53 / 30-m linear sprint: 0.48-1.26) indicating a real difference in performance. The present study highlights a difference in CODS performance between the two groups. The largest difference between JK and HC was observed at the last testing (AS left: p < 0.001; d = 1.51 / AS right: p ≤ 0.001; d = 1.53), which means JK (AS left / AS right: 2.7 m/s) is on average 0.98 m behind HC (AS left / AS right: 2.9 m/s), when HC crosses the finish line. Similarly, HC (6.7 m/s) performed better than JK (6.4 m/s) in 30-m linear sprint (p < 0.007; d = 1.26), so that JK were 1.62 m behind HC. Under consideration of performance during competition these differences in velocity may decide which player takes possession of the ball first and therefore takes control of the game. This finding is partially in accordance with that of previous studies as some of them also reported lower physical performance levels in athletes with JK than in HC.14,17,41 Others, however revealed higher levels of performance15 or found no significant performance difference.12,18 For example, Bisseling et al.42 reported lower eccentric muscle activity and a stiffer landing strategy in asymptomatic subjects with previous JK performing DJ compared to HC. They interpreted their findings as a consequence of the persistent presence of pain associated with jumping exercises during their previous JK injury. Lower CODS and speed performances for athletes who previously underwent treatment for JK compared to their healthy counterparts may be explained by the greater tensorial stress occurring during the acyclic and linear sprint tests. The CODS test used in this study included directional changes at high velocities and multiple high impact stops. Furthermore, the athletes had to perform almost full unilateral knee extensions during the change of direction, which could have led to a higher tendon stress3 and forced the patella to provide 31% of total knee extension torque43, thus impairing performance in athletes recovering from JK. Moreover, a previous study42 examining athletes after completing JK therapy associated tendon stiffness with lower performance in high-velocity movements, which could also help to interpret these findings. From a practical perspective, a reduction of physical performance regarding CODS and speed suggests a specific emphasis of these components during testing and training of athletes with previous JK. In other words, assessments of CODS and speed should be incorporated in return to play guidelines for JK by carefully introducing CODS and speed exercises in post-rehabilitation training routines.
The findings of differences in physical performance were limited to parameters of CODS and speed. However, measurements of muscle power (i.e., DJ and JaR) and endurance (i.e., YYIRL1) were not significantly different between the two groups of players. This suggests that some components of performance (i.e., CODS, speed) seem to be more susceptible to a loss in performance due to patellar tendinosis/tendinitis/tendinopathy in youth athletes than others (i.e., muscle power, endurance). Since there are no prior studies that have measured CODS and speed post-rehabilitation, only speculative assumptions can be made of its causes. Dauty et al.44 measured a deficit in knee extension torque in players with symptomatic JK compared to HC using isokinetic tests. Assuming this deficit is persistent in subjects who completed rehabilitation after JK, this may be the cause of poorer performance in CODS and speed. Furthermore, a lower sensitivity of the applied jump (i.e., DJ and JaR) and endurance (i.e., YYIRL1) tests in the detection of JK-related changes in physical performance could be another reason for the lack of discrepancies between JK and HC. Further research should consider the inclusion of a wider range of high-speed activities in the test procedures, such as the cutting maneuver test45 or repeated-shuttle-sprint ability test.46 We could not confirm significant differences between JK and HC in muscle power, whereby the therapy routine of JK, focusing solely on strength training rather than high velocity exercises, could provide an explanation. When interpreting the lack of significant differences in endurance, we should also consider the fact that the JK group had a long period of limited training load during their period of therapy (58.2 ± 24.6 days), involving mostly low velocity technique and endurance training. Therefore, further research is needed to reveal whether these measurements of muscle power and endurance are less sensitive in detecting differences in physical performance in youth soccer players with a history of JK compared to those of CODS and speed.
Differences in psychological variables across the season
In accordance to the initial hypothesis of worse psychological performance values over the course of a season, significantly worse values in the parameters net hope, hope for success, and fear of failure were found in soccer players with previous JK than in HC. The low score of JK in “hope for success” shows the athlete’s fundamental insecurity in facing and mastering an athletic challenge, or in other words the capability believing in his own physical abilities. A significantly higher score in “fear of failure” of JK compared to HC suggests an increased anxiety of failing in competition or not being able to perform certain movement skills. The criteria “fear of failure” and „hope for success" only showed significantly different scores at the first two testing sessions (i.e., start of the season and six weeks thereafter) and disagree with the finding of Elbe et al.29 who stated that the factors of the AMS Sport are consistent within a subject’s life and do not change under any circumstances. The effect sizes of the first two testing times (net hope: d = 0.85-0.89 [T1 and T2] / hope for success: d = 0.50-0.65 [T1 and T2] / fear of failure: d = 0.68-0.80 [T1 and T2]) indicate that the injury had a strong negative impact on the participants. Johnston et al.47 revealed similar difficulties of athletes in their qualitative analysis with competitive athletes. According to Johnston and colleagues, the athletes’ lower performance after injury was associated with lower sport confidence, which was related to a fear of injury or recurrent injury. This fear of injury presented as being hesitant, holding back, not giving 100% effort or being wary of injury-provoking situations.47 Most likely, athletes underestimated the impact of JK on their physical performance even after treatment had been completed and therefore were not able to cope well with these new circumstances. Moreover, it may be speculated, that the sport coaches did not appropriately progress them into physical activity and had them take on higher training loads and intensity too soon. Gould et al.48 found that athletes returning after a severe injury identified their lower performance in competition as a source of stress and frustration. An explanation for the lack of significant differences between JK and HC at the two last points of data collecting (i.e., 16 and 20 weeks after the start of the season) may be that athletes had regained confidence in their physical capabilities after realizing that the symptoms were not reoccurring despite performing high-intensity exercises. This theory can be supported by the findings of Smith et al.49 who measured higher levels of anger and depression after injury, but also reported a swift improvement when the subject approaches full recovery. Thus, it is important to focus on improvements in the process of rehabilitation. Zafra et al.20 showed a relationship between psychological variables and injuries in tennis players. Especially players with tendinitis showed a significant relationship between a higher number of injuries and lower score in motivation.20 As a consequence, these findings should lead to further research on the impact of injuries and rehabilitation methods on psychological variables of athletes. For example, psychological counseling and the verification of its effects on psychological and physical parameters could be a field of interest. Moreover, optimizing physical recovery in form of holistic treatment procedures to secure the athletes’ belief in their own movement abilities could be another point of interest.
Differences in injury- and pain-related correlates
This study showed significantly higher values of non-contact lower extremity injuries, injury-related rest periods, and pain-related training interruptions for soccer players with a history of JK compared to HC over the course of the season. The higher incidence rate of non-contact lower limb injuries may be attributed to the pain-related rest period and limited training load during therapy. It is likely that the subjects’ muscle structure and overall physical fitness did not yet adapt to the requirements of competitive sports after only one full load training session. Therefore, it is possible that the players’ training intensity was increased too soon. Although Le Gall et al.50 showed only a few percent (n=29, 7.8%) of the players suffering from tendinopathy. In light of our study’s findings this could also lead to the conclusion that players with JK post-rehabilitation are also more susceptible to injuries during competition than HC. In another prospective cohort study, Kucera et al.10 described a positive association between previous injury and injury incidence in youth soccer players. Participants without previous injuries (2.5 per 1,000 h) showed a significantly lower injury incidence rate than those with two or more injuries (6.9 per 1,000 h). In relation to Table 2, the findings of the present study are in keeping with this report. The longer period of injury-related rest and the greater number of pain-related training interruptions may be indicative of an insufficient rehabilitation procedure. On a professional level, a successful rehabilitation should not only aim for the athlete to be game ready in general, but also rectify any abnormalities that led to the injury in the first place. A further reason might be that regular training and competition were resumed too early. Large effect sizes of d = 2.06 (injury related rest period) and d = 1.35 (pain-related training interruptions) are indicative of clinical meaningfulness and therefore suggest a high impact on the players return-to-competition process. Consequently, further research is necessary to investigate the effectiveness of conventional rehabilitation versus alternative programs targeted for athletes with the diagnosis of JK.
This study design has some limitations that should be considered when interpreting the results. For example, it would be of interest for further studies to measure knee extension torque in order to compare the results provided with recent studies measuring similar performance parameters. Furthermore, a measurement of baseline samples prior to the completion of therapy would provide a considerable amount of data to preclude any mistakes made by coaches or therapists during rehabilitation. Especially, isokinetic strength testing protocols should be added in further studies to combine sport specific tests outside of clinical settings with a more clinical evaluation of muscle strength parameters.
CONCLUSIONS
Differences in physical, psychological, and injury-/pain-related parameters in sub-elite male youth soccer players, who completed physical therapy after JK compared to HC were investigated over the course of a season. The results indicate significantly worse physical (i.e., for measures of CODS and speed) and psychological (e.g., hope for success, fear of failure) performance variables at the expense of players with previous JK, which indicate a specific significance of these components during rehabilitation and training interventions. Moreover, the higher incidence rate of non-contact lower extremity injuries, the longer periods of injury-related rest, and the higher number of pain-related training interruptions in athletes with a history of JK as in HC may be indicative of insufficient rehabilitation and/or training procedures. Thus, further research is required to determine the effectiveness of rehabilitation/training programs that counteract JK-related performance decrements accompanied with an adequate specification of the return to sport.
Conflict of interest
Marc Niering and Thomas Muehlbauer declare that they have no conflict of interest.