
INTRODUCTION
Kinesiology tape is commonly used as an intervention for a wide range of musculoskeletal conditions and for performance enhancement.1 Despite the current popularity of various brands of kinesiology tape among athletes and rehabilitation practitioners, the specific effects of kinesiology tape are unknown. Previous studies have examined the effect of kinesiology tape on muscle activity and strength, with varying results. A 2012 meta-analysis on “Kinesio tape” for the prevention and treatment of sports injuries identified 10 articles that met the inclusion criteria of including a control and reporting musculoskeletal outcome(s).2 The authors concluded kinesiology tape has trivial or inconsistent results on pain and range of motion and may have a small role in muscle activation or strength.2 A 2015 meta-analysis by Csapo et al. investigating KinesioⓇ Tape efficacy for muscle activation identified 19 studies (530 subjects) with a variety of comparisions for muscle strength.3 The researchers found that overall effects are neglible for facilitation of muscle contraction and strength and the effects were not muscle group dependent.3
Specific directional taping techniques have been popularized, proposing that the direction of kinesiology tape application alters the activation effect on the underlying muscle(s).4 Kinesiology tape applied in a proximal-to-distal direction is purported to facilitate muscle activation while kinesiology tape application from distal-to-proximal inhibits muscle contraction through changes in the “tension elements”.4 Despite these claims, proponents of this taping method have not provided a clear physiological mechanism by which tape direction influences muscle contraction. It has been speculated that taping may modify muscle activity through the stimulation of cutaneous afferents and motor unit firing.5–8
However, research exploring the relationship between kinesiology tape application techniques and muscle activity has failed to confirm the impact of application direction.5,9–11 Lee et al. tested plantar flexor strength with kinesiology tape applied on the calf from distal to proximal and proximal to distal and found no significant correlation between direction of tape application and muscle strength.12 Similarly, kinesiology tape application direction (proximal to distal to facilitate) was found to have no impact on the activation of the biceps brachii13 or wrist extensors.5
Several studies have examined the impact of kinesiology tape on the function of the quadriceps. Mostaghim et al. utilized kinesiology tape applied from proximal to distal to the middle of thigh and found a statistically significant difference in vertical jump performance.6 A previous investigation of kinesiology tape application direction to the quadriceps muscle in 36 healthy adults did not show any significant change in isokinetic knee extension torque over baseline.11 Effects of tape on the electromyographic activity of the quadriceps femoris in healthy adults also has conflicting results. Halski et al., for example, utilized kinesiology tape with tension and kinesiology tape without tension applied to the quadriceps and found no changes in resting or functional surface EMG.14 Halski et al., however, did not report the specific direction of tape application.14
Based on conflicting results and the methodological limitations of the current literature, additional studies utilizing rigorous methodology are needed to determine if the direction of tape application has an impact on muscle activation. The purpose of this double-blind crossover study was to determine if the direction of kinesiology tape application influences quadriceps activation and performance of functional tasks. This study compared taping techniques with a variety of outcome measures selected to assess quadriceps muscle activation, namely EMG recorded during isokinetic strength testing, and functional hop and jump performance.
METHODS
Research Methods
This is a double-blind crossover study. Subjects gave informed consent to participate in this study. The study was approved by the Institutional Review Board and registered on ClinicalTrials.gov (NCT02318264).
Participants
We recruited study participants via e-mail correspondence and word of mouth. Eligible participants were between the ages of 18 to 35 and naïve to the use of kinesiology tape. Exclusion criteria included musculoskeletal injury to the lower extremities (within the previous year), past surgery to the lower extremities, or known allergy to adhesive tape. All participants were screened for physical activity and exercise testing using the Physical Activity and Readiness Questionnaire (PAR-Q)15 (British Columbia Ministry of Health, British Columbia/Canada), resting vital signs, and American College of Sports Medicine guidelines for exercise testing.
Testing Procedures
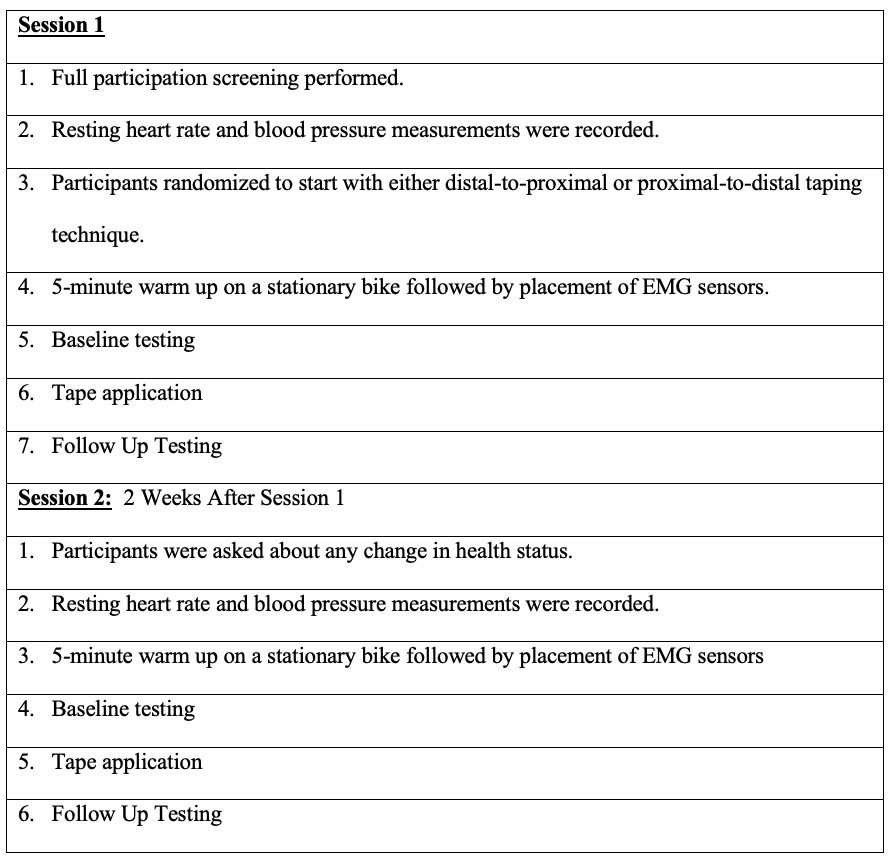
Testing was performed in a motion analysis laboratory over 2 sessions with a 2-week washout period between sessions. The first session included informed consent followed by eligibility screening. Two potential participants were ineligible due to prior knowledge or training in the use of kinesiology tape. Refer to Figure 1 for the flow of testing procedures. Leg dominance was determined during the first session by asking participants to identify their preferred leg for kicking and jumping. Testing for each session began with a 5-minute warm up on a stationary bike followed by baseline testing (functional tests and isokinetics), which occurred prior to tape application. The order of baseline testing measures and tape condition was determined initially by a research assistant via a coin toss and then alternated. This process determined if the participant began testing with functional activities (single-leg triple hop for distance followed by vertical jump) or isokinetic knee extension. After baseline testing, subjects were taped by an individual who was not involved in measurement. Participants then repeated testing under the taped condition. Testing during sessions 1 and 2 was identical with the exception of the direction of tape application. Tape application direction was alternated such that some subjects were taped distal to proximal at session 1 and other subjects taped proximal to distal at session 1, with the direction for each subject reversed during session 2.
Measurements
Single-Leg Triple Hop. Horizontal hop testing was utilized to provide a functional assessment of strength and neuromuscular control.16 Participants used their dominant leg to hop three consecutive times for maximal horizontal distance. The total hop distance was measured using a standard tape measure to the nearest 1.0 mm from the starting line to closest point of the participant’s heel. One practice trial and three testing trials were completed with a 30-second rest between each trial. Participants needed to maintain stationary contact with the ground on the dominant leg upon landing from the hop to allow for measurement of the total hop distance. A trial was repeated if the participant was unable to complete a triple hop without losing balance or contacted the ground with the opposite leg. In a previous study the single-leg triple hop for distance was reliable (test-retest) with interclass correlation coefficients of 0.92 and 0.96 for dominant and non-dominant limbs respectively.17 Munro et al. demonstrated that between session hop tests are moderately reliable 0.80 to 0.92.18
Vertical Jump. We assessed lower extremity muscular strength and power using the vertical jump.19 Participants were asked to stand with their dominant side to the wall, with his/her feet together and parallel to the wall. In standing, the participant reached overhead and marked the wall to establish his/her reach height. The participant then performed one practice jump and three test jumps, each separated by 30 seconds of rest. Instructions were to jump as high as he/she can jump. Vertical distance was measured using a standard tape measure to the nearest 1.0 mm from reach height to peak height of each vertical jump. Vertical jump tests have been demonstrated to have high validity (r=0.99, p=0.001), intra-evaluator reproducibility (r=0.99, p=0.001) and inter-evaluator reproducibility (r=1.0, p=0.001).20
Biodex Isokinetic Dynamometer. A Biodex System 3 Pro Isokinetic Dynamometer (Biodex, Shirley, NY/USA) was utilized to assess knee extension torque.21 We initialized and calibrated the Biodex before each testing session according to the manufacturer protocol. To measure mean and maximal knee extension torque, participants were positioned in the Biodex chair for hip and knee joint alignment and stabilization per the Biodex manual. Participants were tested in the seated position with the pelvic strap, thigh strap, and shoulder strap for stabilization to minimize upper body and pelvic or thigh motion during testing. The dynamometer was aligned with the anatomical axis of rotation of subjects’ knees. Biodex range of motion limits were set at the resting position (approximately 90 degrees of knee flexion) and at full knee extension. Gravity correction for limb weight was performed by the dynamometer and the software system.
Participants performed two practice repetitions for familiarization with the protocol and five test repetitions of full range concentric knee extension at 60°s-1 and 120°s-1. Standardized verbal encouragement was provided along with a countdown for the number of remaining repetitions to be completed. All dynamic torque data were filtered, windowed, and gravity corrected through the software system. Outcome measures included mean and maximum torque (Nm) and average power at 60°s-1 and 120°s-1. Test-retest data for the Biodex have shown high intraclass correlation coefficients for peak knee extension torque testing at ranging from 0.88 to 0.97 at 60°s-1 and 180°s-122 and 60 °s-1 to 300°s-1.23
Electromyography (EMG). EMG data were collected during the isokinetic testing. Participants had pairs of round self-adhesive Ag/AgCl gel surface electrodes (Cleartrace, Conmed, Utica, NY/USA), with diameter of active region = 23 mm) placed over the vastus lateralis and vastus medialis of the test limb. For the vastus medialis, the distance from the anterior superior iliac spine (ASIS) to the medial joint line was measured and two electrodes were placed on 4/5 (80%) of that line, 55 mm apart (on-center). For the vastus lateralis, the distance from the ASIS to the lateral joint line was measured and two electrodes were placed at 2/3 (66%) of that line, 55 mm apart. Reliability of quadriceps surface EMG is improved by recording from two sites per muscle. Balshaw demonstrated this approach with the quadriceps and found decreased coefficient of variations by 16-26%.24 Another Cleartrace electrode was placed over the C7 spinous process of the neck, and connected to the ground input of the EMG amplifier. The skin under all targeted electrode sites was wiped with an alcohol swab, then gently rubbed with Nu-Prep Skin Prep Gel (Weaver and Co.) applied with a cotton gauze pad.
EMG signals were amplified (gain = 1000) and filtered (2 Hz – 2.5 kHz), digitized (sampling rate: 5000 Hz; Power 1401; (Cambridge Electronic Devices [CED], Cambridge/England), displayed visually on a computer monitor, and stored for later analysis. A differential amplifier (Intronix 2024F) with a remote preamplifier (unity gain) was used. This device has an input impedance of 100 GΩ, common mode rejection >90 dB (@ 60 Hz), a signal: noise ratio >110 dB, and employs active Butterworth filters. Audio feedback of EMG to the participant was avoided. For analysis, EMG was DC-offset to zero volts. The EMG magnitude (root-mean-squared, in mV) during each contraction was quantified (Spike2; CED). This measure reflects the mean activity between cursors positioned just after the onset and prior to offset of contraction-related activity, hence is independent of a time component.
INTERVENTION (TAPE APPLICATION)
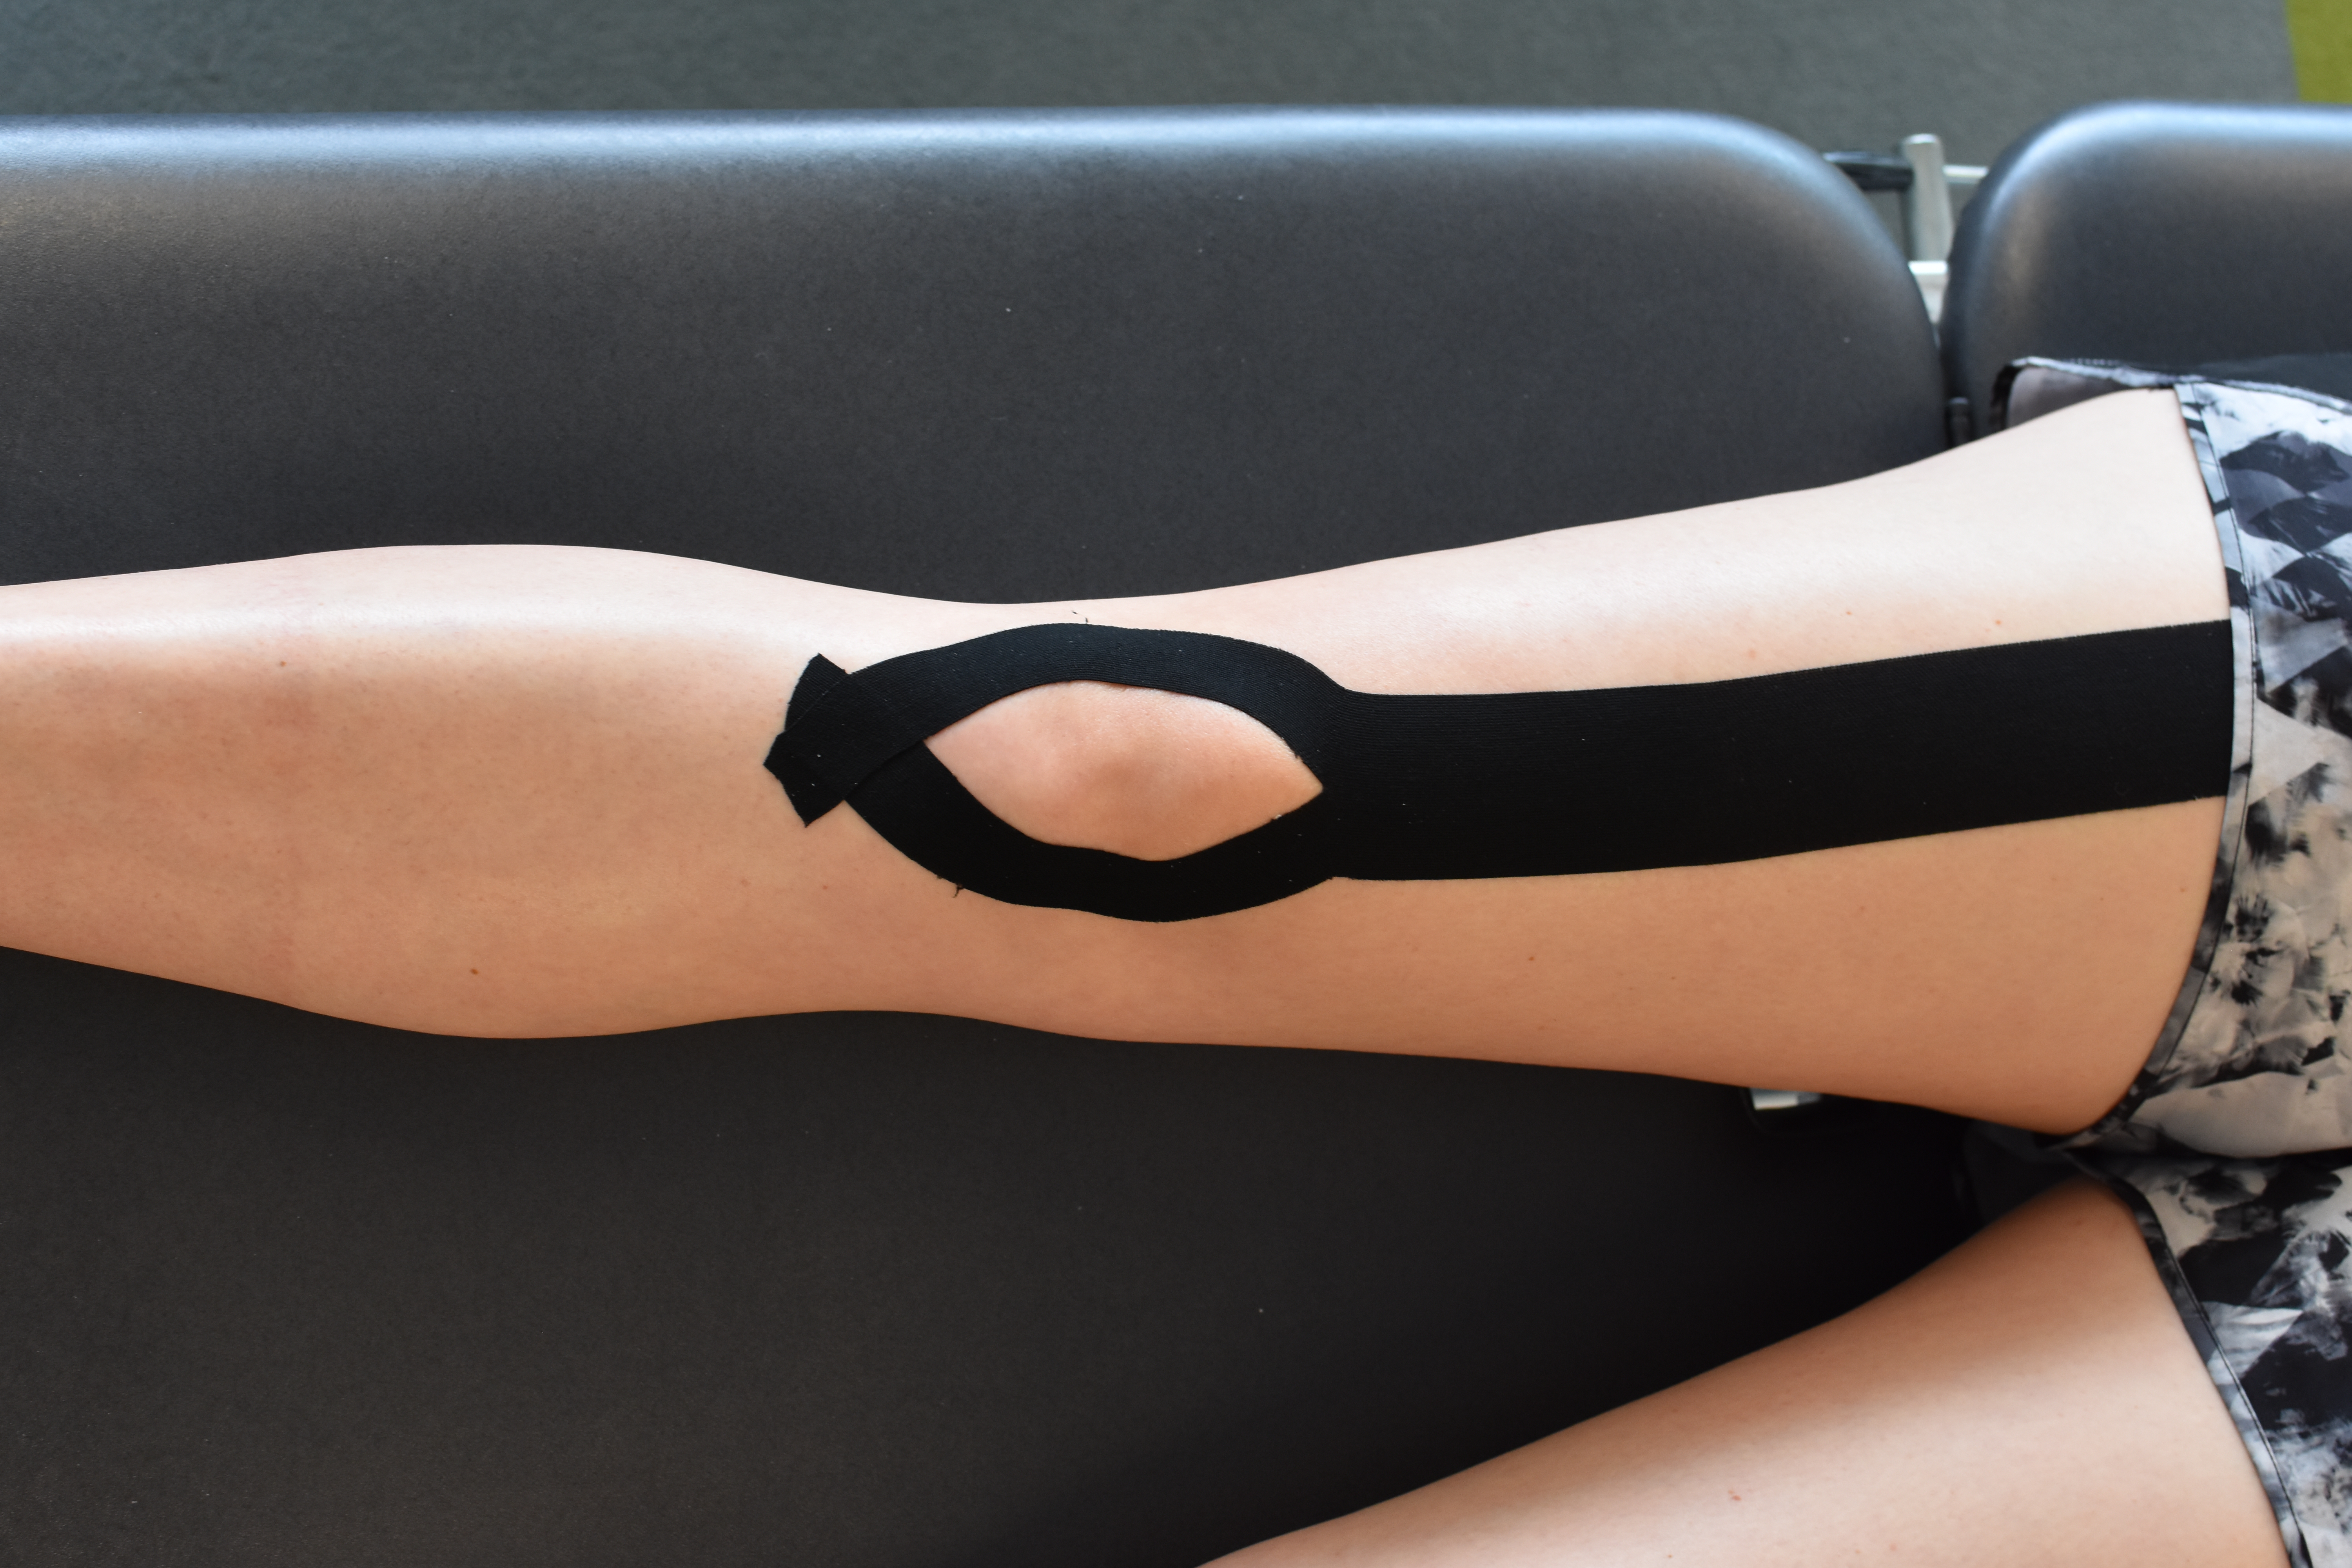
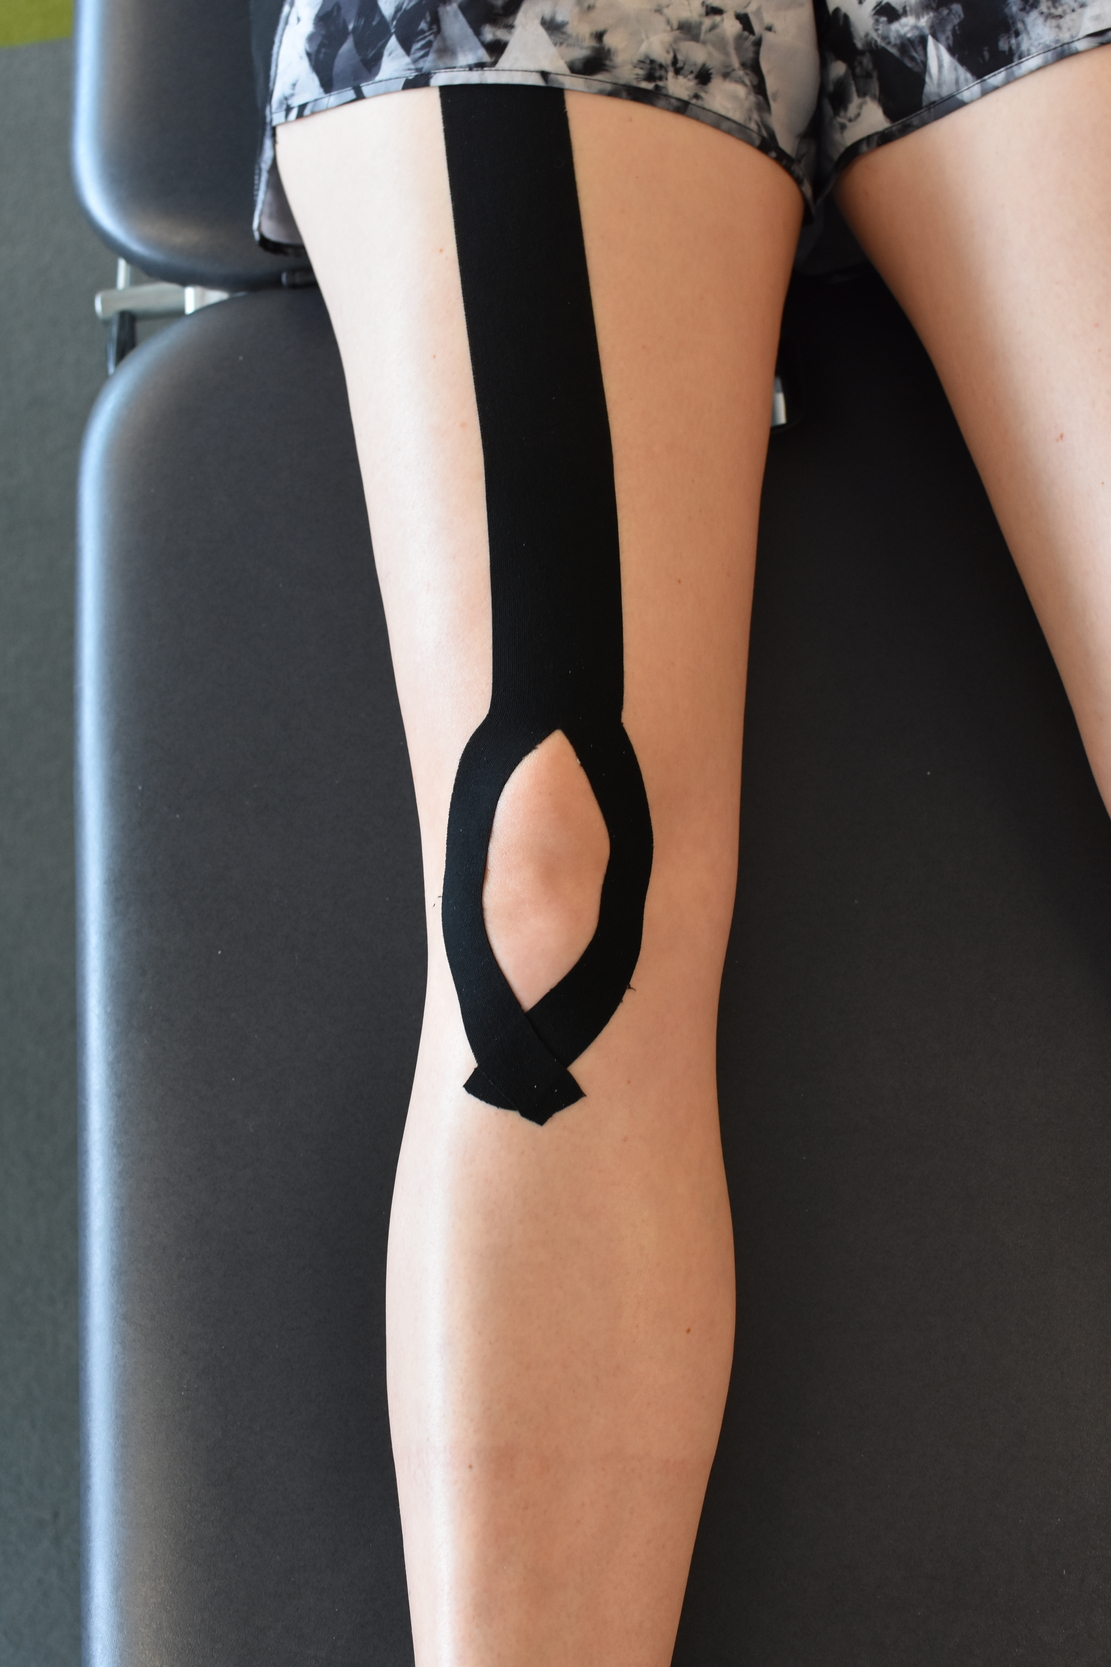
KinesioⓇ Tex GoldTM was applied by the same physical therapist (20+ years of experience) who completed Kinesio Taping Fundamentals Concepts and Advanced Concepts provided by Kinesio Taping Association International® in Syracuse, NY/USA, and had over 15 years’ experience with Kinesio Taping. The tape was applied to the dominant lower extremity of each participant using a Y-strip method.4 For the Y-strip method proximal to distal application the base of the Y cut tape was applied to the dominant quadriceps muscles from the Anterior Inferior Iliac Spine (AIIS) to just proximal to the patella. The tape split at the patella with the short tails of the Y cut wrapping around the knee medially and laterally, and meeting at the tibial tuberosity (Figure 2). For the distal to proximal application the tape was applied in the same manner but started at the tibial tuberosity and terminated at the AIIS. For each application (proximal to distal and distal to proximal) approximately 25% tension was applied to the quadriceps (therapeutic zone) and the tape was anchored with no tension on the tails of tape at either the AIIS or tibial tuberosity.4 Investigators performing EMG and functional tests were blinded to tape direction. Participants were unaware that tape direction was being tested and they were naïve to the application direction theory of elastic tape. Two different colors of tape were utilized in an attempt to distract the participant from the variation in taping direction between sessions.
STATISTICAL ANALYSIS
The same investigator performed all analyses, was blinded to the taping direction, and was not involved in testing. For each tape condition the average and peak values of multiple trials were calculated. Individual subjects’ average and peak values were pooled and described using means and standard deviations. Reliability was assessed by calculating interclass correlation coefficients (ICC) using the two baseline (no tape) conditions for each trial session.25 Minimal detectable change (MDC) for each testing condition was determined from peak values obtained during testing using the method described by Haley and Fragala-Pinkham.26 Two-way, repeated measures ANOVAs were used to assess associations between tape direction and each outcome (muscle force, EMG activity, hop and jump performance). For each analysis, factors included tape condition (tape proximal-distal v. distal-proximal) and time (baseline [no tape] v. taped condition). Thus, for each analysis the outcome of interest was a condition-by-time interaction which assessed within- and between-subject effects. Reliability analyses were performed with SPSS (SPSS version 26. IBM Corp. Armonk, NY/USA). All other analyses were performed with SAS v. 9.3 (SAS Institute, Cary, North Carolina/USA). A Bonferroni adjustment for multiple comparisons was performed by dividing .05 by the number of conditions compared (four) in each analysis. Accordingly, we set alpha = .0125 for purposes of hypothesis testing. Effect sizes for all measures were calculated for each tape direction by subtracting the mean baseline (no tape) value of each measure from the mean taped value and dividing that by the standard deviation of the baseline mean. Effect sizes were interpreted using Cohen’s criteria for standardized effect sizes.25
RESULTS
Ten females and 5 males completed the study. Mean (SD) age was 23.3 (1.8) years. Descriptive characteristics of the participants are presented in Table 1. Intraclass correlation coefficients (2,1) are displayed in Table 2. Table 3 displays mean and maximum EMG output of the medial and lateral quadriceps, for each taped direction under baseline (no tape) and taped conditions and the baseline-taped differences, at 60 and 120°s-1 knee rotation rates. Two-way, repeated measures ANOVAs resulted in no significant differences in baseline to taped condition in EMG output according to tape direction. Table 4 displays mean and maximum isokinetic quadriceps torque, for each taped direction under baseline and taped conditions and the baseline-taped differences, at 60°s-1 and 120°s-1. Two-way, repeated measures ANOVAs resulted in no significant differences in baseline-taped conditions in knee extension torque according to tape direction. Average power at 60°s-1 increased by 6.5°s-1 for the proximal to distal taped condition and decreased by 2.1°s-1 for the distal to proximal taped condition. This was at a significance level of 0.03. Due to the multiple comparisons used in this study and the subsequent risk of error rate inflation, this was not considered significant. Table 5 displays mean and maximum triple-hop distance and vertical jump height, for each taped direction under baseline and taped conditions and the baseline-taped differences with effect sizes. Two-way, repeated measures ANOVAs resulted in no significant differences in baseline-taped conditions in triple-hop distance or in vertical jump height according to tape direction. Average hop distance increased 13.7 cm for the proximal to distal taped condition and decreased 0.7 cm for the distal to proximal taped condition (p=0.0462). Maximum hop distance increased 9.4 cm for the proximal to distal taped condition and decreased 3.8 cm for the distal to proximal taped condition (p=0.0331). Effect sizes for these measures were trivial at best.
DISCUSSION
Kinesiology tape has been commonly used in clinical practice to influence muscle recruitment despite a lack of evidence to support this use. The purpose of this study was to determine if the direction of elastic tape application applied to the quadriceps influences muscle activation. Our results show that kinesiology tape application direction is not associated with significant changes in quadriceps EMG output, isokinetic performance, jump height, or hop distance.
The average single leg triple hop distance in our study increased 13.7 cm for the proximal to distal taped condition and decreased 0.7 cm for the distal to proximal taped condition (p=0.0462). This modest increase was not statistically significant, is not likely clinically meaningful, and fell well below our calculated MDC of 42 cm with trivial effect sizes. Similarly, Haitz et al. found for the single leg triple hop a standard error of measurement of 5.6 cm, and a smallest real difference of 15.5 cm.27
Our findings are consistent with previous studies of kinesiology tape application direction.7,11,28 Vercelli et al. conducted a single blinded study of kinesiology tape applied to the quadriceps utilizing three tape conditions (tape applied to enhance recruitment, to inhibit recruitment, and sham tape application).11 The study included 34 volunteers and concluded that kinesiology tape application does not influence muscle strength in healthy people based on an isokinetic maximal test of knee extension performed at 60 and 180°s-1. The researchers similarly found no significant difference in single leg triple hop for distance or a global rating of change scale used for subjective perception of strength.
Lins et al. also found that KinesioⓇ Tape applied to the quadriceps did not cause significant changes in neuromuscular performance or lower limb function.28 Their design included three groups of 20 women: No tape, Non-Elastic tape applied to the Vastus Medialis, Vastus Lateralis, and Rectus Femoris, and kinesiology tape applied P-D with 50% tension to the same muscles. There was no significant difference in EMG, concentric and eccentric peak torque, single leg hop, single leg triple hops, or single leg balance.
A 2016 randomized controlled trial by Fernandes de Jesus et al. found no difference in dynamometer measurement and single leg hop distance at 5 time-points in subjects taped with a horizontally applied placebo tape, a proximal to distally applied experimental tape, and a no tape control group.7 Researchers concluded that kinesiology tape did not improve quadriceps strength or hopping distance.7 Unlike our study, both the Lins and Fernandes de Jesus studies did not precisely follow the proposed Kinesio Taping Association International® taping method for facilitation or inhibition.4
Our results are also in alignment with a study by Cheung et al. that examined vertical jump performance utilizing a SmartjumpTM (Fusion Sport, Queensland, Australia) force pad and a “deceptive crossover” design.29 In their study, kinesiology tape was applied (Facilitative kinesiology tape, Sham kinesiology tape, and No tape) to the quadriceps and to the gastrocnemius/soleus under the guise of applying muscle sensors. Their results indicated that kinesiology tape application does not make a meaningful change in vertical jump height.
An innovative design by Poon utilized blindfolds to cover the eyes of participants while they were taped under three different conditions (No tape, kinesiology tape applied proximal to distal with 35% tape tension, and Sham kinesiology tape defined as no tension on tape).5 This study reported no statistically significant differences in isokinetic peak torque at 60 °s-1 and 90 °s-1, total work or time to peak torque.
Several studies reported that kinesiology tape application technique to the quadriceps did make a difference for muscle recruitment. A study by Mostaghim et al. tested 2 groups (no tape, kinesiology tape applied proximal to distal with 15 to 25% tension also known as “paper off” tension).6 Their taping technique was a variation of that used in the present study, as it started in the middle of the thigh instead of anchored proximally at the AIIS. They reported a statistically significant difference in vertical jump (mean difference of 0.95 cm), however, the clinical significance of this small difference is unclear. Mostaghim et al. also reported a small but statistically significant difference in maximum voluntary isometric quadriceps contraction utilizing a digital myometer but without EMG.6
Wong et al. demonstrated a shorter time to peak torque during knee extension with the tape condition (p < 0.001).30 This is in contrast to the findings by Guedes et al. in which they found no significant difference between groups with kinesiology tape applied to the quadriceps for time to reach peak torque31 Unlike the Guedes et al. study and our study, the study by Wong et al. did not include a placebo or control group.30
The results of our study are also in contrast to the work by Yeung et al. in which kinesiology tape treatment resulted in higher knee extension peak torque at 60°s-1 compared to inhibitory taping.32 The peak torque difference was small (Cohen’s d=0.26). Yeung et al. did not find a statistically significant difference under three taping conditions for EMG or patellar reflex latency.
Discrepancies in the literature may be explained by the lack of clear mechanism(s) by which tape application and specifically tape application direction may influence muscle activation. Several mechanisms have been proposed including neural effects and mechanical effects. Neural effects may occur through tactile driven facilitation of cutaneous receptors and mechanical effects may be mediated by the impact of tape on muscle length.5–8
It is possible that the mechanism may vary related to the specific population tested. Tape application direction may have less impact on individuals who are not injured or not in pain. Our participants were healthy and active young adults with no complaints of pain or recent injury. This is consistent with the meta-analysis by Csapo et al. in that kinesiology tape did not increase strength in healthy participants and work by Fu et al., who speculated that the tactile input of kinesiology tape may not be strong enough to stimulate the muscles of healthy athletes.3,8 Without a clear mechanism of action and given the consistent findings that tape direction does not have an impact on muscle function in healthy active adults, it is questionable whether continued scientific exploration of this concept is warranted.
STRENGTHS AND LIMITATIONS
Strengths of the current study include a repeated measures design and corresponding statistical analysis in which subjects acted as their own controls. This ensured that both within-subject and between-condition variability were addressed. Additionally, our study used double blinding. The practitioner applying the tape did not make observations and participants were not informed of the two different taping directions. Also, two different tape colors were utilized as a potential distractor from the taping technique. Another strength of this study was the use of a rigorous conservative statistical approach. Reliability of the triple hop distance and jump height was excellent and the reliability of isokinetic performance was very good.
There are several limitations to our study. This was a relatively small homogeneous sample of convenience. This study has limited generalizability as the participants were young, healthy adults without musculoskeletal injury. The use of a crossover design reduced the threat to internal validity resulting from the small sample, but generalizability may be limited. The study may be underpowered due to a small sample size of 15. Post-hoc power analysis for maximum hop distance change (the outcome that was closest to being significant) revealed a power of 35% given the sample size of 15 and the adjusted alpha of 0.0125. To achieve a significant difference (adjusted alpha =.0125) at an effect size of .102 (see Table 5) 34 participants would be required. Contributing to suboptimal power was the modest correlation (r =.55) of change scores between taped conditions. With a sample size of 15, the smallest difference in maximum hop distance change between the two conditions that our study could detect would be 21 mm, assuming adequate (80%) power and the adjusted alpha of .0125. A limitation related to tape color is that we did not assess the effectiveness of the subject blinding or distraction using tape color. Tape application may have been improved by the standardization of tape tension using a strain gauge. Reliability for EMG measurements was poor to fair. Despite these limitations, we feel that the repeated measures design with blinding of the participants and testers makes this study a valuable contribution to the literature on kinesiology tape.
CLINICAL IMPLICATIONS
Kinesiology tape continues to be commonly utilized by clinicians and athletes despite evidence that questions its effectiveness for muscle activation. The results of our pilot study add to the growing body of literature that suggests kinesiology tape application and specifically kinesiology tape application direction does not have a significant impact on quadriceps function. Clinicians and athletes who utilize kinesiology tape should be aware of this evidence when making decisions about if and how to utilize kinesiology tape.
Conflicts of interst
All authors declare no conflicts of interests.