
Introduction
Stress fractures (SFs) are non-traumatic incomplete fractures resulting from repetitive loading on normal bone.1 Running-related SFs account for 69% of SFs,1 and women have ≥2 times greater risk than men.2,3 In the 2018 United States National Runner Survey that included serious/competitive (19%), frequent fitness (60%), and jogger/recreational runners (21%), respondents were 54% female, and 52% of all runners were between ages 35 and 54.4 For female runners, risk factors for SFs are multifactorial. Factors associated with musculoskeletal injuries that differ in men and women include anatomy,2 body composition,2 metabolism,2 the cardiovascular system,2 hormonal status,2 and psychological status.2 Sex-specific factors of the female athlete triad5 [low energy availability,5 menstrual function,5,6 and bone mineral density5 (BMD)] are related to increased occurrence of SF in women.7 The factors related to SF are intrinsic and extrinsic. Intrinsic factors associated with SF include decreased fat mass in relation to lean tissue, nutritional deficits,1,7 hormonal issues,1,8 and decreased BMD1,7,8 and altered bone structure.2,9 Menstrual abnormalities1,5,7 and energy deficiency1,5,7 can occur due to an imbalance between nutritional intake and the amount of activity.5–7 Both pre-menopausal and post-menopausal women are at risk of SF.6,10 Some of the extrinsic factors that are associated with SF include increased training intensity, especially in a short period of time;1,11 less compliant training surfaces;1 irregular running terrain;11 a higher percentage of running on hills; and inappropriate footwear.1,11
A few studies directly evaluate women with and without a history of SFs. A systematic review and meta-analysis by Wright et al. found that being female and having a prior SF were the only predictors of SFs, which was based on only 3 studies examining sex and 3 studies examining prior injuries as factors. Several review articles discuss risk factors.1–3,6,12 Additionally, some observational13–16 and experimental studies17 report relationships between SFs and factors such as BMD, nutrition, biomechanics, and menstrual status. One observational study13 examined various self-reported factors in relation to BMD in male and female collegiate cross country runners, finding that runners who reported SF had lower than recommended calcium and vitamin D intake. They also found a higher incidence of decreased lumbar spine BMD in runners with low calcium and vitamin D intake and in female runners with insufficient caloric intake.13 Three cross-sectional studies compared runners with and without SF.14–16 Becker et al.14 compared running biomechanics between runners with and without navicular SF, finding increased rearfoot eversion and reduced forefoot abduction compared to the non-involved side and to the runners without SF. As testing was done after the SF occurred, it is not known if these differences existed prior to the SF or following it. Popp et al.15 compared bone strength and running ground reaction forces between 18-35 year old competitive female runners with and without prior SF and concluded that tibial bone strength in relation to load was less in those with prior SF.15 Korpelainen et al.16 compared BMD and various biomechanical and running factors between young athletes (61% runners) with more than 3 SFs and athletes without SF. Athletes with SF had higher arches, more leg length discrepancies, increased forefoot varus, and higher weekly mileage than athletes without SF. Approximately 40% of the women had irregular menses.16 These 3 studies together indicate that differences exist after the SF occurred but give less insight into factors that may have contributed directly to the SF. In a prospective study, Tenforde et al.,17 examined female athletes across several collegiate sports and reported that sports that emphasized leanness, including cross-country running, had more athletes within the moderate to high risk category using the Female Athlete Triad Cumulative Risk Assessment.18 They found that the relative risk of a bone stress injury increased by 4 and 5.7 times for the runners with moderate and high risk, respectively, compared to those with low risk. This study indicates that the components of the female athlete triad (low energy availability with or without disordered eating, menstrual dysfunction and low BMD) are important factors for SF risk.
In addition to the limited number of prospective studies, other limitations of the literature include small sample sizes, inclusion of only elite adolescent or young adult female runners, and mixed athlete populations. Thus, these studies are very limited in the female runners that they include. Yet SFs are not limited to women of a specific age or running ability,19,20 so there is a need to better understand factors related to SFs across a broader range of ages and running abilities to determine if similar factors may be associated with SF. Thus, the purpose of this case-control study was to identify potential risk factors between female runners with and without a history of SFs through an online survey design. The hypothesis was that there would be differences in demographics, running details, cross training, nutrition, injury history, medical/menstrual history, and medications used when comparing women with and without SF histories. A secondary purpose of the study was to identify what female runners changed, if anything, after experiencing a SF. Having a greater understanding of the various risk factors associated with SFs can guide healthcare professionals in identifying female runners who may be at increased risk for SFs.
Methods
Survey Development and Distribution
A web-based survey was developed using Qualtrics (QualtricsXM, Provo, UT). The framework for the survey was based on potential risk factors for SFs in female runners. Survey question development was based on key risk factors identified through the literature, qualitative interviews performed by the first author within another study,20 and knowledge about runners and common injuries by the six authors who are physical therapists. After the initial draft questions were written, two research data analysts with expertise in survey design and development were consulted, and the survey was modified based on their feedback to improve clarity, conciseness, and ease of completion. Following these modifications, the survey was sent to two physical therapists who regularly evaluate and treat runners and are board-certified orthopedic specialists. Further changes were made based on their advice. The survey was then piloted tested by 10 female runners who reported no difficulties or concerns with the survey.
The final survey consisted of 39 questions that focused on extrinsic and intrinsic factors for SF. Women who reported SFs received all 39 questions, while those without SFs received 34 questions. The estimated time to complete the survey as determined by Qualtrics was 9.3 minutes. All, except questions about age, height, and weight, were multiple choice, with some questions allowing one answer only and others allowing more than 1 answer. An “other” option was included, if appropriate, and participants could write in an answer when choosing this option. Questions focused on demographics, running details, cross training, nutrition, injury history, medical/menstrual history, and medications. Respondents were not asked to identify themselves as elite, competitive, or recreational runners. Instead, running pace was collected to attempt to differentiate runners’ abilities. Demographics included age, height, weight, race, level of education, and state in which participants resided. Body mass index (BMI) was later calculated using the height and weight entered. Running details requested were days per week of running, average weekly mileage within the past year during in-season and off-season training, typical running pace, years as a runner, increase in mileage per week, and shoes worn. Participants were also asked if they followed an organized running plan and who guided their running plan. For cross training, participants were asked to indicate which activities they performed. For nutrition, questions asked about self-perception of adequate caloric intake in relation to activity and self-perception about eating a healthy diet. For previous injuries, all participants were asked about previous injuries, and those with SFs received questions asking about SF details (number, location, and how long ago). Medical and menstrual history questions focused on medical issues, medications and supplements taken, age at menarche, pre/peri/post menopausal status, description of menstrual cycle, lack of menstruation for ≥ 6 months (other than pregnancy), and method of contraception, if used. For women who reported a SF, an additional question was asked to determine what, if anything, that the participant had changed following the SF.
The survey was determined to be exempt by the governing Institutional Review Board. It was distributed over a 3 month time period via social media (Facebook, Twitter, Instagram) and paid advertisement on websites frequented by female runners, with the target population being adult female runners with and without a history of SF. Participants were eligible to participate if they were a female runner, at least 18 years of age, and had or had not experienced a SF. Before entering the survey, the participant had to read the study purpose and consent by selecting to continue to agree to participation. The first 2 questions asked participants to identify as female/male/other and as a runner/non-runner, respectively. Those who chose male/other or non-runner were not provided with the remaining questions, and the survey ended. Women were able to stop at any point in the survey or not answer a question. As the survey was web-based, women self-identified as being eligible for the study.
Data Analysis
Demographics and participant responses were summarized with means and standard deviations for continuous variables and with counts and percentages for categorical variables. Age, height, weight, and BMI data were tested for normality using a Shapiro-Wilk Test. As this test showed a non-normal distribution for these measures, median values and first and third quartiles are also reported. Female runners with and without a SF history were compared using t-tests, chi-square tests, or Fisher’s exact tests as appropriate. Multivariable logistic regression models were employed to simultaneously investigate the association of multiple possible risk factors with diagnosis of SFs among the female runners. Backward selection with the Schwarz Bayesian criterion was used for model selection. All analyses were performed using SAS 9.4 (SAS Institute Inc., Cary, NC).
Results
A total of 1905 participants completed the survey. Of these, 257 were removed due to being male/other (n=16) or a non-runner (n=54), or not answering the question about having a SF or not (n=34), the question about age (n=57), any question beyond the first 5 questions that gathered minimal running data (n=96), or repeat entry from the same IP address (n=1). Thus, data from 1647 participants (ages 18-79 years) were analyzed. Of these women, 419 (25.4%) reported sustaining 1 or more SFs. Table 1 displays participant demographics. Women with SFs were younger, shorter, lighter in weight, and had lower BMIs than those without SFs. The sample was primarily white, had at least an associate’s degree, with the majority living in a suburban setting.
Days per week running, average mileage within the past year during in and off-season training, running pace, and years being a runner all had statistically significant associations with SFs (p < 0.01, Table 2). An association was also found between having a coach and using a book or website to guide training (p<0.01, Table 2). Women who cycled or swam were more likely to have had a SF (p< 0.01 for cycling, p=0.01 for swimming, Table 3), and there was an association between SFs and self-perception of not consuming enough calories for activity (p=0.04, Table 4). SF history was also associated with other injuries sustained (p<0.01 for all injuries, Table 5), with medical diagnoses of asthma (p=0.01, Table 6), osteopenia (p<0.01, Table 6), and osteoporosis (p<0.01, Table 6), and with the use of NSAIDs (p<0.01), calcium (p<0.01), probiotics (p<0.01, Table 6), and vitamin D (p<0.01, Table 6), age at menarche (p<0.01, Table 6), and going ≥ 6 months without a menstrual period (p<0.01, Table 6). The use of allergy medications was associated with not having a stress fracture (p=0.04, Table 6).
The odds of having had a SF were estimated with a multivariable logistic regression model. Table 7 shows the estimated odds ratios (OR) and the corresponding 95% confidence intervals (CI). In the multivariable logistic regression analysis, participants with missing data in some covariates were removed, and 1,550 participants’ information (94%) was used in the multivariable logistic regression model. The odds of having a SF for those with osteopenia were about four times as high as those without osteopenia (OR: 4.14). Also, the odds of a SF were higher for those who reported shin splints by more than three times compared to those without (OR: 3.24) and for those who reported tendon injuries by almost 1.5 times (OR: 1.47). Participants who run more than 20 miles per week on average during off-season training had higher odds of SFs compared with those who run 11-20 miles per week (OR: 1.77 for 21-30 miles /week, OR: 1.74 for 31-40 miles /week, OR 1.86 from 41+). Odds were also increased when a coach guided training (OR: 1.40) and for those who cycled for cross training (OR: 1.51), but less for those who hiked for cross training (OR: 0.72). For running pace, women who run 11:00-11:59 minutes/mile or slower pace were less likely to have a SF compared to those who run 9:00-9:59 minutes/mile (OR: 0.43 for 11:00-11:59 and OR: 0.54 for 12:00+). The odds of having a SF were 1.45 times higher for those who have ever gone 6 months or more without a menstrual period other than during pregnancy. Use of calcium, probiotics, and vitamin D were associated with higher odds of SFs. Use of allergy meds and Omega-3s were associated with lower odds. Greater height and urban residence were also associated with lower odds.
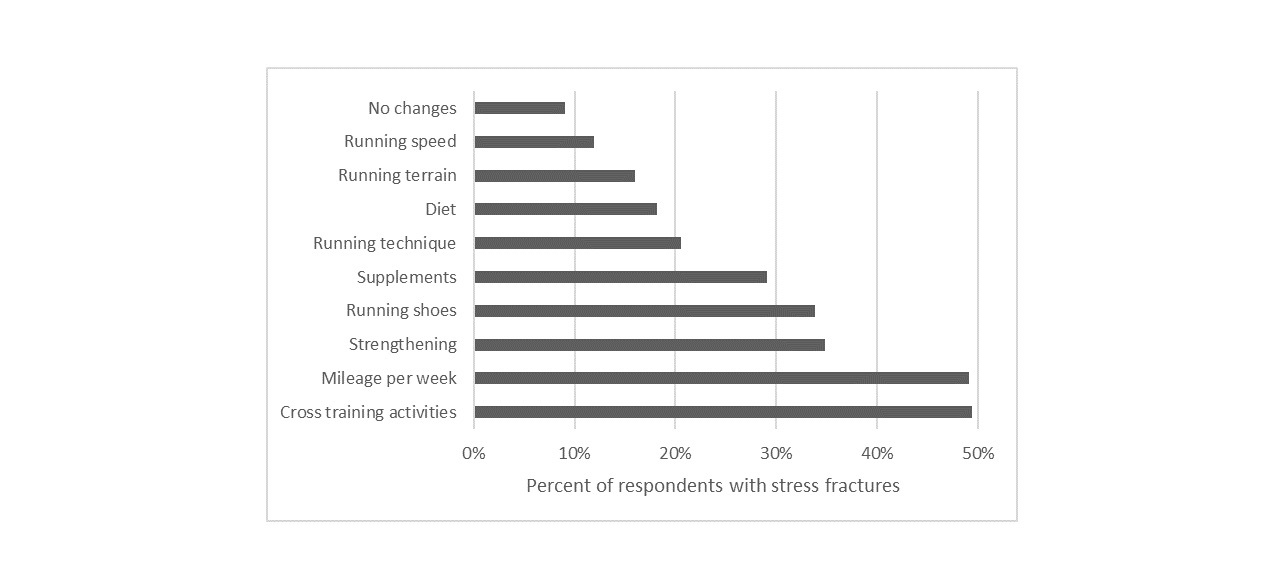
A total of 419 women reported sustaining SFs. Of these, 522 sites were reported (Table 8). However, this number likely underestimates the number of SFs as 237 women reported 1 SF, 104 reported 2 SFs, 41 reported 3 SFs, 15 women reported 4 SFs, and 22 reported ≥5 SFs. As this number indicates at least 738 SFs, some women likely fractured the same site more than once. The most common SF sites were the tibia, fibula, and metatarsals. Most women sustained the most recent SF > 1 year prior to completing the survey (n=285), with 66 sustaining SF <6 months and 67 sustaining SF 6-12 months prior. Most women (91%) reported changing or planning to change some aspects their approach to running and training following a SF (Figure 1). The most common changes were with cross training activities and with running mileage followed by strengthening, running shoes, and supplements.
Discussion
The results of this study indicate that differences exist between women with and without SF histories across many different categories of risk including demographics, running details, cross training, nutrition, injury history, medical/menstrual history, and medications. While some of these differences have been reported as possible risks in the literature as described in later sections, this study showed that these risks apply to female runners across a larger age range (18-79 years) and more diverse running profiles than typically included in other studies. Thus, this study applies to a broader population of female runners. It is important to note that the timing of this survey captured current information from participants, but information collected about the SF and items changed following a SF relied on memory. This approach to collect current data along with past SF data was chosen to minimize issues with recall bias. Several factors that were associated with having a SF could reflect post SF changes, but some of these factors still suggest increased risk.
Women with SF histories reported currently running more days/week, more miles/week, and at a faster pace, despite 12% indicating changing their running speed, and 50% their mileage/week after the SF. Thus, they are still exceeding what women without SF histories are doing with running. In a study of recurrent SFs in female and male athletes, Korpelainen et al.16 found that higher weekly mileage increased risk of another SF, and Tenforde et al.21 reported that running greater than 20 miles/week increased risk in adolescent runners, which corresponds to the findings of this study with participants of a wider age range. Thus, the >20 miles/week risk appears to apply across all women, and the increased risk of SF may be due to fatigue of the musculoskeletal system that exceeds biomechanical limits.22 For running pace, Damsted et al.23 found that the faster runners had fewer running-related injuries, which is similar to the results of this study except for those who ran <7 minutes/mile. Odds were decreased in this group, although not significantly, and the number of runners at this pace was small (n=38). Edwards et al.24 found increased peak tibial contact forces when male runners ran faster, suggesting greater risk at faster running paces. Overall, there is mixed evidence for the risk of running-related injuries based on running pace.25 Studies on the number of days/week of running in relation to running-related injury risk have mixed results with one study showing that risk is only increased for women when they run 7 days/week, while other studies show no effect of days/week running.25
Some of the other differences found between women with and without SF histories could reflect changes made following the fracture. These included having a coach but using websites for training information less often, participating in cycling and swimming, and taking calcium, vitamin D, or probiotic supplements. Following SFs, women may have chosen to hire a coach for guidance for return to running, decrease loading by adding cycling or swimming26 if not a multisport athlete already, and add supplements to improve bone health. Dietary deficiencies, including dairy, calcium, and vitamin D intake, have been shown to have negative long-term impact on BMD and body mass index in female athletes.2,13 There is some evidence that calcium and vitamin D may be helpful in SF prevention, but the literature is not conclusive.8 Screening for low vitamin D levels is recommended.8 For probiotics, there is some evidence that improved intestinal health may help to prevent or treat bone loss by regulating absorption of calcium, phosphorous, and magnesium and producing endocrine factors that signal to bone cells.27
More women with SF histories used NSAIDS compared to the non-SF group. Due to the nature of the study, it is not clear if women were taking more NSAIDs prior to the SF or as a result of it. In the final multivariable model, this association between NSAIDs and SF dropped out; however, NSAID use was strongly associated with shin splints and osteopenia, suggesting a possible role of NSAIDs in contributing to these conditions that did remain in the multivariable model. NSAID use is being studied more for positive and negative effects in runners. A survey by Tillander et al.28 found that 42% of marathon runners occasionally used NSAIDs, and there was an association between NSAID use and fewer injuries that resulted in lost time from running. Thus, runners seem to obtain some benefit from NSAIDs,28 but there is concern for SF and other bone injuries. A study by Hughes et al.29 found that NSAID prescription increased risk for SFs more than 3-fold in soldiers during periods of regular activity and more than 5-fold during periods of more heightened physical activity. These results are believed to be due to decreased bone anabolism in response to loading after taking NSAIDS, possibly due to attenuation of prostaglandin production. Bone formation stimulated by loading can reduce bone fatigue, thus bone may become more fatigued with NSAID use, increasing SF risk.29 These findings are concerning for female runners who routinely or periodically take NSAIDS for pain management. NSAIDs should also be avoided with a new SF as they can have a negative effect on bone healing.30
There are other factors that are not or likely not related to changes made after a SF. In our study, women with SF histories were younger, shorter, and lighter, and had lower BMI. The significance of being younger and shorter is unclear as there are mixed reports about these factors.31 Being lighter with lower BMI is supported in the literature due to its relevance to the female athlete triad.5,17,32 Women with SFs also reported running for more years,33 had more other injuries,5,34,35 medical diagnoses of asthma and osteopenia/osteoporosis,5 later age of menarche,33,36 and increased likelihood of going 6 months or more without a menstrual period other than during pregnancy.33,36 These findings are overall consistent with other studies of female runners with SFs. While literature does not suggest asthma as risk factor for SFs, brief courses of oral corticosteroids are often used to treat patients with asthma, which may increase risk of SF.37 For an unknown reason, women without SF histories reported taking more allergy medications.
The multivariable logistic regression analysis showed that the factors that increased the odds of having had a SF included histories of osteopenia, shin splints, and tendon injuries, running more than 20 miles/week, having a coach, participating in cycling, going 6 months or more without a menstrual period, and taking calcium, vitamin D, and probiotic supplements. Factors that decreased the odds of having had a SF included running 11 minutes/mile or slower, participating in hiking, and taking allergy medications and omega 3s. As discussed above, some of these factors could be impacted by changes made post SF while others may not be impacted. The increased odds of a SF based on prior shin splints and tendon injuries are of interest as other studies have shown relationships between SFs and prior injuries including a prior SF.34,35,38 Common tendons that are injured in runners include the Achilles, posterior tibialis, and peroneal tendons; each can impact running biomechanics.39 Pamukoff and Blackburn40 found that male runners with prior tibial SFs had increased plantar flexor musculotendinous and Achilles tendon stiffness; however, it is unknown if these changes contributed to the SF or occurred after. Although there is limited research on the incidence of SFs following other lower extremity running-related injuries, differences in running biomechanics and technique may provide some insight. In a cross-sectional study comparing women with and without prior tibial SFs, increased peak breaking vertical impact ground reaction force and peak shock were found in the women with prior SF, suggesting possible increased risk for injury.41 In this survey study, 182 of the 491 (37.1%) women with SFs reported greater than 1 SF, suggesting the importance of adequate healing and appropriate physical therapy and medical interventions with first SF diagnosis or other running-related injury.
Concerns exist for these women with SF based on the female athlete triad due to significant findings of self-reported insufficient diet for activity (low energy availability), menstrual dysfunction, and osteopenia. Similar concerns have been reported for younger female runners.17 Screening for the female athlete triad components and education on risk due to these components are therefore recommended for a broader population of female runners.
For the women who had SF histories, many changes were made, some that are supported by the literature and some that are not as far as reducing SFs or possible risks for SF. The changes that have support include cross training,26 weekly mileage,16,21 strength training,42,43 supplement use,8 running technique,42,44,45 diet,17,32,46 terrain,11,47,48 and speed.23–25 The 4th most common change was in shoe wear, which is consistently felt by runners to be important but is not supported by the literature.49,50
Based on the findings of this study, there are clinical implications for screening that may be warranted and for educating female runners about SF risks. These recommendations apply to all women regardless of age as, this study included women ages 18-79 years. It is recommended that female runners be screened for osteopenia/osteoporosis, vitamin D deficiencies, menstrual issues, and other injuries including shin splints and tendon injuries and be provided with education and recommendations to manage these issues. Questions should focus on their cross training activities, miles per week of running, years running, running pace, age at menarche, medications, diet, supplement use, and NSAID use.. Education is needed on possible SF risk for all women, such as limiting running to less than 20 miles/week if possible, decreasing or stopping NSAID use, obtaining sufficient dietary intake for activity, and appropriately managing any running-related injury especially shin splints and tendon injuries. Based on this study, risk is not increased based on days per week running or running pace, but these may still be considered. Screening and education may be even more critical for female runners after sustaining a first SF to decrease risk. Thus, health professionals should be more proactive with these women to hopefully prevent future SFs and allow women to remain active as runners.
There are several limitations to this study. The survey design only allows for associations and odds ratios to be determined. Thus, no causation can be inferred. Prospective studies are needed to determine causation. In this study, women self-identified as being eligible for the study and as the survey was internet based, it was not possible to limit who was taking the survey or to confirm the identity of respondents. A response rate is also unable to be determined based on the recruitment methods used. The sample was primarily white and well-educated with the majority living in a suburban setting. The survey was self-report and women could skip questions. Despite these limitations, the survey was completed by women of many different ages and running abilities, of whom 25.4% had sustained SFs. Future research should include prospective studies to determine if screening, education, and intervention can prevent a first or subsequent SF in female runners.
Conflicts of Interest
The authors declare no conflicts of interest.
Acknowledgements
The study was funded by the Office of the Provost, Thomas Jefferson University. We would like to acknowledge the following people for their assistance with this study: Brian Eckenrode, PT, DPT, OCS, Associate Professor, Arcadia University, Department of Physical Therapy; Robert Maschi, PT, DPT, OCS, CSCS, Associate Clinical Professor, Drexel University, Department of Physical Therapy and Rehabilitation Sciences; Momo Nakagawa, Research Data Analyst, Thomas Jefferson University: John Guarnieri, Senior Research Data Analyst, Thomas Jefferson University.