

Introduction
Anterior cruciate ligament (ACL) injuries can be broadly divided into two types: contact, which involves physical contact, and non-contact, which does not involve physical contact with another person. Non-contact types account for approximately 70–80% of all ACL injuries,1 and they often occur with motions that induce a change in direction,2 sudden deceleration,1 and jump landings.1 Non-contact ACL injuries are more likely to occur when there is slight flexion and valgus of the knee joint with internal rotation of the tibia.3 ACL injuries occur 17–50 msec after landing4 and have shown to be associated with an increase in the ground reaction force (GRF), valgus knee angle, and torque within 40 msec of landing.5 Moreover, ACL injuries occur when individuals land with the rearfoot or soles horizontal to the ground during deceleration.6
The knee valgus angle — a risk factor for non-contact ACL injury — increases when the change-in-direction angle increases,7 during internally rotated foot landing positions,8 when the vertical component of the GRF increases,9 and with greater levels of quadriceps activity.1 Several studies have examined cutting motions in the diagonal-forward direction.7,8,10 With large changes in direction, such as 180° turns, the direction of movement of the center of gravity is reversed during the deceleration and acceleration phases. In fact, a 180˚ turn produces a high risk of injury, similar to a 45˚ cut, if performed at the same approach velocity. Scheurs et al.7 found similarities in knee abduction moments between 90˚ and 180˚ turns; however, these joint loads were greater than those produced by 45˚ cuts, while Cortes et al.11 found greater joint loading with 180˚ turns compared to 45˚ cuts. Moreover, there are only a few studies that have examined this issue. In particular, few studies have examined 180° turns in detail, and differences in how foot landing methods affect joint angles, GRFs, and muscle activity have been poorly investigated. Yoshida et al. reported that the forefoot strike (FFS) is less likely to damage the ACL than the rearfoot strike (RFS) during a 60° cutting motion.12 Similarly, Donnelly also reported that a RF fall pattern during unplanned sidestepping places a large mechanical demand on the knee joint, which is associated with an elevated ACL injury risk.13 This study aimed to determine the joint angles, ground reaction force (GRF), and muscle activity levels associated with FFS and RFS landings during 180° turns. Therefore, the authors hypothesize that the FFS reduces the stress on the knee compared with the RFS even during a 180° turn.
Methods
Design
This cross-sectional study was approved by the Teikyo. Heisei University Ethical Committee (task number 29-022). All procedures were performed in accordance with the Declaration of Helsinki.
Participants
Participants included 14 male soccer players who were members of the university football club (mean height, 169.3 ± 5.4 cm; weight, 66.3 ± 4.6 kg; age, 20.8 ± 1.0 years). Players were excluded if they had any injury-related pain or disorder and a history of ACL injury, lower-limb surgery, or severe locomotive organ disease within the prior three months. Each participant provided written or oral consent after receiving a thorough explanation of the study.
Procedures
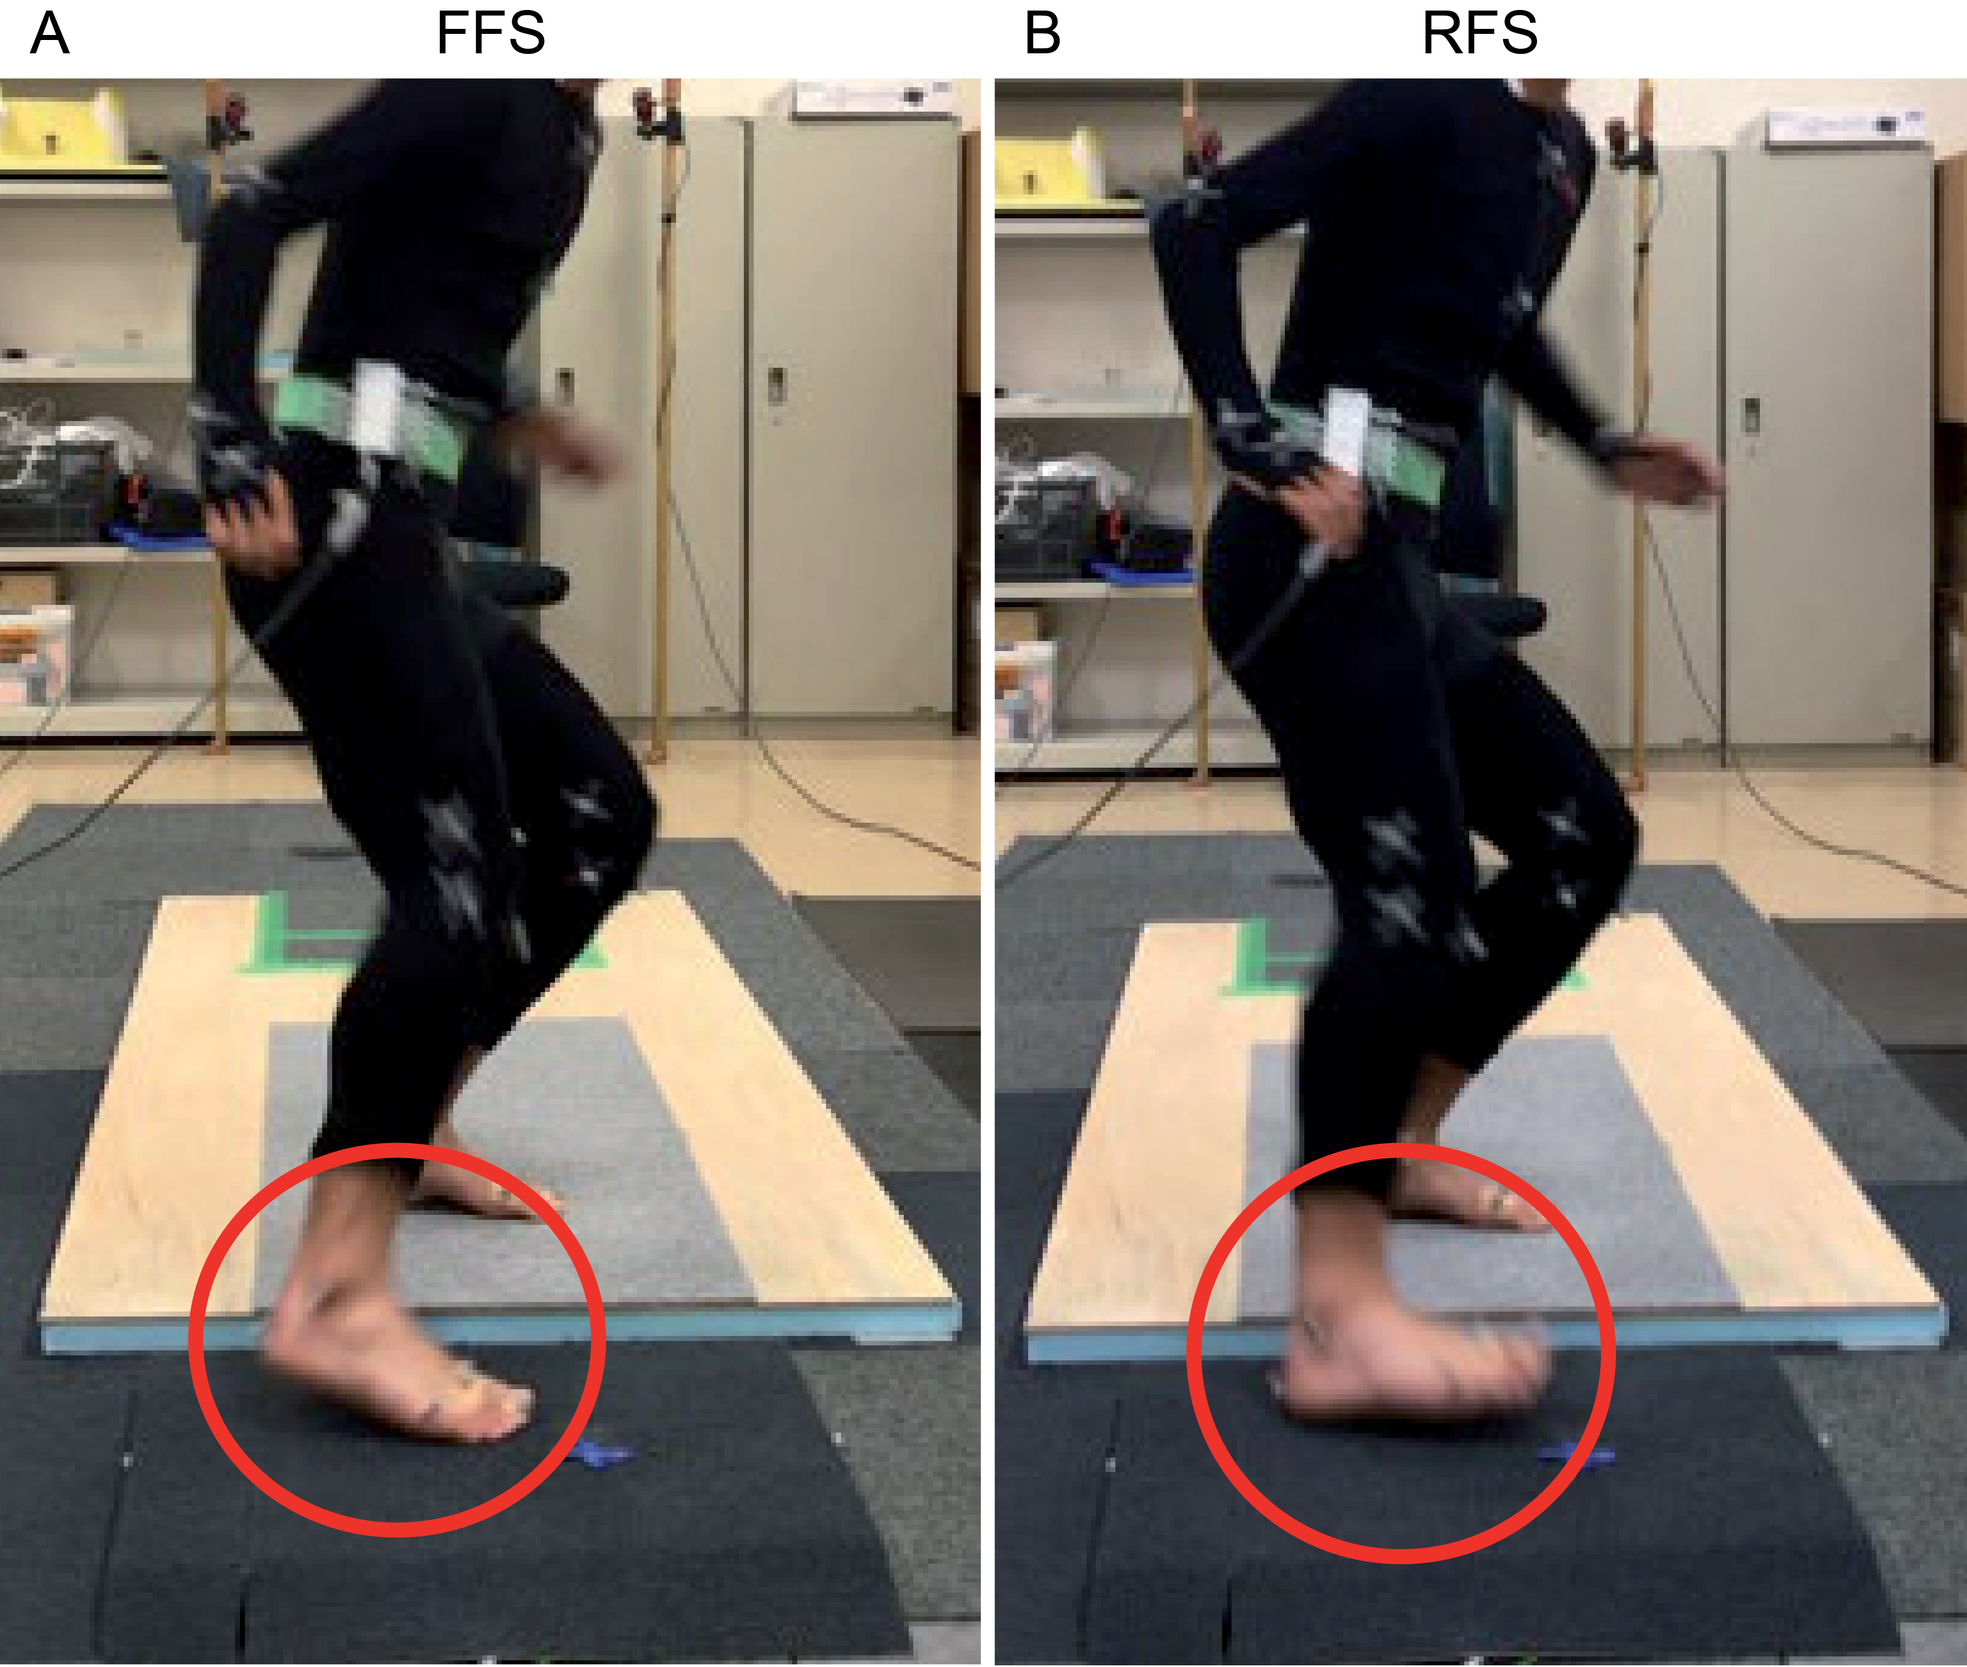
The task motion began with the participants standing in the anatomical position with their hip and knee joints slightly flexed and the right leg pulled one foot-length back. Three steps were taken to reach a force platform, approximately 150 cm away. During landing, the right foot was uniformly placed approximately 90° in the progress direction to perform a 180° turn (Figure 1). Landing was performed with an FFS, in which the anterior portion of the foot strikes the platform first, and also in a RFS, in which the posterior portion of the foot strikes the platform first (Figure 2). In other words, the FFS consisted of initial contact with the toes on the force plates followed by the rearfoot; meanwhile, the initial contact of RFS was performed with the heels on the force plates followed by the forefoot like the methods of Cortes.11 The participants performed the FFS and RFS, in that order, three times each after being allowed to practice the motions until they were accustomed to them. Failed attempts, described as a landing that was not performed according to the prescribed conditions, were confirmed by foot markers and were discarded.

The participants wore suitable sized motion capture suits, which are suitable clothing for the markers to be placed on the body, with 49 markers attached to the body surface (Appendix 1). The measurements were performed using 12 infrared cameras (OptiTrack, Acuity Inc., Tokyo) and a three-dimensional motion tracking system (Motive Tracker, OptiTrack). The 12 infrared cameras were placed around the force platform to surround the participants while performing each task. Calibration was performed to determine each camera’s relative position and the origin and axes of the fixed coordinate system. A calibration wand (CW-500, OptiTrack) was used to obtain a high-quality level of calibration precision. The origin and axes of the fixed coordinate system were determined using a calibration square (CS-100, OptiTrack), which was placed in the right anterior corner of the force platform from the participants’ viewpoint. The right anterior corner of the force platform was the origin. The Z-axis was vertical to the platform (+), the X-axis was toward the left (+), and the Y-axis was in the posterior direction (+) (right-handed coordinate system). During the task motion, each marker’s coordinates were measured using a sampling frequency of 100 Hz and were then used to calculate the angles of the ankle, knee, and hip using a motion analysis system (Frame-DIASV system, DKH, Tokyo Japan).
The myoelectric potential of the lower extremity musculature was measured using surface electromyography (K800, Biometrics, Newport, UK). Electromyography amplifiers (SX230-1000, Biometrics; inter-electrode distance: 2 cm), which function as combined surface electrodes and amplifiers, were placed parallel to the direction of the muscle fibers and fixed from above with elastic tape. A grounding electrode was placed on the left wrist. The induced myoelectric potentials were A/D converted at a 1,000-Hz sampling frequency and saved on a personal computer using the TRAIS system, a data capturing and general-purpose analysis program. Activities of the following muscles were evaluated: gluteus medius (GM), rectus femoris (RF), vastus medialis (VM), vastus lateralis (VL), semitendinosus (ST), biceps femoris (BF), lateral head of the gastrocnemius (GL), and tibialis anterior (TA). Before the task, 5-s data of maximum voluntary isometric contraction (MVIC) for each muscle against manual resistance was measured three times. The greatest value achieved was used as the MVIC in this study. The tasks were performed three times each in the FFS and RFS conditions. The acquired myoelectric potentials were filtered using a band-pass filter (at 20 and 400 Hz), and subsequently, a full-wave was rectified. The maximum values of the 3 timed MVICs were averaged, and the myoelectric potentials measured during the tasks were divided by the MVIC to obtain the %MVIC.
Vertical (Z-axis) and anterior-posterior (Y-axis: corresponding to the X-axis on the motion analysis coordination system) components of the GRF values during the task motion were measured using a force platform (9286BA, Kistler, Kanagawa, Japan) at a 1,000-Hz sampling frequency and saved on a personal computer using the TRAIS system. Participants’ GRF values were standardized by dividing them by the body weight. The data were filtered using a low-pass filter at 6 Hz. The point of ground initial contact (IC) was obtained when the vertical component of the GRF reached 10 N. The point at which the GRF was 10 N or less was defined as take-off. The anterior/posterior component and the lateral component of the GRF were determined by the direction of the body in the landing position. In other words, a starting position to the left was considered to be the same as the forward landing position.
In this study, the joint angle, muscle activity, and GRF values during the FFS and RFS tasks were normalized by the stance phase. The stance phase was defined as that from the IC (0%) to the foot-off (100%) phase. Reports indicate that ACL damage occurs 40 msec after the IC landing,5 and the ACL is most loaded at 160 msec.8 This study, therefore, defined the early phase as up to 50% from the IC landing.
Statistical analyses
The variables exhibited a normal distribution. To compare RFS and FFS landings, a curve analysis of the data for GRFs, kinematics, and muscle activity was performed using a one-dimensional statistical parametric mapping (SPM) two-tailed paired t-test.14 The statistical analysis of these parameters was performed using MATLAB (version R2019b; Mathworks Inc, Natick, USA). The significance level was set at p <0.05.
Results
The vertical component of the GRF was significantly larger from 9–20% and at 99% with the RFS compared to the FFS (p<0.05) (Figure 3a). The posterior component of the GRF was significantly larger from the IC to 16% and from 92–100% with the FFS compared to the RFS (p<0.05) (Figure 3b). The anterior component of the GRF was significantly larger, from 72–81% with the FFS compared to the RFS (p<0.05).
.jpg)
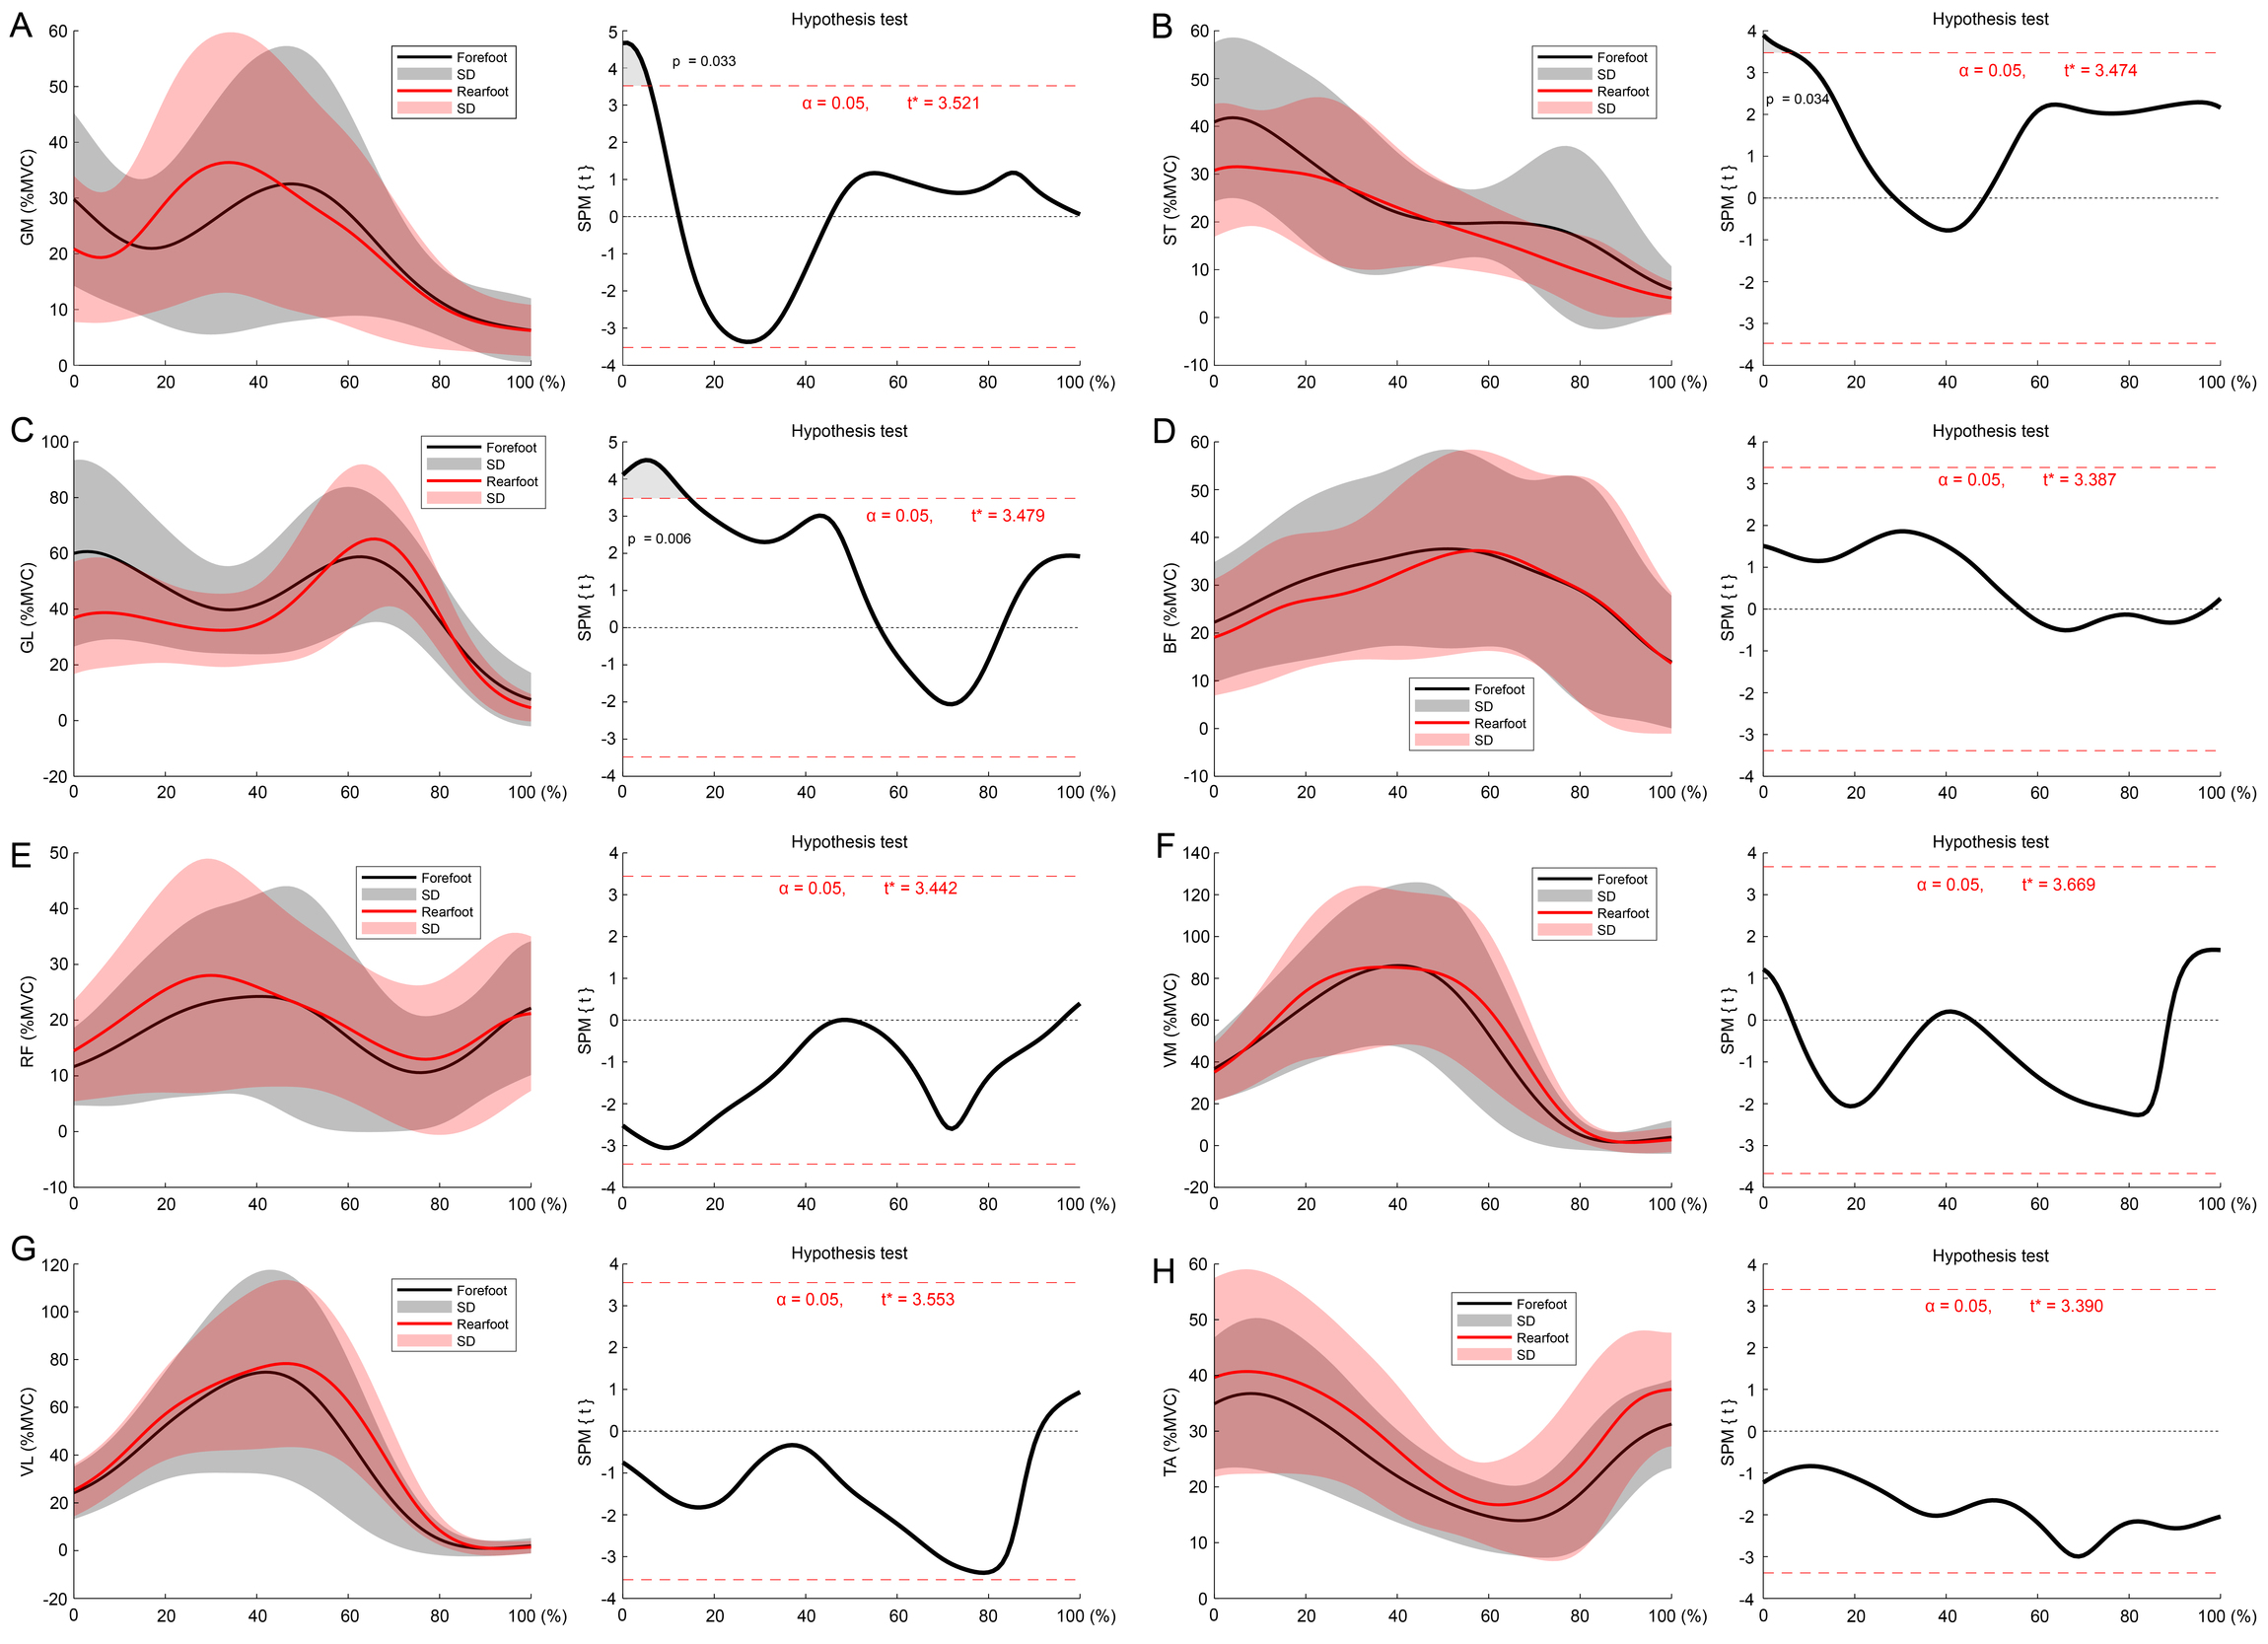
GM activity was significantly larger with the FFS than with the RFS from IC to 5% (p<0.05) (Figure 4a). ST activity was significantly larger with the FFS than with the RFS from IC to 5% (p<0.05) (Figure 4b). GL activity was significantly larger with the FFS than with the RFS from IC to 14% (p<0.05) (Figure 4c). There were no significant differences in the activity of the other muscles between the FFS and RFS (Figure 4 d-h).
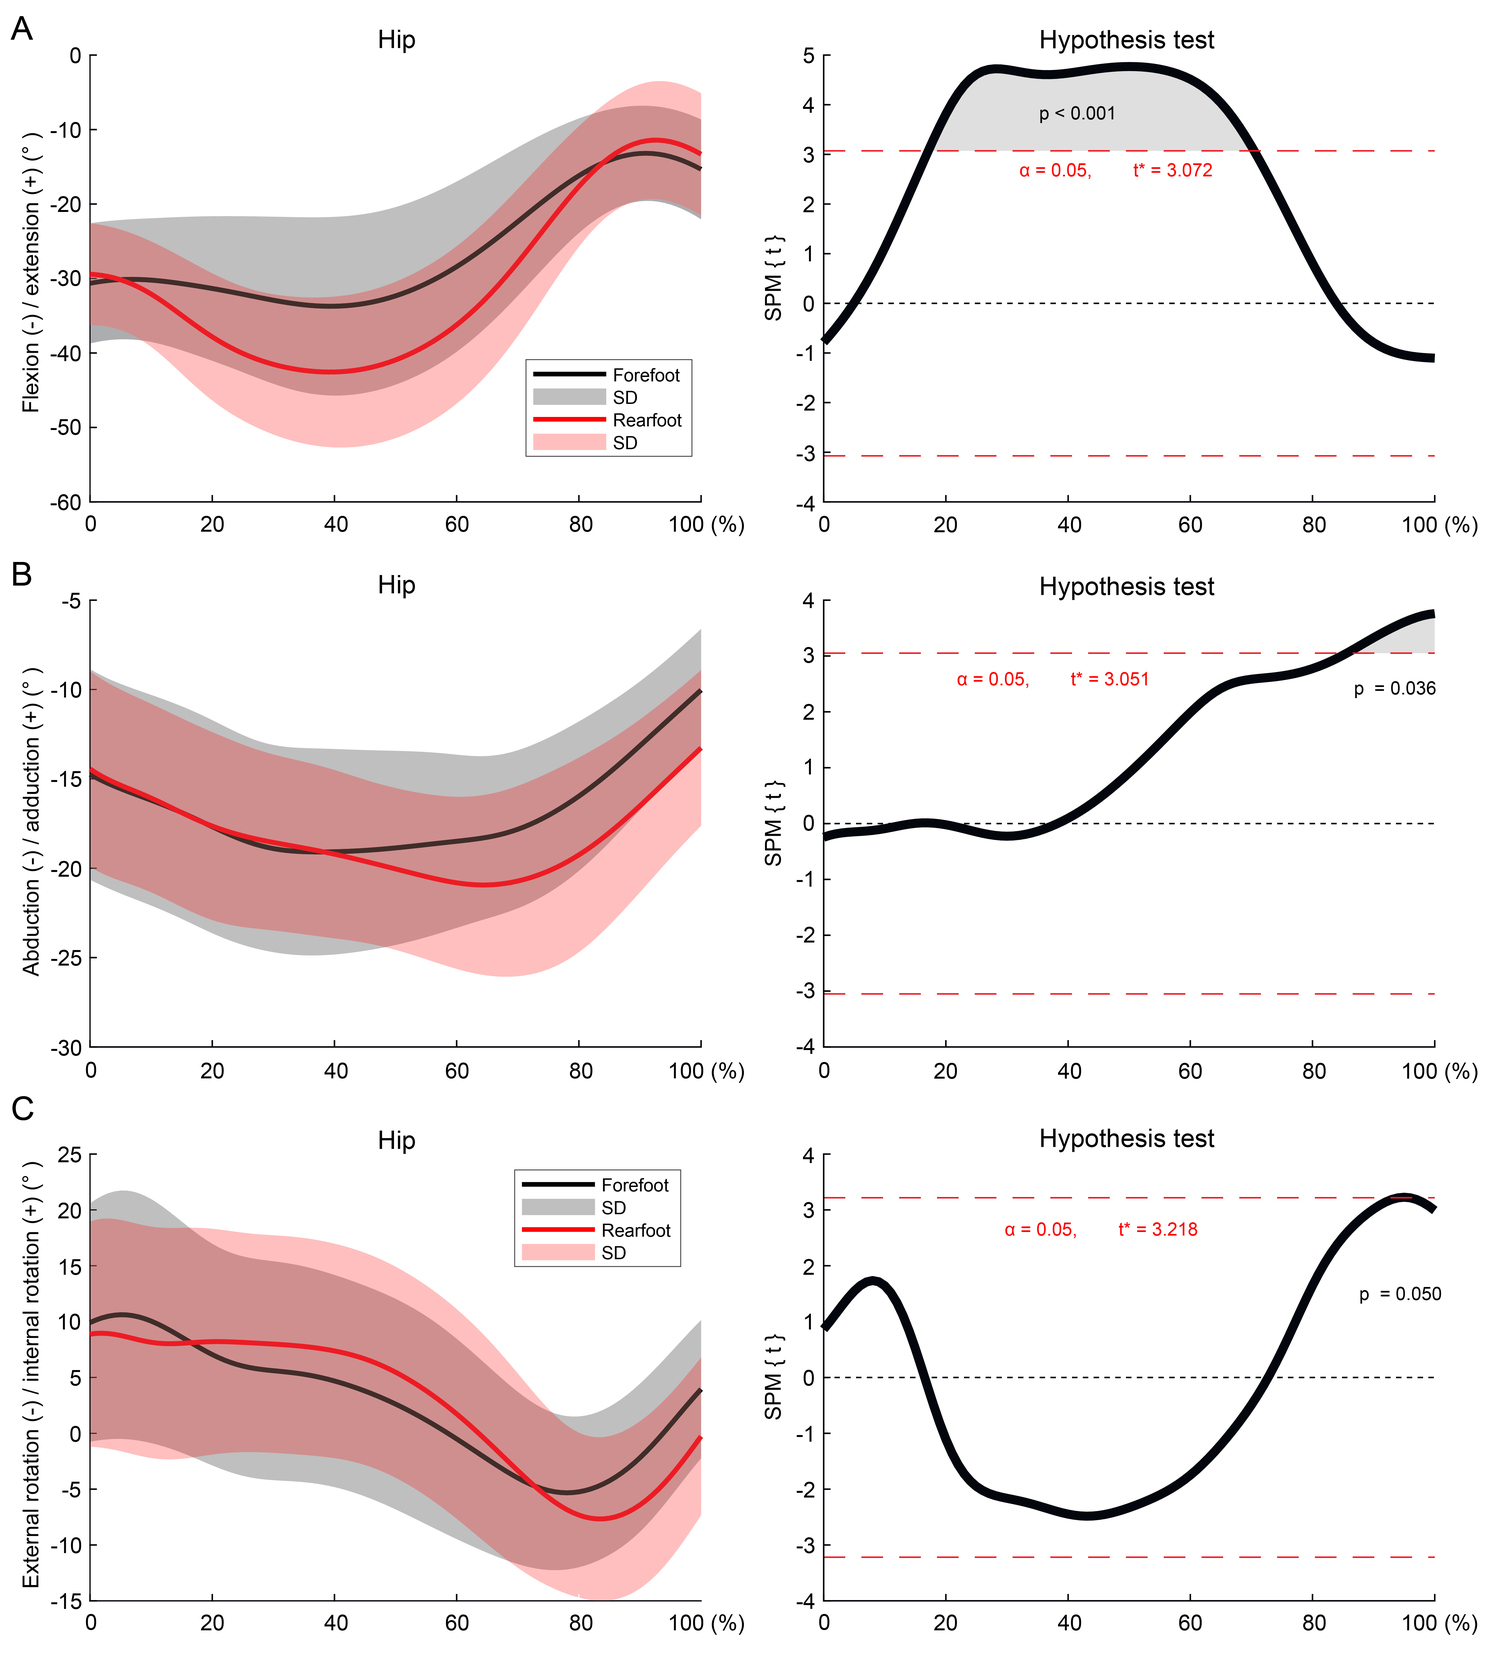
The hip flexion angle was significantly larger from 18–70% with the RFS compared to the FFS (p<0.05) (Figure 5a). The hip abduction angle was significantly larger from 86–100% with the RFS compared to the FFS (p<0.05) (Figure 5b). The hip external rotation was significantly larger at 95% with the RFS compared to the FFS (p<0.05) (Figure 5c).
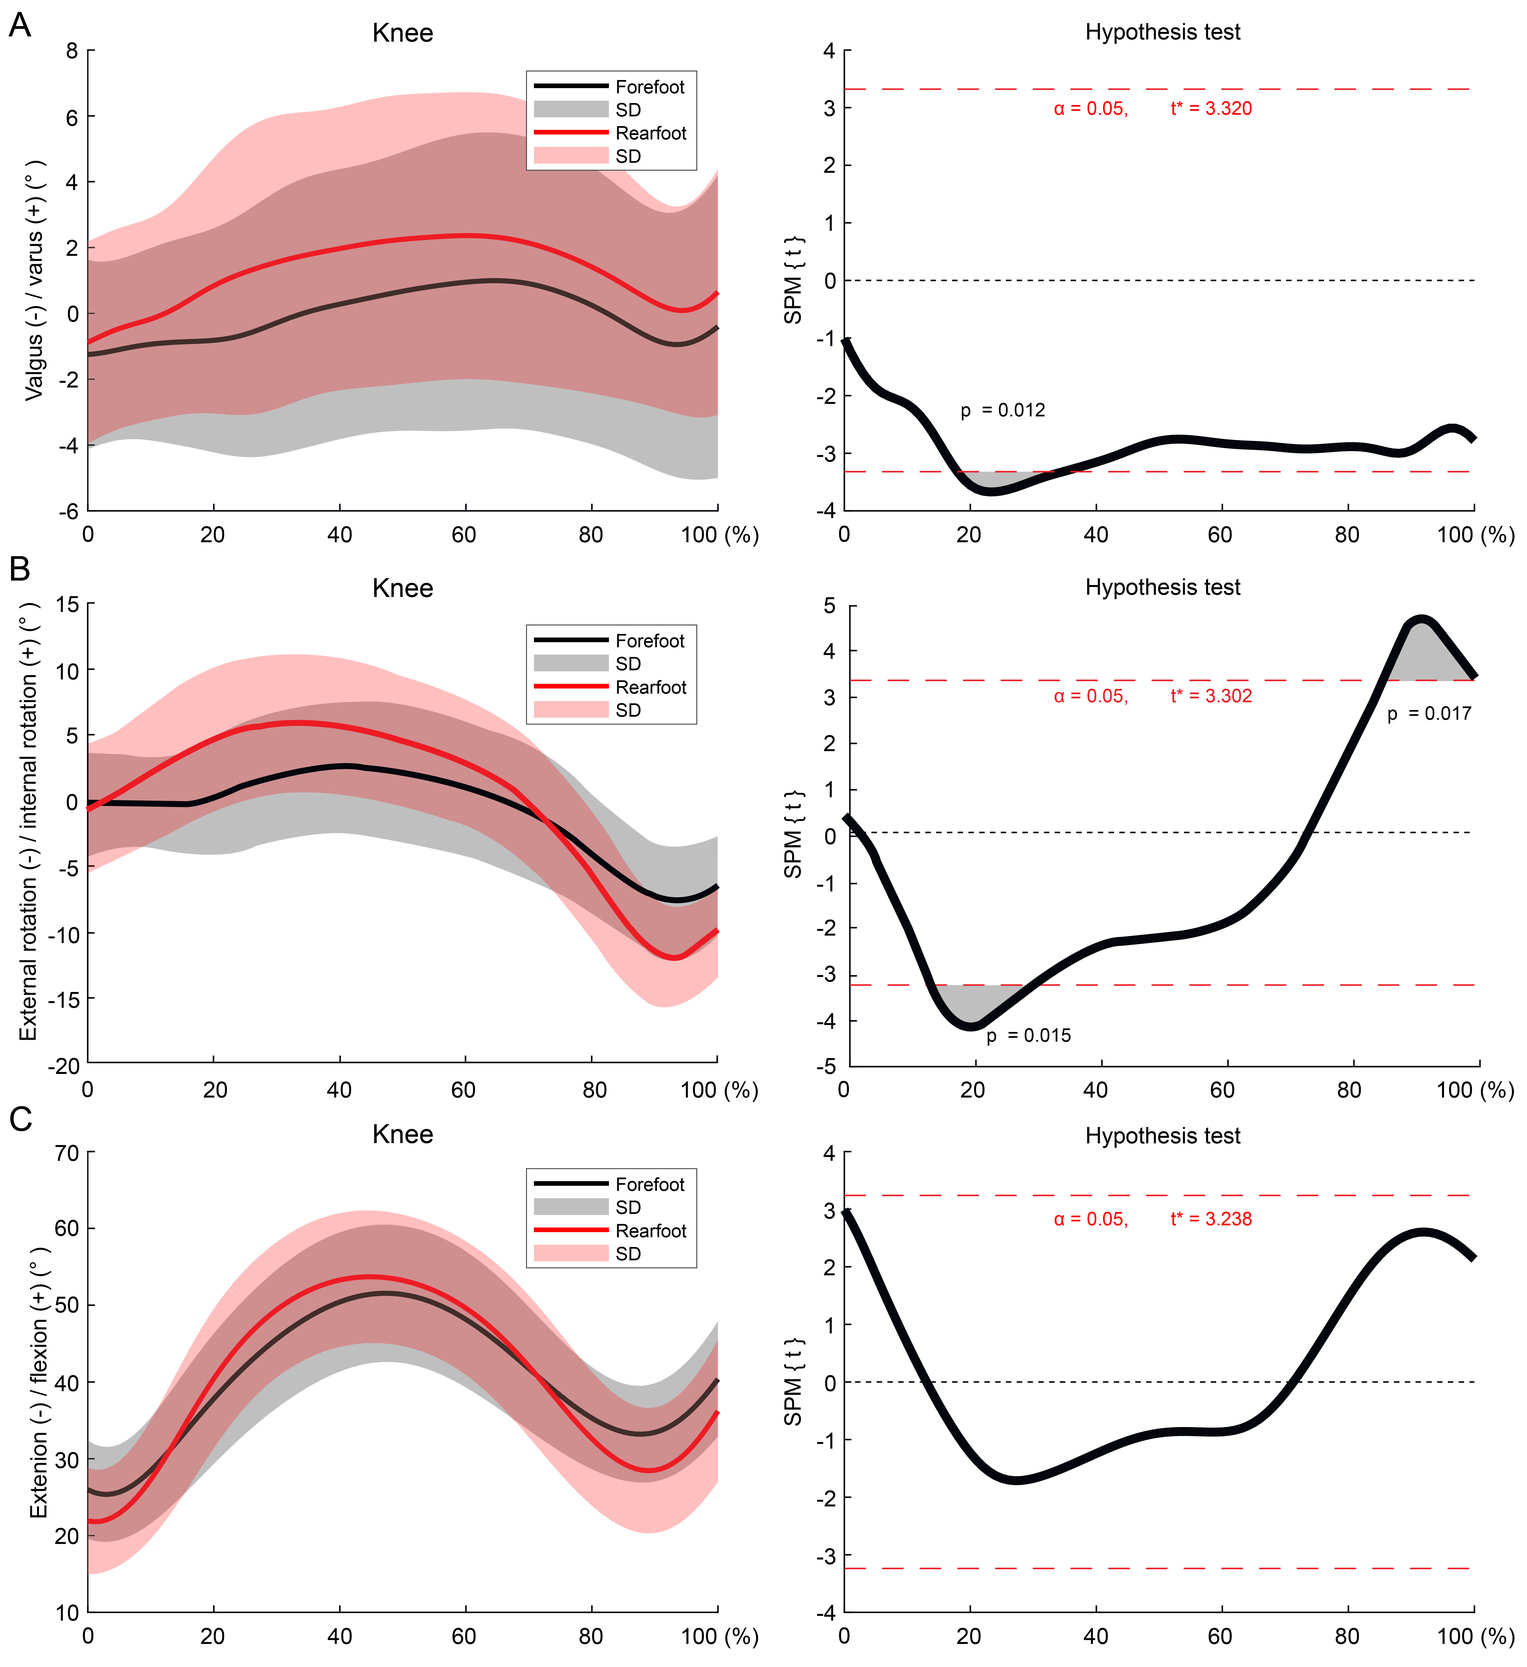
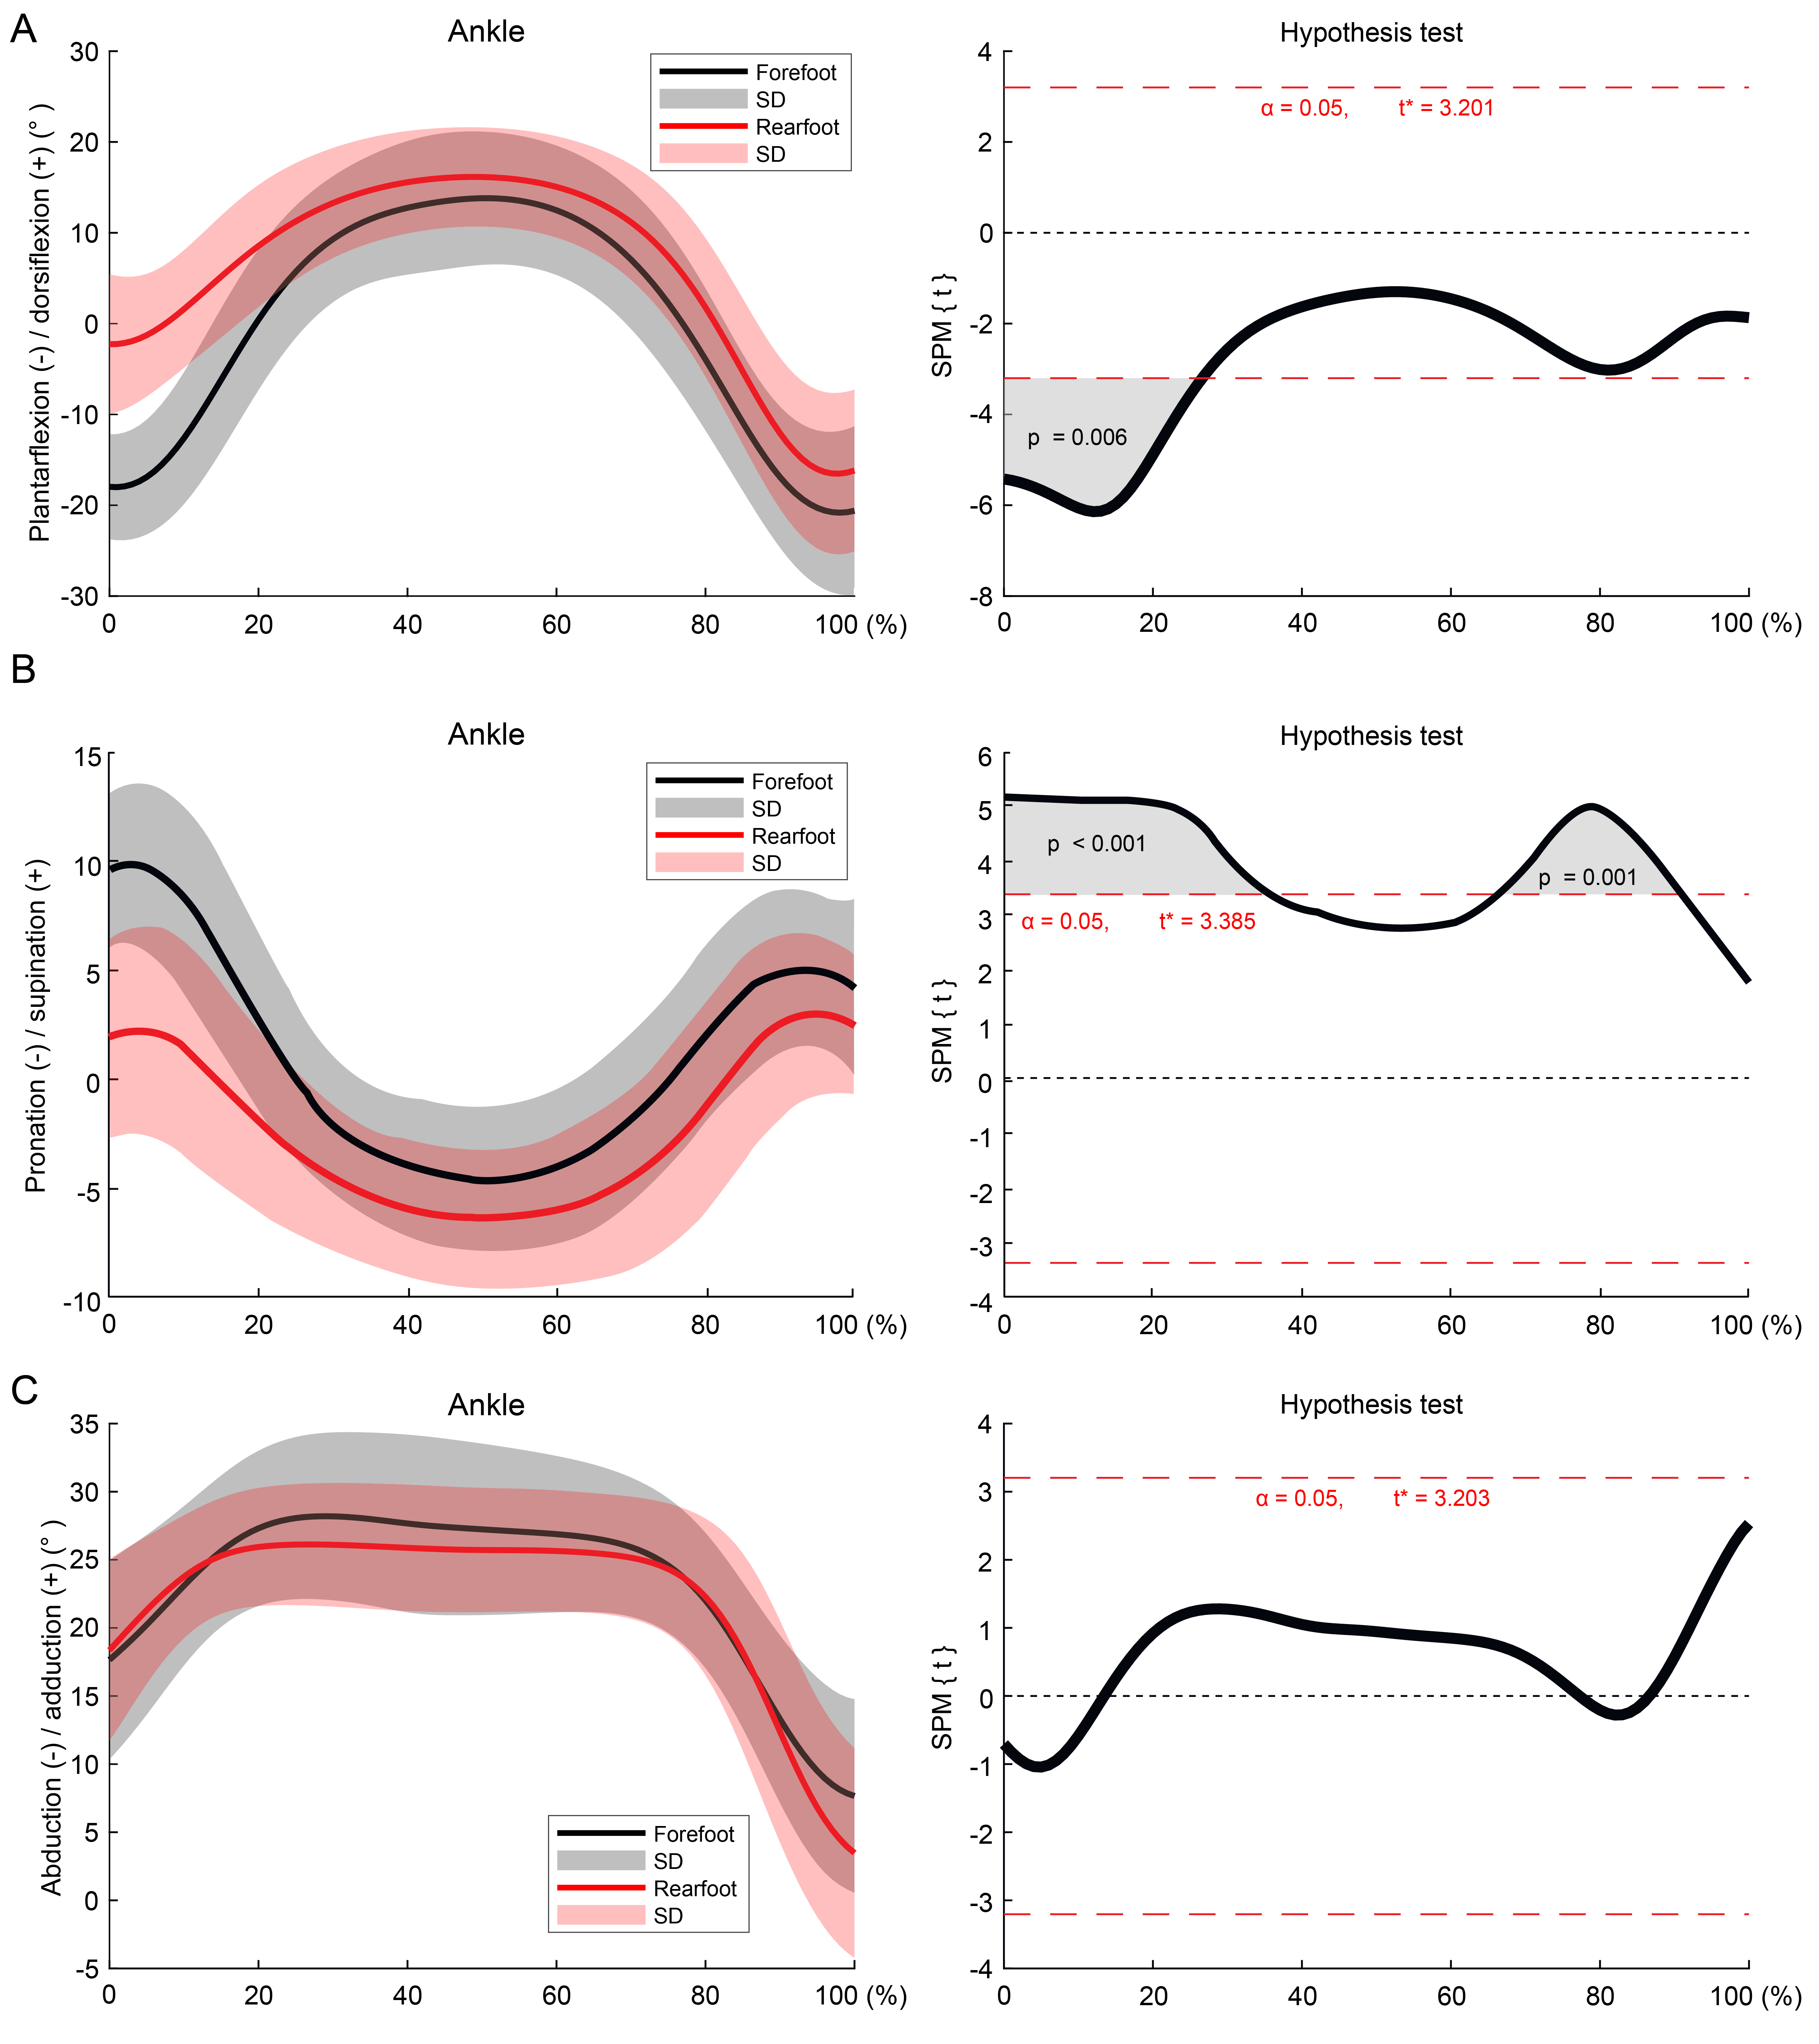
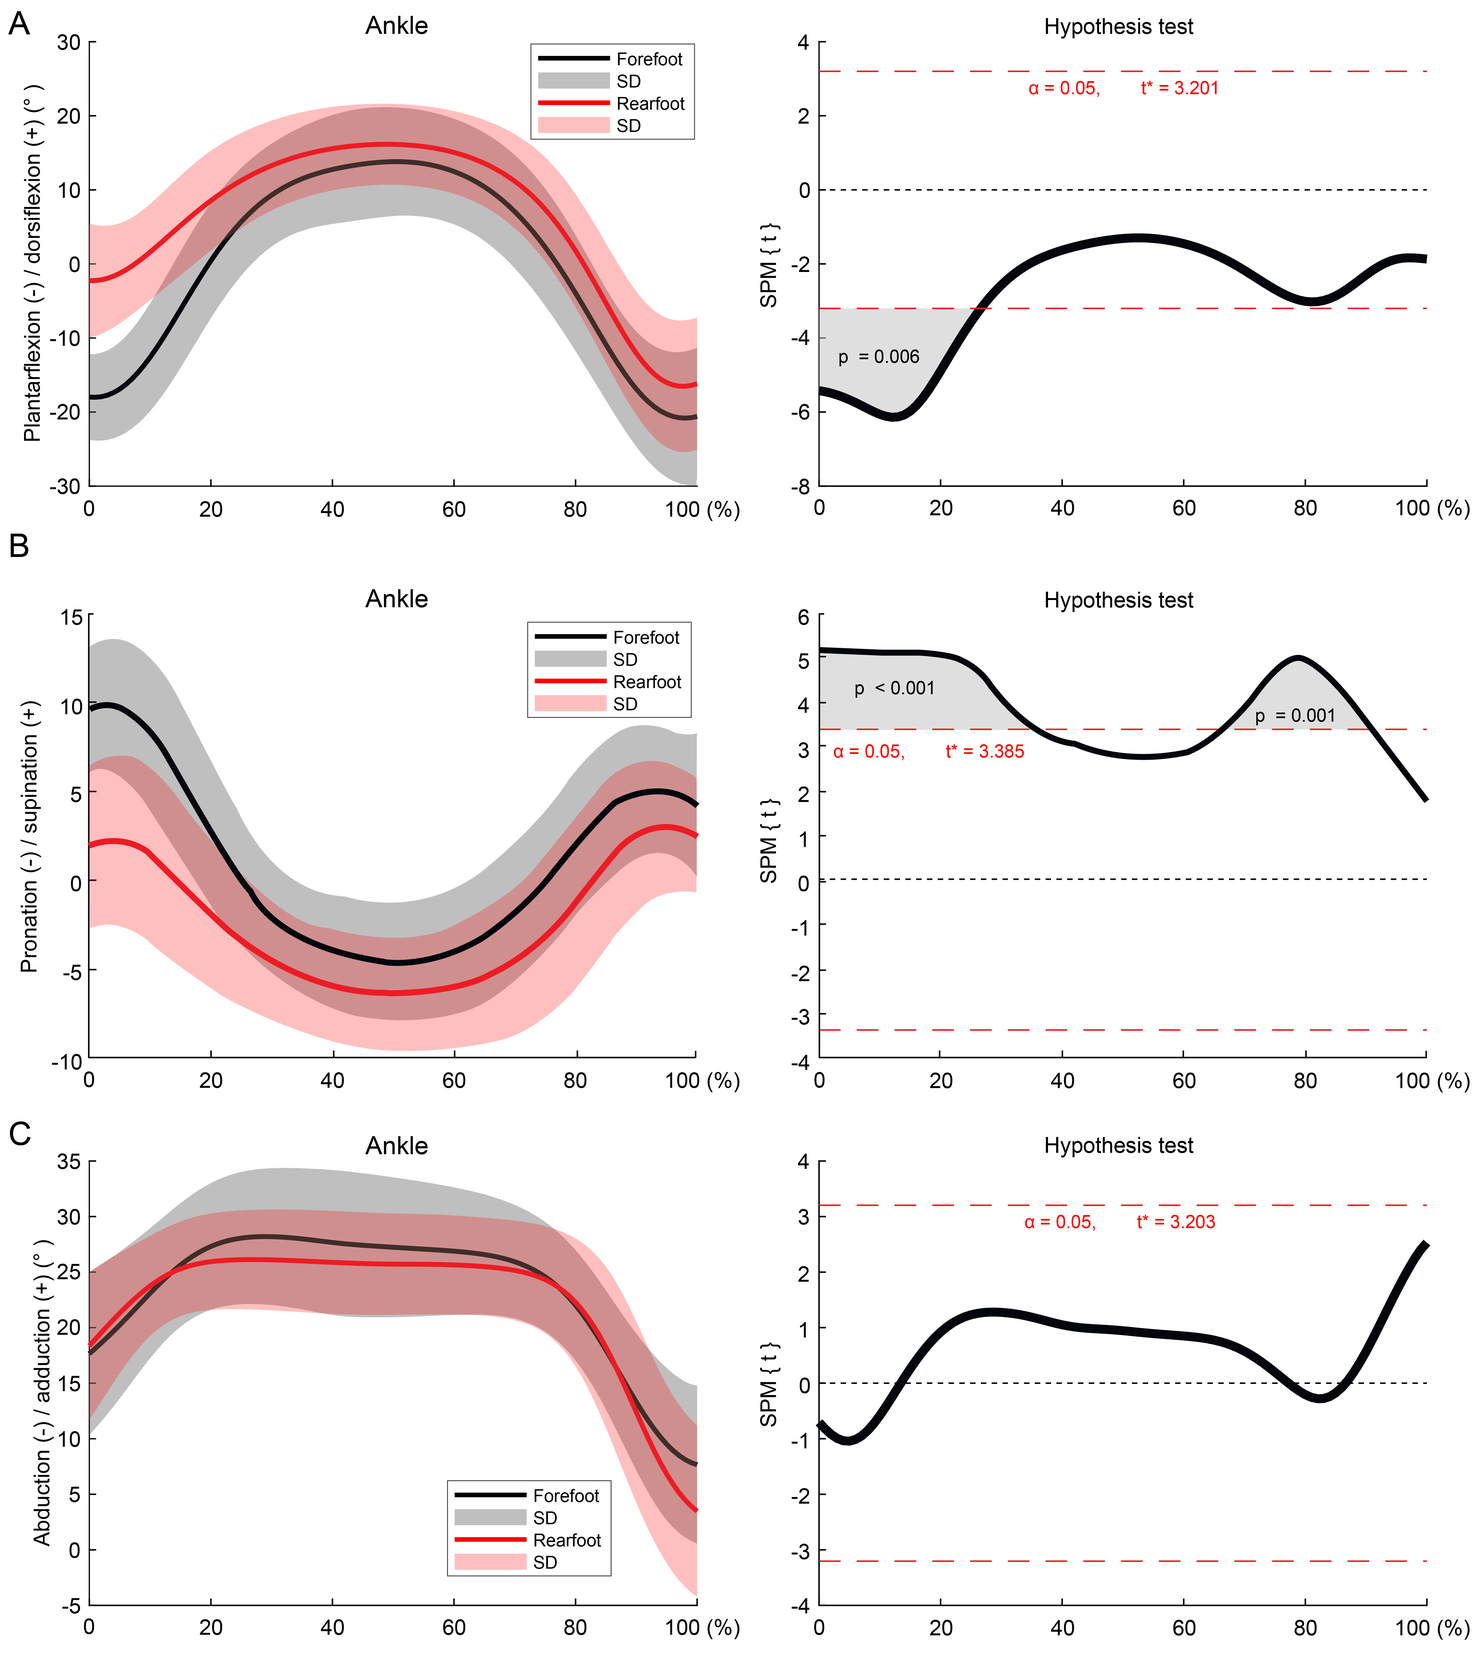
The knee valgus angle was significantly smaller from 18–34% with the RFS compared to the FFS (p<0.05) (Figure 6a). The knee internal rotation angle was significantly larger from 14–30% with the RFS compared to the FFS (p<0.05) (Figure 6b). The knee external rotation angle was significantly larger from 86–100% with the RFS compared to the FFS (p<0.05) (Figure 6b). The plantar flexion angle was significantly larger from the IC to 26% with the FFS compared to the RFS (p<0.05) (Figure 7a). The ankle supination angle was significantly larger from the IC to 35% and from 67–91% with the FFS compared to the RFS (p<0.05) (Figure 7b). There were no significant differences in the other hip, knee, and ankle angles between the FFS and RFS (Figures 6c and 7c).
Discussion
The results of this study indicate that significant differences in the lower-limb angles, muscle activities, and GRFs exist between the FFS and RFS, in varied portions of the stance phase. The larger ankle plantar flexion angle of the FFS demonstrated that the task motion was performed as instructed under the conditions used. ACL injuries occur in the very early phase after landing3; therefore, this study considered the different variables produced by the FFS and RFS in the early landing stages. There were significant differences in the vertical and posterior components of the GRFs as well as GM, RF, GL, and ST muscle activation during the early phase as up to 50% from the IC landing between the FFS and RFS.
The vertical component of the GRF has been shown to be larger with a RFS than with a FFS during two-leg drop jumps.11 ACL strain begins to increase during the flight phase before landing and reaches a peak that corresponds to the peak GRF.15 Lin used a computer simulation to compare lower extremity kinematics and kinetics between experimental conditions with and without non-contact ACL injuries.16 The authors reported that athletes had significantly greater normalized peak posterior and vertical GRF in the simulated injury trials. In addition, Yu reported that the peak vertical ground reaction force significantly correlated with the peak proximal tibia anterior shear force and peak knee extension moment during the landing.17 Additionally, compared to a non-injured group, an ACL injury group exhibited larger knee valgus angles, with a vertical GRF component of approximately 20% larger.2 Therefore, the higher vertical component of the GRF observed with an RFS could increase the risk of ACL injury by placing greater tension on the ACL. The vertical component with the FFS was lower than that with an RFS; therefore, a FFS might reduce the risk of ACL injury.
Increased GL activity before landing, which causes plantar flexion of the ankle during the FFS, buffers the impact of landing through eccentric contractions of the GL. Because the plantar flexion angle was significantly larger with the FFS than with the RFS, a FFS might reduce the risk of ACL injury. The hamstrings functions to prevent anterior displacement of the tibia.18–21 Because anterior displacement of the tibia increases ACL tension, the current study’s results indicate that increased GL and ST activity during the FFS may prevent large amounts of tension from being placed on the ACL, thereby reducing the risk of ACL injury. Activity of the gluteal muscles during landing motions buffers the load on the leg joints in the flexion direction, helps maintain posture in the sagittal plane, and keeps the pelvis horizontal. These functions stabilize movements of the hip and knee joints, which reduces tension on the ACL.22–25 Results of the current study revealed that GM activity increased during the FFS from IC to 5%. Considering that the GM is the primary abductor of the hip joint, this could help maintain the posture in the coronal plane and reduce the risk of ACL injury during 180° turns.
The knee internal rotation angle increased from 14–30% with a RFS, which might indicate that the FFS could reduce the risk of ACL injury compared to the RFS. The supination angle of the ankle was larger with a FFS, which may help prevent ACL injury, but the risk of ankle sprain should also be considered. The current results also demonstrated that the hip flexion angle was larger, and the knee valgus angle and posterior GRF were smaller with a RFS than an FFS. These results are similar to findings from Cortes et al. stating that the RF landing technique resulted in decreased knee valgus angles, knee flexion, knee adductor moment, posterior GRF, and an increased hip flexion angle at IC.26 Jones et al. indicated that the penultimate contact during pre-planned changes in direction helps reduce loading on the turning leg where there is a greater risk of injury to knee ligaments.27 Regarding knee valgus, the current study found that the FFS approached the neutral position, and the RFS headed toward the varus direction. The knee valgus angle observed in the current study was small, and there is a possibility that the risk of ACL damage related to the valgus angle has little effect on the RFS and FFS. However, as a proposition to the field, there is a possibility that the RFS is better for actions with a large valgus angle such as the pivot task, similar to findings from Cortes at al.26 As for the posterior component of the GRF, even if the anterior component appears in the RFS, if the GRF passes posterior to the center of the knee joint, the tibia receives the anterior pulling force, increasing the risk of ACL damage. On the other hand, even if the rear component is high in the FFS, if the GRF passes anterior to the knee, ACL stress may not increase. However, in the current study, the positions of the penultimate (left) foot and the landing (right) foot were not the same in all trials. Therefore, it is possible to increase the posterior component of the GRF by landing anterior to the body’s gravitational center in the FFS; however, the results of the current study do not clarify the reason for the difference in the GRF.
The differences in the hip abduction, hip external rotation, and knee external rotation angles were in the later phase; therefore, it is considered that they would likely have a weak association with the occurrence of ACL injuries.
This study has some limitations. First, examining the biomechanical risk factors cannot precisely reproduce the conditions during which ACL rupture occur, and rely on analyzing a sham movement during the experiment. Although the authors believe that the sham movement/experimental conditions were similar to actual sports activity, there may be some differences in the experimental condition and ACL rupture. Second, the trunk and pelvis should be studied further, because the current study did not measure the angles of trunk side bending and pelvic leaning. Finally, there were only 14 male soccer-playing participants in this study; therefore, there may be errors due to the small sample size. It is also unclear whether the results of this study can apply to female athletes and whether they can be applied to athletes who specialize in sports other than soccer. The difference between the hip joint flexion angle and the posterior component of the GRF may also have been influenced by the lack of evaluation of the penultimate contact. In the future, increasing the number of participants and including athletes of other sports, and including women, will lead to a broader application of the results.
Conclusion
The present study investigated the difference between the FFS and RFS during 180° turns. The FFS consisted of initial contact with the toes on the force plates followed by the rearfoot. For the RFS, the initial contact was performed with the heels on the force plates followed by the forefoot. The results of this study indicate that the FFS pattern, when compared to the RFS, produces decreased vertical and GRF components and increased ST muscle activity, implying the potential for reduction in the risk of ACL injury during a 180°-turn movement. Because these results helped clarify that the difference that foot strike has on kinematics and kinetics, it is necessary to further investigate the if a type of foot strike can affect injury prevention.
Conflict of interest statement
There are no conflicts of interest for all authors.