
INTRODUCTION
Iliotibial band syndrome (ITBS) is a common clinical condition characterized by sharp, localized, lateral knee pain, often experienced around 30° of knee flexion during repetitive knee flexion-extension activities. This entity is reported to account for 10% of all lower extremity overuse syndromes in runners1 and up to 24% of all overuse syndromes in cyclists.2 The pain is often severe enough to result in activity discontinuation.2 The type of force causing impingement between the lateral femoral condyle and the iliotibial band (ITB) is debated. Several authors concluded that repetitive ITB movement in an anterior-posterior direction produced friction resulting in microtrauma.3–5 Conversely, Fairclough et al6 suggested that the ITB moves in a lateral to medial direction causing lateral knee compression forces. Increased ITB tissue stiffness may increase compression or friction forces along the lateral femoral epicondyle7, potentially leading to ITB tissue irritation.4
Previous authors have assessed structural changes associated with ITB complex stretching. These investigators questioned the ability of clinical stretching to produce lasting lengthening effects caused by ITB complex stretching maneuvers.8 In accordance, a study of in vitro ITB and tensor fascia latae (TFL) complex tissue specimens determined that significantly greater tissue elongation occurs in the proximal region hosting the TFL muscle during a simulated clinical stretch protocol, suggesting that elongation may be due to TFL elongation versus actual ITB lengthening.9 Data from that study indicated that the ITB tissue itself was not likely “stretched” during normal clinical stretching protocols. Seeber et al10 in a cadaveric investigation further confirmed this hypothesis. Despite the lack of ITB tissue elongation, global hip adduction ROM improves with hip adduction stretching maneuvers.11 TFL-related neuromuscular factors associated with interventions such as stretching and foam rolling might contribute to perceived clinical benefits and increased ROM following ITB stretching. These include easing symptoms that may decrease stiffness in the muscular system components.9
An additional treatment commonly used for ITBS symptom management is foam rolling.12–19 Prior systematic reviews sought to determine foam rolling treatment effects on joint ROM post-exercise muscle recovery and performance.17,20 The findings revealed increased hip extension ROM after one week of foam rolling with return to baseline values after an additional week.21,22 Subjects reported pain reduction following foam roller treatment, although pain was reduced in both the treated and non-treated legs, which implies that a mechanism other than myofascial release is responsible for reduced pain responses.17,23,24 Despite this, other evidence supporting a potential role for myofascial release suggests it may contribute to reducing ITBS-related pain.
Various studies have investigated plastic, viscoelastic, and piezoelectric connective tissue property changes following myofascial release treatments.25–28 Trigger points, muscle contractures, and fascial adhesions are suggested to contribute to ITBS pain patterns. Therefore, foam rolling could be effective in “releasing” myofascial restrictions.12 However, a narrative literature review suggests this “release” phenomenon does not accurately describe the mechanisms associated with foam rolling.29 Instead, foam rolling might promote tissue warming, increasing pliability by transforming tissue into a more fluid-like form and eliminating fibrous adhesions between fascial layers, thus restoring soft tissue extensibility.30 Others have suggested that connective tissue may become denser with overuse, but it is unknown if this is related to alterations of collagen composition, fibroblasts, or ground substance.31–34 Ajimsha et al31 concluded that further evidence regarding the possible mechanism of action behind myofascial release is needed to make a logical basis for choosing it as an optimal intervention. An in vivo measurement of tissue stiffness using shear wave ultrasound elastography (SWUE) can potentially detect any changes associated with ITB stretching and foam rolling, thereby supporting the insufficient body of evidence surrounding myofascial release techniques.
SWUE is a non-invasive ultrasonographic imaging technique useful for evaluating soft tissue properties by measuring propagation velocity of shear waves produced in biological tissues and ultimately calculating the shear elastic modulus. Although studies regarding reliability, validity, and responsiveness of SWUE for the ITB and TFL are lacking, studies in similar tissues reveal that this method has good to excellent inter- and intra-operator reliability35 and that SWUE stiffness measurements correlate well with established testing methods.36,37 Previous studies have used SWUE to investigate ITB tissue changes in different loading positions and demonstrated a 32% increase in ITB stiffness during one-leg standing with increased hip and knee adduction.7 In a follow-up study, Tateuchi et al38 determined that ITB stiffness increased most with hip extension, adduction, and external rotation during a one-leg standing position. However, it is not known if the ITB stretch produced any change to tissue elastic properties when the tissue is returned to its resting length.38 Additionally, it is unknown whether elasticity changes occur when applying a foam rolling intervention.
The purpose of this study was to examine the effects of foam rolling and ITB stretching on ITB stiffness at 0˚ and 10˚ of hip adduction and hip adduction PROM. Hypotheses include the following: (1) resting ITB stiffness measured with SWUE will not change with clinical stretching techniques; and (2) resting ITB stiffness at 0˚ and 10˚ of hip adduction measured with SWUE will decrease with application of a foam rolling intervention.
METHODS
Experimental Design
This study was a single blind, randomized controlled trial (RCT). The independent variables included (1) ITB intervention with three levels (control, stretching, and foam rolling), and (2) time with two levels (before intervention and immediately following intervention). The dependent variables included shear modulus (kilopascals, kPa) of the ITB at mid-thigh level and distal thigh level as well as the TFL; all measured at neutral (0˚) and 10˚ of hip adduction, and (2) hip adduction PROM.
Participants
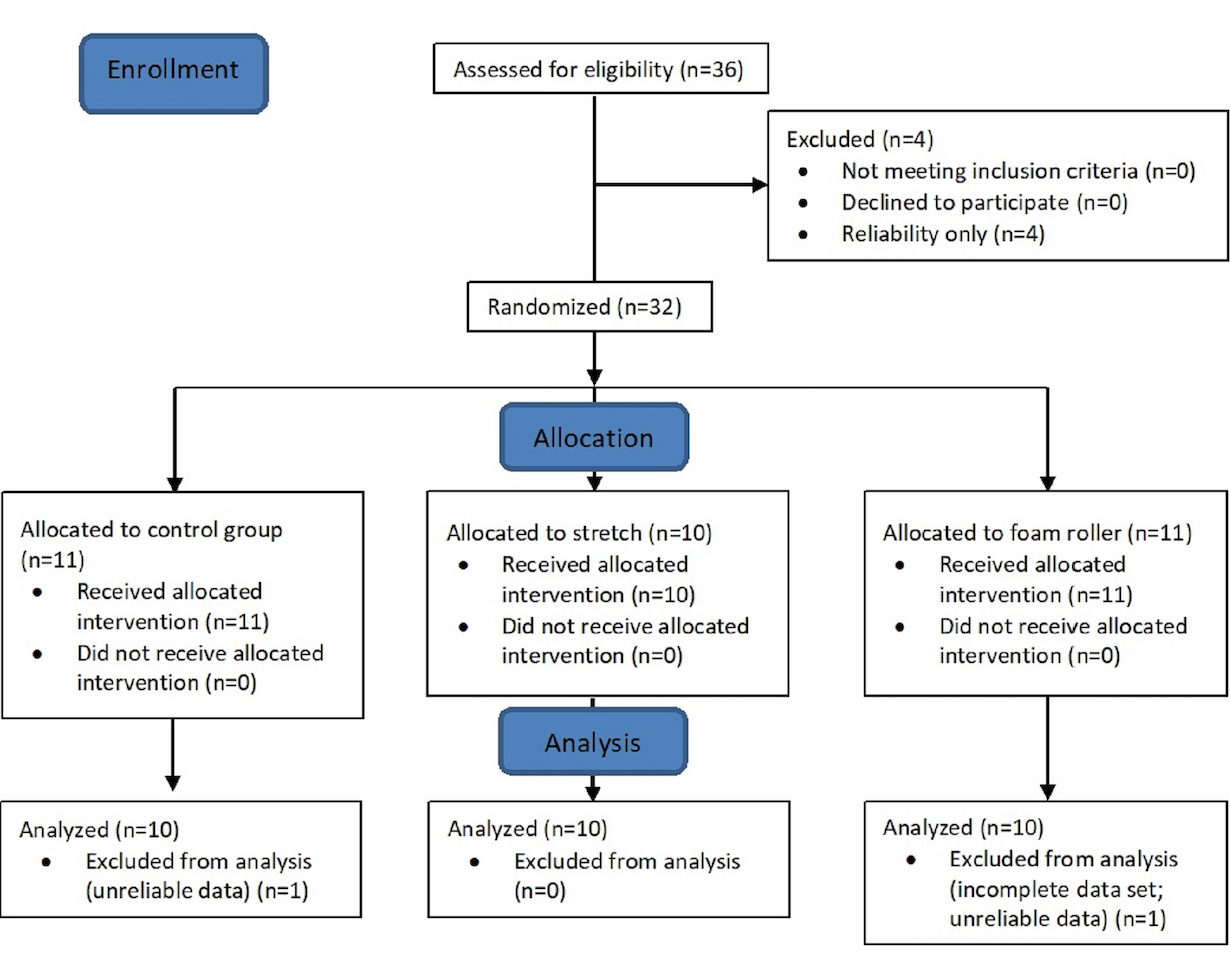
The local institutional review board approved this study (# L19-076). An a priori power analysis to detect changes in stiffness was performed to determine the number of subjects to be included in each group. A previous study38 found a moderate effect size (Cohen’s d=0.53) for ITB stiffness between standing with and without hip adduction and contralateral pelvic drop. With alpha = 0.05 and a moderate effect size of Cohen’s d =0.50, the number of subjects required to detect a statistically significant within-factors stiffness difference with power = 0.80 was 30 total subjects. To account for subject attrition and other potential errors, 36 total subjects were recruited from the university’s student and employee populations via posted notices of solicitation and in-class recruitment.
Study inclusion criteria included: (1) healthy males and females 18 to 50 years of age; (2) able to provide informed consent for participation. Exclusion criteria were: (1) history of ITB syndrome; (2) regular use of ITB complex stretching or foam rolling; (3) history of hip, knee, or lumbar spine surgery; (4) history of autoimmune disease including fibromyalgia or rheumatoid arthritis; (5) any neurological disease/disorder that impairs lower extremity function (e.g., spasticity) and/or sensation; (6) presence of skin lesions or skin rash on the involved lower extremity; (7) history of deep venous thrombosis; (8) hemophilia; (9) history of hip dysplasia.
Data from 11 males (age = 30.5 ± 9.0 years, Body Mass Index (BMI) = 27.8 ± 4.0) and 19 females (age = 23.5 ± 4.9, BMI = 23.2 ± 2.1) were analyzed for this study (Figure 1). All subjects provided informed consent before study participation.

Experimental Protocol
Subjects were randomly assigned to either control (n=10), stretching (n=10), or foam rolling (n=10) groups (Table 1).
The foam rolling group performed an ITB foam rolling technique described previously.13 Participants received video instruction regarding uniform foam roller use to standardize the training measures. A foam roller (OPTP PRO-Roller® Standard; OPTP Minneapolis, MN, USA) with medium firmness and smooth texture was used. Subjects were positioned with the body parallel to the floor and the foam roller placed between the floor and the left thigh. Pressure was adjusted by applying body weight to the roller and using the hands and feet to offset weight for balance as needed. The roller was positioned with its long axis perpendicular to the long axis of the left thigh at the target tissue area (ITB). The subject rolled over the foam roller, where the body was moved back and forth across the foam roller from the greater trochanter to the lateral femoral epicondyle. Participants were instructed to practice up to three times with investigator guidance to achieve the correct foam rolling technique required for this study. Then, the technique was performed on the target tissue using short, kneading-like motions along the length of the tissue and then quickly rolling back to the starting position in one fluid motion. This was repeated for 1-minute, followed by a 30-second rest period and performed for five total repetitions.30 Investigators provided feedback to participants regarding correct foam roller technique as needed.
The stretching group performed a stretch described by Fredericson et al15 with a modification of hip external rotation according to Teteuchi et al38. Subjects began by standing upright with the target left leg placed in a hip extended, externally rotated, and adducted position behind the other leg (i.e., right leg). Subjects raised and clasped their hands overhead, exhaled and slowly flexed the trunk in a direction lateral to the opposite side. This motion was continued until an uncomfortable stretch was felt around the greater trochanter of the treatment side hip or until further motion was not possible. Investigators ensured proper positioning for effective ITB complex stretching. The stretch was performed in three bouts of a 7-second submaximal contraction in hip abduction followed by a 15-second stretch.14 Each bout was followed by 30-second rest interval and 3 total bouts were performed.
Subjects in the control group were placed on a treatment table in supine with the hip in neutral rotation for five minutes between measurements.
The left lower extremity was tested due to laboratory setup requirements and limitations in moving the ultrasound device and cameras between each subject. Researchers were blinded to the assigned intervention and the same researchers examined pre- and post-intervention outcomes. Prior to the intervention, tissue stiffness was measured three times at neutral hip adduction (0)˚ and 10˚ of hip adduction with the subject in supine. Pilot testing showed that 10˚ of hip adduction was sufficient to demonstrate SWUE changes. These measurements were repeated within 10 minutes following the randomized intervention. In addition, hip PROM was recorded pre- and post-intervention.
Shear Wave Ultrasound Elastography
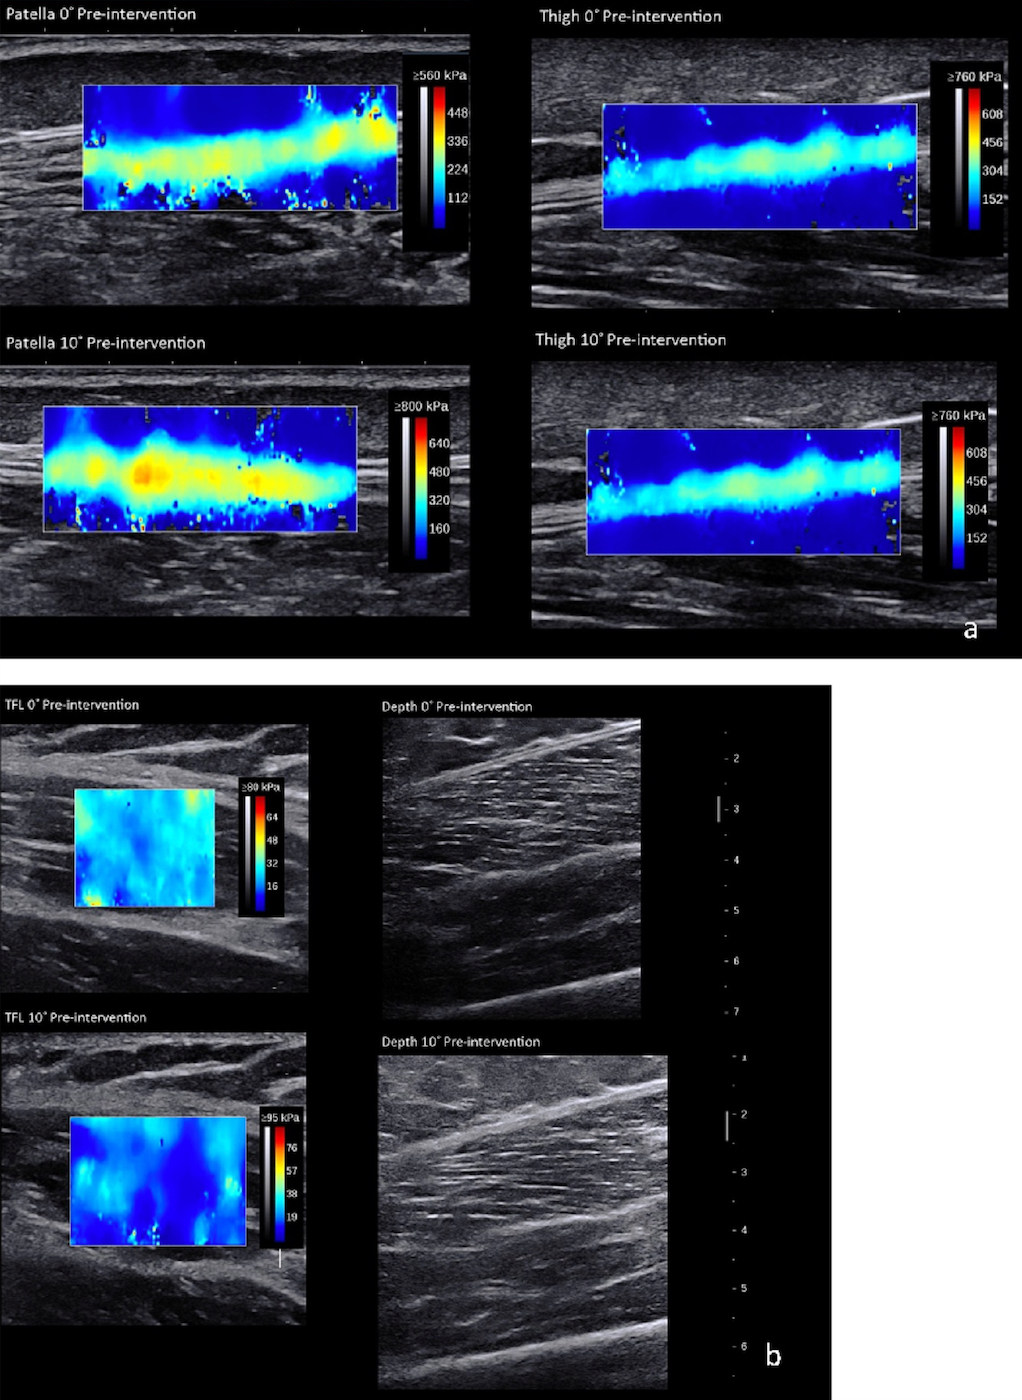
SWUE measures a soft tissue’s stiffness as Young’s modulus (kPa).39–42 Minimal detectable change for muscle and tendon tissue, respectively, is 1.72 kPa and 32.90 kPa.35,39,43–45 An Aixplorer (SuperSonic Imagine, Version 10.0, Aix-en-Provence, France) ultrasound system measured the ITB Young’s modulus at three anatomical locations: (1) lateral mid-thigh, (2) lateral thigh at the level of the patella’s superior border, and (3) TFL (Figure 2a and 2b). The two ITB points were measured with a 15-4 MHz linear transducer with the “Tendon” setting. The TFL was measured halfway between the anterior superior iliac spine (ASIS) and the femoral greater trochanter (10-2 MHz linear transducer with a “Muscle” setting). The mid-thigh location was halfway between the greater trochanter and lateral femoral epicondyle. The transducer was placed along the long axis at each location.
Hip Adduction Range of Motion
Hip adduction PROM was determined in real time using an electrogoniometer (Noraxon Ultium, USA). End range hip adduction PROM measurements were performed from video taken from a ceiling-mounted camera (GoPro, Hero5) and analyzed visually.
Markers were placed on bony landmarks at the ASIS bilaterally and on the left lower limb’s patella midline for photographic measurement.46 End range hip adduction was measured by evaluating when ASIS first began to move. Subjects were placed supine on a plinth, where the contralateral leg was held in a flexed knee position over the measurement leg allowing for full hip adduction. Investigators controlled neutral hip rotation during all hip adduction movements.
Statistical Analysis
All data analyses were completed using jamovi.47 Skewness, kurtosis, Q-Q plots, and Shapiro-Wilk tests were assessed to evaluate data normality, and Levene’s test was used to assess homogeneity of variance. Independent ANOVAs were performed to examine baseline differences between groups. To reduce the Type I error risk, the dependent variables were divided into two families with appropriate correction of alpha levels: SWUE measurements (six dependent variables, α < .008), and hip adduction (one dependent variable, α < .05). To test whether SWUE values differed between the 0˚ and 10˚ adduction positions, paired-samples t-tests were performed at all three sites before and after each intervention. Multiple 3 (intervention) x 2 (time) mixed ANOVA analyses were used to determine interaction and main effects of ITB Young’s modulus at the patella and thigh levels and the TFL in both 0˚ and 10˚ of hip adduction and hip adduction PROM. Effect sizes were labeled as small (ηp2 = .01), medium (ηp2 = .06), and large (ηp2 =.14).48
RESULTS
There were no statistically significant differences among the three groups for age (p = 0.57), height (p = 0.76), or body mass (p = 0.96). No significant interactions or main effects were found for Group or Time differences in ITB complex tissue Young’s modulus at the mid-thigh, the superior border of the patella, or the TFL at 0˚ or 10˚ of hip adduction (Table 2).
For hip adduction PROM, no significant interactions were observed. A significant main effect was found for Time, where the mean adduction PROM was 0.8˚ greater post-treatment. Additionally, the Group main effect difference was nonsignificant (Table 3).
DISCUSSION
This study examined ITB and TFL complex stiffness at 0˚ and 10˚ hip adduction before and immediately following one of three interventions: ITB foam rolling, stretching, or no intervention.
Neither the stretching intervention nor foam rolling altered ITB or TFL stiffness. These results suggest that tissue stiffness does not change with short term static stretching interventions or foam rolling; however, the intervention duration might have been insufficient to elicit tissue change or indicates that the interventions have no impact on healthy subjects ITB and TFL tissue stiffness. Another possibility is that multiple interventions are required. The myofascial plasticity theory may be a reasonable explanation for the lack of stiffness changes in the current study.25 Tissue changes occur slowly over time and therefore, may require additional time and intervention repetition to demonstrate changes in ITB stiffness. Wilke et al49 found that anterior thigh stiffness did not change immediately following foam rolling, but decreased after 5 and 10 minutes.
Hip adduction PROM improved post-intervention. However, this change was only 0.8˚ and occurred in the control group as well as the two intervention groups, suggesting that it may be due to measurement error and is likely not clinically relevant.
Future research should consider recruiting from a symptomatic population. Doing so may assess whether these results change when pathology is present. This could provide information on the effect of pain on clinical measures of ROM, muscular force production, and end range mobility. Finally, evaluating a longer treatment interval time is necessary to assess changes in these variables with long-term interventions.
CONCLUSION
The study findings indicate no effect of stretching and foam rolling on short-term ITB stiffness in vivo in healthy subjects, thus supporting previous cadaveric ITB stretching studies.9,10 Single bouts of foam rolling and stretching do not change ITB stiffness in healthy subjects and may have limited value in reducing ITB compression. The lack of ITB stiffness changes may be from an inadequate intervention stimulus or indicate that the interventions have no impact on ITB stiffness.
Conflict of interest
None of the authors have any conflicts of interest to report.