INTRODUCTION
Fifty-seven to seventy percent of injuries that occur during high school and collegiate sport participation involve the lower extremity (LE).1 The risk of lower extremity re-injury is also relatively high. Up to 25% of athletes experience an ACL graft re-rupture or a contralateral tear upon return to unrestricted physical activity.2–4 Twelve to forty-seven percent of those people who sprain their ankle will suffer from recurrent ankle sprains, with 24% re-spraining within 3 months of initial injury. 5,6
Given these high rates of LE injuries, rehabilitation specialists must explore ways to prevent re-injury and eliminate any persistent functional deficits to enable an effective and safe return to sport activity. Time from surgery is often the only variable considered in return to sport decision-making; therefore, many patients may return to sport with persistent strength and performance impairments which increase their risk of re-injury.7–9 Functional performance tests are meant to simulate, in a controlled fashion, sport-like movement patterns and stress the strength, power, and agility characteristics that are present in sport competition. Functional performance tests range from general lower extremity power and agility tests to unilateral hopping tests.10 Functional performance tests have been developed to assess rehabilitative progression and as part of a battery of tests helping to determine discharge criteria.10–12
Hop tests are easy to administer and require little space and technology to perform. Hop tests are the preferred type of functional test due to the utilization of the uninjured limb as a control for between limb comparisons and as a reference for which discharge from rehabilitation and return to sport may be determined.13 Single leg hop tests like the hop for distance, triple hop for distance, 6-meter timed hop and triple cross-over hop have extensive research supporting their reliability.13 A number of functional performance tests have been evaluated for their ability to discriminate injury risk in a variety of athletic populations.14,15
The current literature is somewhat conflicted on the use of functional hop tests in the determination of return to unrestricted physical activity. In a critical review it was concluded that while the ACL hop tests display adequate reliability, the current evidence indicates a lack of consistency in their capacity to predict successful outcomes following rehabilitation either in terms of return to previous performance levels or identifying those at greater risk of re-injury.16–18 Caffrey et al. reported that even though a limited number of studies exist to evaluate the functional deficits in patients with functional ankle instability, the information presented had conflicting results.10 Paterno et al. reported that current measures for determining discharge from physical therapy such as time from surgery, isokinetic strength, and performance on single-leg hop testing have failed to identify readiness to safely return to sport with a minimal risk of second injury.19 In a systematic review Losciale et al. concluded that hop testing appears to possess fair association to subjective report of knee function measured by the Knee Injury and Osteoarthritis Outcome Score (KOOS) and International Knee Documentation Committee (IDKC) and a patient’s ability to return to sport after ACL reconstruction.17 Insufficient evidence is available to determine the relationship between hop testing and knee re-injury.17 Predictive validity cannot be established based on available literature.17
Conversely, a recent systematic review and meta-analysis concluded athletes that pass a return to sport test battery including hop tests have a lower risk of any knee re-injury including second ACL injury and ACL graft rupture.20 Webster and Hewett reported that passing a return to sport test battery (including hop tests) is associated with a 72% lower risk of ACL injury and other knee injuries.21 Davies et al. stated that the evidence presented in their critical review shows that single leg hop tests (single leg hop for distance, 6 meter timed hop, triple hop for distance and the crossover hop for distance) display good reliability and are sensitive to change over time.16 Toole et al. reported the proportion of young athletes after ACL reconstruction recently cleared for return to sports who met the combined criterion cutoffs were low, but those who met the criterion cutoffs for both strength and hop tests maintained the same level of sports participation at higher proportions than those who did not.22 Dingenen et al. demonstrated excellent test-retest reliability and discriminative ability of forward, medial, and rotational hop tests. They also reported that the medial and rotational hop tests were more likely to show limb asymmetries in ACL-reconstructed participants compared to forward sagittal plane hop tests.23
There is a need for functional performance tests to evolve to better assess athletic characteristics and help determine the ability to return to unrestricted physical activity and aid in finding those at-risk patients in order to better determine return to sport criteria. It has been recommended that hop tests that assess different planes of motion may give greater information about the function of the knee.16,23 Hardesty et al. assessed frontal plane hop tests in women’s basketball and soccer players finding the medial triple hop for distance may be effective at identifying side-to-side asymmetries in these athletes.12
Given the number of functional performance tests and the conflicting results demonstrated in the literature, it is important to continue to investigate new tests that may add to or replace existing tests to aid in return to play decisions. Clinicians must choose tests that are objective, reliable, and valid and that preferably test in multiple planes of movement. Therefore, the purpose of this study is to determine the test re-test reliability of a novel multi-directional timed single leg hop test (T-Drill Hop Test) for use in rehabilitation and performance assessments.
METHODS
Participants
Fifty subjects (27 females and 23 males; mean age 23.48 years with SD 3.82) were recruited to participate in the study. The males’ average height and weight were 71.35 inches (SD 3.083) and 190.87 pounds (SD 30.87). The females’ average height and weight were 65.52 inches (SD 2.38) and 149.04 pounds (SD 18.38). Subjects were recreationally active as per American College of Sports Medicine guidelines.24 All subjects participated in moderate intensity aerobic physical activity for a minimum of 30 minutes 5 days a week or vigorous intensity aerobic physical activity for a minimum of 20 minutes on 3 days a week.24 None of the participants were competitive athletes. Subjects also completed a demographic form and the PAR-Q25 to identify any other contraindications for participation in the study. Subjects were included in the study if they did not have any orthopedic disorders, injuries, fractures or surgeries to the lumbar spine or lower extremities within the past year. Potential participants were excluded if they were outside the age range of 18-35 years, unable to complete the test as prescribed, or were unable to read, write, and communicate in English. Subjects were excluded if they had a history of orthopedic disorders or surgeries to the lumbar spine or lower extremities within the past year prior to data collection. If the subjects met the inclusion criteria, they read and signed an informed consent form approved by the Institutional Review Board. All testing was performed in the Biodynamics and Human Performance Center.
Procedures
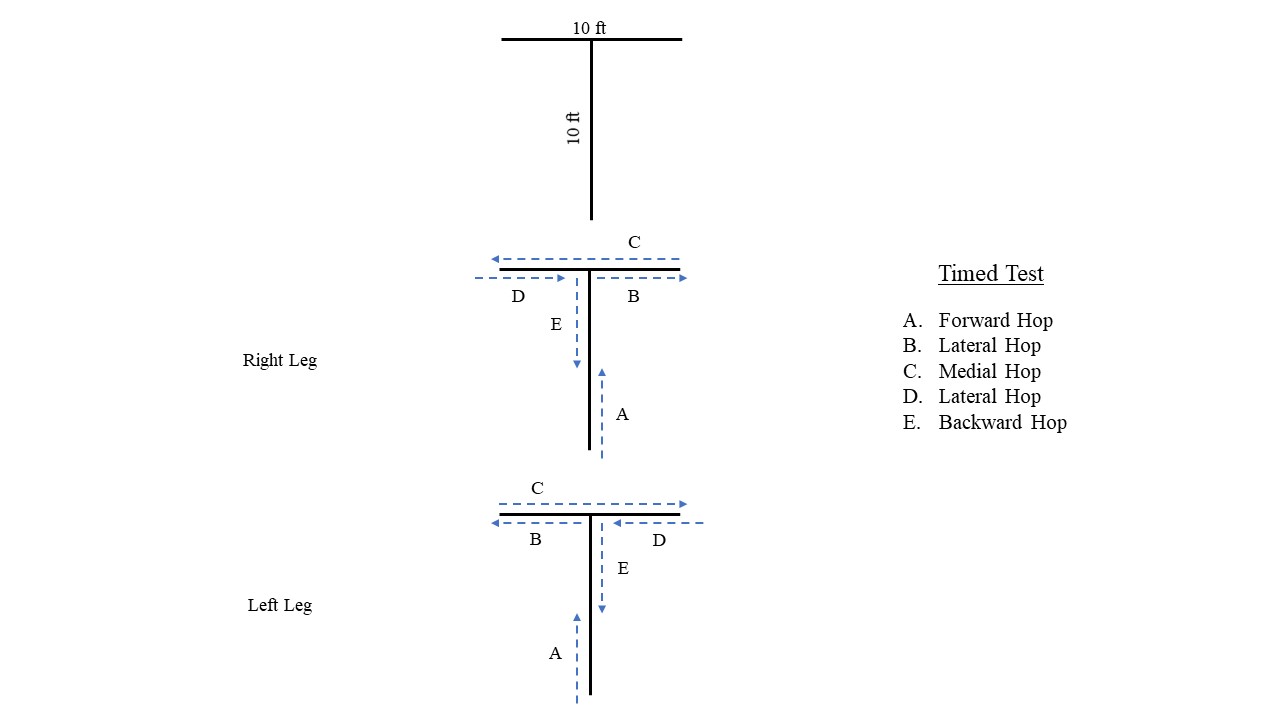
Subjects performed a lower extremity bicycle ergometer warm-up for 5 minutes at a self-selected Borg’s rating of perceived exertion of 12-14. They then stretched the gastrocnemius-soleus complex, quadriceps and hamstring muscles for 30 seconds each. The T-Drill Hop Test is designed to be 10 feet long and then 5 feet wide on each side of the center line of the T (Figure 1). Subjects watched a video of the performance of the T-Drill Hop Test. Following the video, the subjects were shown a live demonstration of the T-Drill Hop Test by one of the researchers. Subjects then completed one sub-maximal warmup of the test with their hands on their hips hopping on the specified leg, prior to the 2 maximal trials per leg. A jump is performed with two legs simultaneously, whereas, a hop is taking off and landing on the same single leg.

The testing protocol is detailed in the following paragraph. The starting extremity was identified by using a computer random number generator. If the right extremity was selected, then the subject would perform the test using a maximal effort in an anterior direction down the center of the “T” and at the intersection of the “T”, they would do the lateral hops toward the selected leg’s side, i.e., if they started with the right leg, they would hop toward the right side of the “T” first, and then toward the left side of the “T”. The subjects then returned back to the center of the “T” and did retro-hopping back to the starting position. A 60-120 second rest was permitted between the first and the second test on each limb. The subjects performed a sub-maximal warmup and 2 maximal test trials and the scores from the maximal test trials were averaged. Then the opposite leg was tested using the same testing protocol and scoring (Figure 1).
If the subject performed any qualitative “faults” during the performance of the test, then the subjects were required to repeat the test. Examples of faults would include: separating the hands from the hips, touching the non-hopping foot to the ground, not hopping directly behind the targets during the test, or not staying in a relatively straight line on the “T”. Two researchers stood on opposite sides of the testing area and timed the test by using their iPhone (Apple, CA.) stop watches. The times from each researcher were averaged for each repetition, and then the times were averaged for the 2 repetitions to calculate the final score for the subject for each test leg.
Subjects returned between 3-7 days for the second battery of tests. Subjects were encouraged to not do anything differently and to maintain their usual and customary activities between the test sessions. Additionally, subjects were asked to have similar eating and sleeping habits, wore similar shoes and clothing, and were tested at approximately the same time of day for both sessions. The second testing session protocol was performed in the same manner as the first test to determine reliability of the T-Drill Hop Test.
STATISTICAL ANALYSIS
SPSS Version 25 software (IBM SPSS Inc., Armonk, NY) was used for data analysis. Two-way random Intraclass Correlation Coefficients (ICCs) (2,k 95%CI) were used to determine the reliability of the tests from the first to the second testing sessions.26 The Minimal Detectable Change (MDC) was calculated for the interrater measurements using the following formula: to determine the magnitude of change that would exceed the threshold of measurement error at the 95% confidence level.26 Paired t-tests were utilized to determine if there was a significant difference in the time score between the dominant and non-dominant lower extremities with an Alpha level of p< 0.05.
RESULTS
The Intraclass Correlation Coefficient (ICC) 2,k (95% CI), Standard error of measure and MDC (95% CI) are shown on Table 1. The ICC’s with combined male and female subjects (n=50) ranged between .98 and 1.00, demonstrating excellent reliability. Koo and Mae described ICC values above .90 are indicative of excellent reliability.27 The mean time for the females’ dominant leg was 9.58 seconds and the standard deviation was 2.57. The mean time for the females’ non-dominant leg was 9.40 seconds with a standard deviation of 2.39. The mean times for the males’ dominant and non-dominant legs were 7.22 seconds and 7.37 seconds, respectively, with standard deviations of 1.16 and 1.10, respectively. The bilateral comparison, utilizing paired dependent t-tests, of the T-Drill Hop Test demonstrated no difference between time scores for dominant and non-dominant legs (p>0.05). (Table 2)
DISCUSSION
The current study demonstrated excellent test re-test reliability of the T-Drill Hop Test. Due to the excellent reproducibility in normal recreationally active subjects, this test could be utilized to compare lower extremity function between the limbs. This is in line with other hop tests assessing frontal and transverse planes of movement.10–12,23,28 Dingenen hypothesized that medial and rotational single-leg-hop tests could be used to compliment evaluations focusing on movements in the forward direction to track progress during injury recovery or optimization of performance.23 Clinicians must consider that sport activity involves movements in all planes of motion. The current multidirectional hop test can be an important assessment to help determine progression during rehabilitation, physical performance training, and determining readiness to return to sport.
Docherty and Sharma both showed a significant relationship between functional ankle instability and performance deficits in the side hop and figure-of-8 hop tests.29,30 Functional performance tests should assess athletic characteristics of strength, power, agility, change-of-direction, and balance. Recent studies reported only 30% of post-operative ACL-reconstructed patients perform change-of-direction and agility training as part of their rehabilitation progression.31,32 Edwards et al. concluded that patients who completed 6 months of rehabilitation incorporating jumping and agility tasks had a higher rate of return to sport, suggesting that postoperative rehabilitation is important in predicting return to sport.33 They went on to recommend evaluating biomechanical symmetry in addition to performance symmetry in regard to the functional performance testing.33 The results of these studies demonstrate the need for evaluating an individual’s ability with multi-directional movement testing prior to return to sport activity.
Functional testing batteries need to quickly provide clinicians the information, both qualitative and quantitative, that they need to help determine readiness to progress through a comprehensive rehabilitation program. Having many hop tests that are tested in a similar plane of motion may be counter-productive and not give the best representation of the patient’s willingness and ability to move in other planes of movement. The functional testing battery should comprise a short list of tests that evaluate multiple planes of movement. The information from the tests will provide a more comprehensive picture of the patient to aid in determining their readiness to return to activity and sport. Having one simple reliable test that can evaluate multiple directions (forward, side-to-side and backwards) and several athletic characteristics (speed, power, change-of-direction and agility) would be more efficient for clinicians to use in a limited space. Change-of-direction and agility are two important and specific skills that can be assessed for side-to-side asymmetry using this test.
Areas for future research would be to determine the validity of the T-Drill Hop Test and further develop the qualitative information to base successful test performance. Research to develop a normative data base for males and females over a variety of age groups and sport participation would be helpful. A direct comparison of the T-Drill Hop Test to some of the other existing single leg hop tests to determine which is more sensitive at detecting limb asymmetries.
Limitations
There are several limitations to this study. First, the sample had an uneven mix between men and women. Munro demonstrated differences between genders with hop testing, therefore, this limitation should be taken into consideration.34 The second limitation concerns the sample of convenience because all the subjects in this study were a healthy non-patient college-aged population, creating limited external validity. These limitations provide opportunities for future research.
CONCLUSION
The results of the current study suggest that the T-Drill Hop Test has excellent test re-test reliability. These results are important prior to validation and utilization as a clinical functional performance test. Based on the results of this study, limb symmetry index should be equal in healthy normals, as there was no statistical difference between the dominant and non-dominant legs. The current study may assist in the development of a serial testing paradigm for use during the training and rehabilitation of patients or clients with lower extremity pathology.
Conflict of Interest
The author has no conflict of interest to report.
Acknowledgements
The author would like to thank Erin Hodell SPT and Blake Smith SPT (Georgia Southern University) for their help with data collection. We thank Debra Negrete PT, MBA for her writing assistance, proofreading and help with manuscript submission.