
INTRODUCTION
The physiological demands of overhead sports on the shoulder may predispose athletes to injuries.1–4 Shoulder impairments are common for collegiate baseball (BB) and softball (SB) players.2,5 Impaired rotator cuff muscle strength may alter glenohumeral joint mechanics, contribute to painful shoulder conditions or lead to shoulder injury during the season.1,6–8 Imbalances in muscle strength of the rotator cuff has been suggested to be related to the unilateral repetitive nature of overhead throwing activities. Specifically, increased muscle strength of the internal rotators as compared to the external rotators.1,4,9–13 The strength of the shoulder musculature can be objectively and reliably measured in the clinical setting using a handheld dynamometer (HHD).13
“Clinician-friendly” physical performance tests, such as the Closed Kinetic Chain Upper-Extremity Stability Test (CKCUEST), are increasingly being used to examine and screen overhead athletes.14–17 The CKCUEST is an objective, easy functional test that can be used to measure components of muscle performance of the shoulder complex in a closed-kinetic chain position and places high demands on its stabilizers. Moreover, the test movement requires coordination between muscles of the trunk, shoulder, elbow, wrist and hand.18 Performance on the CKCUEST has been reported for Division I (DI) college football players,15 recreational athletes16 as well as Division III (DIII) BB players.17
DIII BB has the largest number of participating players (13,465) compared to DI (10,429) and DII (10,660) in the United States.19 Similarly, there were more SB players participating in DIII (7,646) compared to DI (6,042) and DII (5,992).19 A review of the literature showed that there are few reports that describe shoulder characteristics of DIII BB and SB players related to muscle strength and performance on the CKCUEST. Clinicians need to be able to identify the normal shoulder performance characteristics when examining and creating intervention strategies for DIII BB and SB players. A thorough review of the literature found no other studies that examined the relationship between the CKCUEST and shoulder strength or described the results of DIII BB and SB players.
The specific aims of this study were to: describe BB and SB players isometric strength measures and their performance on the CKCUEST; examine the relationships between strength and the CKCUEST; compare isometric strength measures of the throwing and non-throwing arms; and compare the strength and the CKCUEST measures between BB and SB players.
METHODS
Participants.
BB and SB players were recruited from one DIII college to participate in this study during the preseason. The inclusion criteria were: 1) BB or SB collegiate athletes; 2) who were over the age of 18 years; and 3) had no current shoulder injury or medical conditions that precluded them from participation in sports. The Institutional Review Board approved this study.
Data Collection.
Participants completed demographic and history information and then were randomly assigned to begin with either the CKCUEST or dynamometric strength testing. The order of the throwing and non-throwing shoulder testing also was randomly assigned.
Internal and External Rotator Isometric Strength Testing.
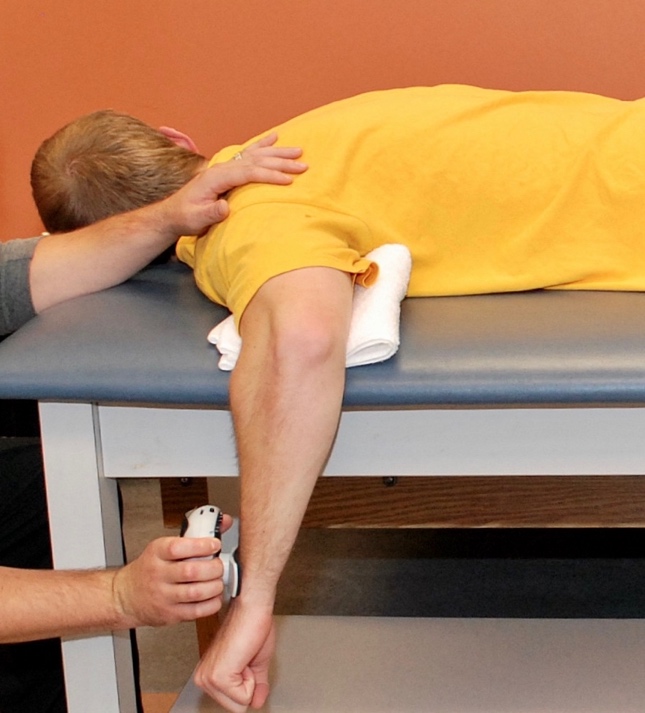
Study participants performed a 5-minute warm up which consisted of slowly lifting a submaximal weight through the full internal rotation and external rotation range of motion while in the testing position for 10 repetitions followed by a 3-minute rest period prior to strength testing. One investigator collected all strength measurements using a hand-held dynamometer (Lafayette Instrument, Lafayette, Indiana, USA). Strength was assessed in the prone position for the external rotators and internal rotators with the shoulder abducted to 90°, elbow flexed to 90° and the forearm pronated (Figure 1). A small towel was placed under the distal humerus. The examiner manually stabilized the humerus and placed the dynamometer on the distal radius 1 cm proximal to the wrist crease. The HHD was placed on the volar and dorsal aspects of the wrist to measure the strength of the internal and external rotators, respectively. To assess peak isometric force, the athletes were instructed to hold the arm against a gradually increasing force for a total of five seconds “make test”.1 The average peak force (kg) was divided by the athlete’s body mass in kg (BM) to calculate the standardized force production (%BM).

Good intrarater and interrater reliability of hand-held dynamometry (HHD) for strength testing of the internal and external rotators have been reported. 20,21 To ensure accurate reliability and validity of all included measures used in this study, a pilot study was performed utilizing 20 collegiate athletes. The shoulder strength of the internal and external rotators demonstrated high intra-rater and inter-rater reliability with intraclass correlation coefficients (ICC) of .95 and .99 for internal rotators and .98 and .98 for external rotators.
Closed Kinetic Chain Upper Extremity Stability Test.
The CKCUEST test has excellent test-retest reliability (ICC = 0.92).22 Additionally, a pilot study was performed and found the intra-rater and inter-rater for the CKCUEST to be ICC = .91 and .99, respectively. Two pieces of tape were placed 36 inches apart on the ground (Figure 2). The BB players were asked to assume the push-up position and the SB players used the modified push-up position with the shoulders kept directly over the hands. Participants were asked to make as many ‘touches’ of each piece of tape as possible within 15 seconds and the examiner counted the number of touches. Three trials were performed and the mean score of the three trials was calculated. A rest period of 45 seconds was given after each trial. The CKCUEST score and power were also calculated by using the following two formulas.23
Score= average number of touches performed on the CKCUEST/ height (m)
Power= 68% body weight (kg) x average number of touches performed on the CKCUEST
_and_male_.jpeg)
Data Analysis.
SPSS (IBM Corp. IBM SPSS Statistics for Windows, Version 26.0. Released 2019. Armonk, NY: IBM Corp.) was used to perform: 1) descriptive statistics for the strength of the internal and external rotators of the throwing and non-throwing shoulders and the CKCUEST; 2) paired t-tests to compare the strength measures of the throwing and non-throwing arms; 3) Pearson product-moment correlation coefficient to calculate the relationships between strength and the CKCUEST; 4) independent t-tests to compare the shoulder strength and the CKCUEST of BB and SB players; and 5) independent t-tests to compare the effects of the BB player’s field position on the shoulder strength and the CKCUEST variables. There was an insufficient number of SB pitchers (n=4) to complete a comparison between pitchers and other field positions. It was estimated that 30 participants would be sufficient to provide a good point estimate of isometric strength and the CKCUEST measures using a 95% confidence level and a population size of 13,465 DIII BB players.19
RESULTS
Seventy-four DIII collegiate athletes (50 BB and 24 SB players) with an age range of 18-21 years old agreed to participate (Table 1). All participants signed an institutionally approved informed consent. The strength expressed as %BM and the CKCUEST measures for BB and SB players are presented (Tables 2 & 3). All measurement values met the assumptions for parametric analysis.
There were significant differences between the BB players’ throwing and non-throwing shoulders for both the internal and external rotators (p = 0.012 & 0.047, respectively) with mean strength differences (95% CI) of 1.12 %BM (0.25, 1.96) and 0.92 %BM (0.01, 1.8), respectively. There were significant differences in the strength of the internal and external rotators within each shoulder (p = 0.008 & 0.013, respectively). The mean differences (95% CI) were 2.55 %BM (0.55, 4.56) for the internal rotators and 2.36 %BM (0.6, 4.09) for the external rotators of the throwing shoulder and non-throwing shoulders, respectively. However, the internal/external rotators strength ratio was not significantly different for either shoulder. When comparing BB pitchers to all other field positions there was no significant difference in any of the strength or CKCUEST measures (Table 4).
There were no significant differences between the SB players throwing and non-throwing shoulder strength for the internal (p=0.116) and external rotators (p=0.109). Moreover, there were no significant differences between the strength of the internal and external rotators of the non-throwing shoulder (p=0.075) or the throwing shoulder (p=0.096). There was an insufficient number of SB pitchers (n=4) to complete a comparison between the pitchers and other field positions (Tables 2).
The throwing and non-throwing arms of BB players produce significantly more internal and external rotation force than the SB players (p < 0.001). However, there was no statistically significant difference (p=0.31 & 0.30) in the internal/external rotators strength ratio of the throwing and non-throwing shoulders, respectively (Table 2). Among the CKCUEST measures, only the CKCUEST power showed significant differences (p < 0.001) between BB and SB players (Table 3).
Scatterplots were viewed to examine bivariate correlation and linearity between the strength and the CKCUEST measures. No curvilinear relationships were identified. There was no correlation between any measure of shoulder strength and the CKCUEST in BB players. Similarly, SB players also demonstrated no correlation between any of the throwing or non-throwing shoulder strength measures and the CKCUEST or CKCUEST score. However, SB players showed significant (p< 0.01) and moderate correlations between the CKCUEST power and strength of the internal rotators (r = -.54 & -.57) and external rotators (r=-.58 & -.58) of the throwing and non-throwing arm, respectively.
DISCUSSION
Descriptive studies enhance the ability of practitioners to accurately interpret examination data. One of the main purposes of this study was to describe the isometric shoulder strength measures of the internal and external rotators for DIII collegiate BB and SB players. Electromyographic analysis has shown that the shoulder internal rotators are the primary upper limb accelerators during overhead throwing while there is high supraspinatus, trapezius, and external rotator muscle activity during the follow-through phase.24,25 The rotator cuff strength of BB and SB players can be measured using a variety of tools including manual muscle testing, isokinetic dynamometry and HHD. HHD has been shown to be an effective alternative to manual muscle testing to improve objectivity in the clinical setting and is more readily available to clinicians than isokinetic dynamometry.
In this study, BB players demonstrated slightly higher levels of strength in their throwing shoulders compared to the non-throwing shoulders (Table 2). However, the ratio of strength between the internal and external rotators for the throwing and non-throwing arm not significantly different. The strength values for the throwing shoulder internal rotators reported in this study are consistent with other studies that reported on high school pitchers and professional players with average strength that ranged from 18.7 to 25% BM.10,11,26,27 Only one study by Mullaney et al.,4 who tested 13 collegiate BB pitchers, reported higher internal rotators strength values (Appendix A). The strength of the external rotators of the throwing shoulder in this study was slightly higher than those reported in the literature for high school and professional BB pitchers that reported average strength ranging from 16.1 to 17.5% BM.10,11,26,27 Mullaney et al.4 reported strength values of the external rotators that were consistent with the current results.
The BB players internal rotators were stronger than the external rotators bilaterally, which is consistent with previous studies of high school, collegiate and professional players.1,4,7,27 This strength differential between the internal and external rotators has been reported for BB pitcher and non-pitchers.8,9 Cook et al.9 suggested that this may be a natural imbalance of the shoulder musculature. Hurd et al.26 found that the strength of the internal rotators was positively associated with the peak shoulder external-rotation moment. They postulated that the demands on the posterior musculature during pitching are associated with the need to counterbalance the limb acceleration produced by the internal rotators.26
The results of this study demonstrated that the strength of the throwing and non-throwing shoulders in SB players were not statistically different. Also, the strength of internal and external rotators of each shoulder were similar. Only one study reported the strength of the internal and external rotators for 14 high school SB players (mean age 16.5 years) and had slightly lower values than those found in this study.28
The BB players demonstrated stronger but asymmetrical shoulder strength while the SB players had weaker but symmetrical shoulder strength. These findings were consistent with Riemann et al.20 who also found that healthy young men were stronger than women, while the strength ratio of the internal and external rotators for both the throwing or non-throwing arms of men and women were similar. The authors hypothesize that the differences between DIII Collegiate BB and SB players may be gender-related as opposed to sports related adaptations.
There are a growing number of performance measures that clinicians can use to screen and evaluate athletes. The CKCUEST has been found to have excellent reliability and agreement as well as good construct, convergent and discriminant validity.14 The CKCUEST performance of the BB and SB players in this study was similar to healthy collegiate males and females.29–31 Contrarily, the performance of BB players in this study were lower than those reported for collegiate DIII male BB players,17 DI collegiate football players15 and healthy collegiate males.22 No other study has reported the CKCUEST performance for collegiate SB players.
Among the CKCUEST measures (number of touches, power and score), only the CKCUEST power showed a significant difference between BB and SB players (Table 3) and was inversely correlated with the strength of the internal and external rotators in SB players. These observations may be partly explained by gender differences and/or the fact that the SB players performed the CKCUEST from the modified push up position. When comparing the CKCUEST performance of men and women, using the power may be considered for evaluation of athletes. However, more studies are needed to confirm this finding.
A review of the literature indicated that no other studies evaluated the relationship of the CKCUEST and shoulder strength in collegiate BB or SB players (Appendix B). In this study, there was no relationship between CKCUEST and any of the throwing or non-throwing shoulder strength measures for BB players. Negrete et al.30 found no relationship between the CKCUEST and maximal throwing distance in a group of healthy recreationally active men and women. Studies included in a recent systematic review indicated that the relationship between upper extremity strength and power measures in athletes is weak and positive.14 The negative relationship found in this study between the SB players’ CKCUEST power and strength measurements may be a spurious correlation. The utilization of body weight in the calculation of CKCUEST power and the standardization of the strength measures to the individual’s body weight may explain this negative relationship.
In this group of DIII BB players, the position on the field did not seem to make a difference in any of the strength or CKCUEST measures. The majority of research for high school, collegiate and professional BB players has focused on pitchers, thus making it difficult to compare the current results of other field players to similar studies (Appendix A and B). This highlights the need for additional research that includes all field positions for BB and SB at all levels of competition to help validate reference values for the entire team.
When evaluating reference values related to HHD it is important for researchers and clinicians to consider the testing procedure (make or break test), the device used, the subjects’ ages, genders, and level of athleticism.20,32–36 There are a variety of testing positions described in the literature for measuring the strength of the internal and external rotators using a HHD including prone, supine, sitting and standing positions (Appendix A).32,37 Riemann et al.20 reported that the prone testing position (90º shoulder abduction) was associated with more external rotation force for both men and women and less internal rotation force in women than the seated neutral or 30-30-30º positions. Their strength values were consistent with the results of this study and may indicate that DIII collegiate BB and SB players have similar shoulder strength as healthy college aged adults.20 It is recommended that there be a standardized methodology of HHD when screening the shoulder strength of BB and SB players to enhance the ability for researchers and clinicians to make comparisons between groups of athletes.32,37
The limitations of this study include the single site for data collection, the use of a sample of convenience and the smaller sample size of SB players. It should be noted that the participants of this study were measured during the preseason and there is a potential for strength changes throughout the season. The difference between the shoulder strength results using HHD of this study and those listed in Appendix A may be related to the different testing methods used.
Future research should focus on the shoulder performance characteristics and biomechanical analysis of the throwing motion of all DIII BB and SB field positions to determine the unique characteristics of these groups and their associated risk for injury. Future research should also focus on the clinical usefulness of the CKCUEST to determine how it could most effectively be utilized in the clinic and on the field.
CONCLUSION
The reference values presented in this study may be used to enhance the interpretation of the examination findings related to DIII BB and SB players. BB players demonstrated stronger internal and external rotators but overall, less symmetry between and within their throwing and non-throwing shoulders when compared to SB players. Although the CKCUEST number of touches or score were not correlated to the isometric strength of the internal or external rotators nor differentiated between BB and SB players, the CKCUEST power did and may be considered for the evaluation of athletes.
Conflict of Interest
Authors have no conflict of interest related to this manuscript