Introduction
The internal oblique (IO), external oblique (EO) and transversus abdominis (TrA) are deep abdominal muscles involved in many functions such as breathing,1 postural control2 and during performance of functional activities and sports.3 The TrA in particular has been the focus of many studies.4,5 This muscle works in synergy with the multifidus, the diaphragm and the pelvic floor muscles to ensure lumbopelvic stabilization.4,5 The TrA also plays a key role in anticipatory postural control.2 This type of postural control is described as an involuntary TrA contraction, planned and coordinated by the central nervous system, prior to a movement of a limb to provide initial stability of the trunk during physical activities.6 Impairment in core muscles activation7 and postural adjustments8 has been observed in older adults, which could potentially contribute to the high prevalence of low back pain episodes in this population. Evidence suggests that alterations in core muscle recruitment and injury risk exists and that appropriate training may reduce injury.9 Therefore, alteration in TrA activation often serves as a rationale for sports rehabilitation exercise programs. Since most studies on TrA structure and function involve young participants,10–12 there are gaps in knowledge on age-related changes in deep abdominal muscle structure and TrA function. Increasing numbers of people aged 40+ are participating in Master sport activities, and this relationship needs to be investigated so that physical therapists know whether the changes they observe during an assessment are due to normal aging or a pathological condition.
Ultrasound (US) imaging is now commonly used by physical therapists to evaluate muscle structure and function, or as a biofeedback tool for rehabilitation of neuromuscular control.13 Abdominal muscle structure and activation can be assessed with this imaging technology.14,15 Structure measurements refer to morphometric parameters like thickness. Muscle activation can be quantified by differences in muscle thickness measured while the muscle is in a contracted and relaxed state.14 US imaging techniques have been reported to show higher reliability and validity in measuring thickness and muscle activation compared to more conventional methods such as magnetic resonance imaging16 or EMG.17 Two US studies on age-related changes in abdominal muscles concluded that the EO and IO muscles were thinner in older individuals compared to younger people.18,19 However, the differences in TrA thickness were small or not statistically significant. Since these studies were conducted in women only, there is insufficient evidence to conclude on age-related US imaging features of abdominal muscles. Furthermore, the association between abdominal muscle activation patterns and age is not yet clearly established. The few studies that have investigated this topic used EMG with conflicting results and did not specifically focus on TrA activation.20–22 Diminished abdominal muscle activation during various tasks was found in older adults by Hanada et al.20 and Caix et al.,21 whereas Peach et al.22 demonstrated greater activation of these muscles during trunk movement. More research is needed to shed light on the association between age and TrA activation.
To comprehend their function, muscles and their associated connective tissue (their fascia), should not be regarded as isolated tissue, but as an integrated functional myofascial unit.23 As with any muscle in the body, the abdominal muscles are embedded in intramuscular connective tissue (the perimysium and endomysium) and are surrounded by a thin layer of dense connective tissue (the epimysial fascia).24 Epimysial fascia plays a key role in the transmission of muscle force during contraction.25 One key characteristic of age-related muscle decline is sarcopenia, progressive atrophy characterized by an increase in connective tissue and a decrease in muscle fiber volume.26 One possible avenue for a better understanding of impaired muscle activation with age is examining the changes in the connective tissue, which tends to dehydrate, to store additional collagen and to thicken.27 With this in mind, it seems logical to assume that age-related modifications of the TrA fascia combined with muscle atrophy could impair TrA activation. Therefore, important information about the association between TrA activation with age may be missed if the role of the fascia is not considered.
The primary objective of this study was to investigate the association between TrA myofascial structure and activation with age in a population of healthy adults aged 18 to 80. We hypothesized that a negative correlation with age would be observed with the TrA muscle component of the unit, but that the correlation would be positive with respect to the epimysial fascia component; we also postulated that a negative correlation with age would be observed with TrA activation. As a secondary objective, the association between IO and EO myofascial structures with age was investigated to provide a more complete portrait of the age-related changes of all the deep abdominal muscles.
Methods
Study Design
A cross-sectional study was conducted at the Research center of the CHUS, CIUSSS de l’Estrie, Sherbrooke, Canada. Data were collected between July 2018 and March 2020. This project was approved by the institutional review boards. All participants provided signed informed consent prior to participation.
Participants
Eighty-six participants (men and women) between 18 and 77 years of age were recruited via convenience sampling from the recruitment bank of the Research Center on Aging, CIUSSS de l’Estrie – CHUS, Sherbrooke, Canada and from posters displayed around campus. In this study, normal aging was characterized as the absence of acute or chronic disabling diseases; the ability to meet one’s health, housing, food, and leisure needs; and the possibility of leading an active and satisfying life. Based on these elements and inspired by the Baltimore Longitudinal Study of Aging,28 the inclusion criteria were: 1) aged between 18 and 80 years, 2) good general health (no chronic condition limiting activities or requiring punctual care), 3) independent community dwellers (had no difficulties in performing self-care or activities of daily living), 4) able to walk independently for short distances (at least 400 meters) without experiencing any shortness of breath. Exclusion criteria were: 1) a body mass index greater than 30 kg/m2; 2) an elite or active competitive athlete; 3) a history of spinal, abdominal, thoracic, or lower extremity surgery in the past two years; 4) known neurological disorder, respiratory condition (e.g.: chronic obstructive pulmonary disease) or structural scoliosis; 5) previous TrA-specific training experience; 6) back pain in the previous 12 months or pain elsewhere in the previous 7 days.29 A sample size of 85 participants was needed, considering an expected correlation coefficient of 0.3 (Cohen’s medium effect size30), a power of 80% and an alpha of 0.05.
Experimental procedure
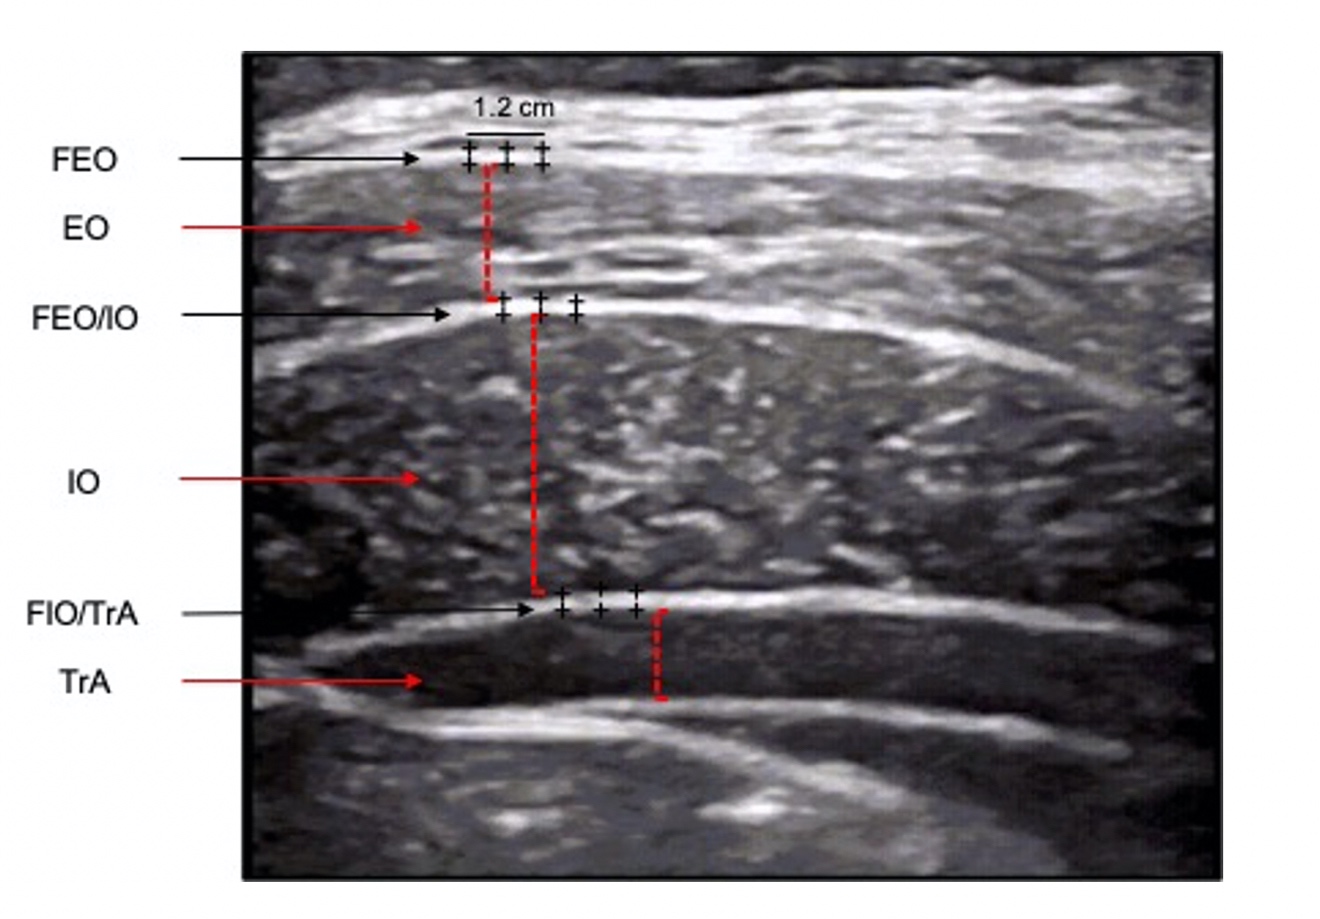
Upon their arrival at the laboratory, participants completed a questionnaire that included questions about their age and general health. Height and weight measurements were taken and an US examination was performed. All participants were assessed in a standardized supine position with knees flexed at 90°. Ultrasound measurements (GE Logic e, 13 MHz linear probe, B-mode) were performed by two physiotherapists trained in musculoskeletal US imaging, having used this technique in their daily rehabilitation practice for 3 and 5 years, respectively. The abdomen was exposed and US gel was used at the skin-probe interface to optimize acoustic transmission. The probe was positioned midway between the 12th rib and the iliac crest in the transverse axis, and then was moved laterally over the anterior axillary line until the rim of the thoracolumbar fascia was at the edge of the screen. This provided a clear image of the three abdominal wall muscles (EO, IO and TrA – see Fig. 1).10,29 The use of anatomical landmarks (as opposed to superficial skin landmarks) improved reliability and coincided with clinical practice.11 Three images were captured at rest at the end of expiration. Then, participants were taught about the anatomy of abdominal wall muscles and were instructed on how to engage their TrA using a validated, standardized hollowing (drawing-in) maneuver: “Breathe in, breathe out, and draw your navel in towards your spine.”31 They were taught to ‘read’ the US image to monitor their performance throughout the training session. The education (5 min) and training (10 min) sessions lasted 15 minutes in total. All participants successfully activated their TrA within five trials or less, and a total of 10 repetitions was asked to consolidate their learning of the task.32 After a five-minute break, the US machine was positioned so that participants could not see the screen. They were then asked to engage their TrA again after the same standardized hollowing manoeuvre instructions were given. The contraction was held for two seconds; three TrA contractions were performed (with 60 sec rest between each contraction) and one image was captured per contraction. All images were captured on the left side and at the end of expiration to standardize the effect of breathing.11 All images were anonymized and stored on the US machine’s hard drive for analysis.

Outcome Measures
Myofascial structure of the TrA, IO, and EO: In this study, myofascial structure refers to the thickness of the muscles and their related epimysial fascia. All thickness measurements were carried out by a third physiotherapist blinded to the study with 7 years of experience in musculoskeletal US imaging. On US images, fasciae are seen as linear hyperechoic lines representing the fibrous connective tissue layers, adjacent to a hypoechoic band of muscular tissue.
Muscle thickness measurements were made at the thickest part of each muscle, in a direction perpendicular to the skin with the US machine’s built-in calipers and measurement software. The thickness of a given muscle corresponded to the distance between one caliper positioned on the superior border of hypoechoic muscle band and another caliper positioned on the inferior border. Thickness measurements were taken on the three images taken at rest, and the mean value was used for analysis. The intraclass correlation coefficients (ICC) for interrater reliability reported with this measurement technics are greater than or equal to 0.95.11
Thickness of the epimysial fascia was measured for the following structures: the anterior fascia of the EO muscle (superior relative to the US image) (FEO), the fascia between the EO and IO muscles (FEO/IO) and the fascia between the IO and TrA muscle (FIO/TrA). Thickness measurements of the posterior TrA fascia were not taken due to inconsistencies and poor resolution. The thickness of all epimysial fasciae corresponded to the distance between one caliper positioned on the superior border of the hyperechoic lines and another caliper positioned on the inferior border (ICC = 0.83 for interrater reliability).33 Three thickness measurements were made for each epimysial fascia at equidistant intervals (0.4 cm) along a length of 1.2 cm (Figure 1). The mean of these three values was calculated for each of three images, and the mean fascia thickness of all three images was used for statistical analysis.
TrA activation: The standardized drawing-in maneuver requires the TrA to be active at low level of force. Hodges et al.14 showed that TrA activation measured with US imaging accurately reflect the intensity of contraction at relatively low levels (up to 20% of maximal voluntary contraction). In the present study, TrA activation was characterized by the Activation Ratio (AR).34 The TrA AR represents a participant’s ability to contract the TrA and is obtained by dividing the absolute TrA thickness (in mm) during contraction by the absolute TrA thickness at rest (see below).
TrA AR=TrA contractedTrA at rest
Statistical analysis
The Shapiro-Wilk test was performed to test the normality of the distribution. Mean, standard deviation (SD), minimum, maximum, and percentage values were used to describe the participants and outcome measures (muscles and fasciae structure and TrA activation). To complement the description of the metrics, Kruskal-Wallis and Steel-Dwass-Critchlow-Fligner tests were carried out to verify if there was a significant difference in thickness between the three muscles and between the three fasciae of interest. Mann-Whitney U tests were performed to compare muscle and fascia thickness between men and women. To achieve the primary objective of the study, bivariate correlation coefficients were used to investigate the association between myofascial structures and TrA activation with age. Because of the presence of normally distributed data for two variables (TrA AR and TrA muscle thickness) out of eight, we chose to calculated Pearson’s correlation coefficients (r) and Spearman’s rank correlation coefficients and since the results confirmed no difference between parametric and nonparametric approaches, only nonparametric statistics are reported. The guide established by Akoglu et al. was used to interpret the strength of the correlations (<0.4=weak, 0.4-<0.7=moderate, 0.7-0.9=strong, >0.9=very strong).35 Finally, hierarchical regression analyses were conducted to explain the variance of TrA activation considering TrA muscle thickness, TrA epimysial fascia thickness (FIO/TrA) and age as explicatory variables. The level of significance for all analyses was set at p < 0.05.
Results
Participants
A total of 86 participants (52 women and 34 men) were recruited; the participants’ characteristics are presented in Table 1.
Descriptive statistics for myofascial structure and TrA activation
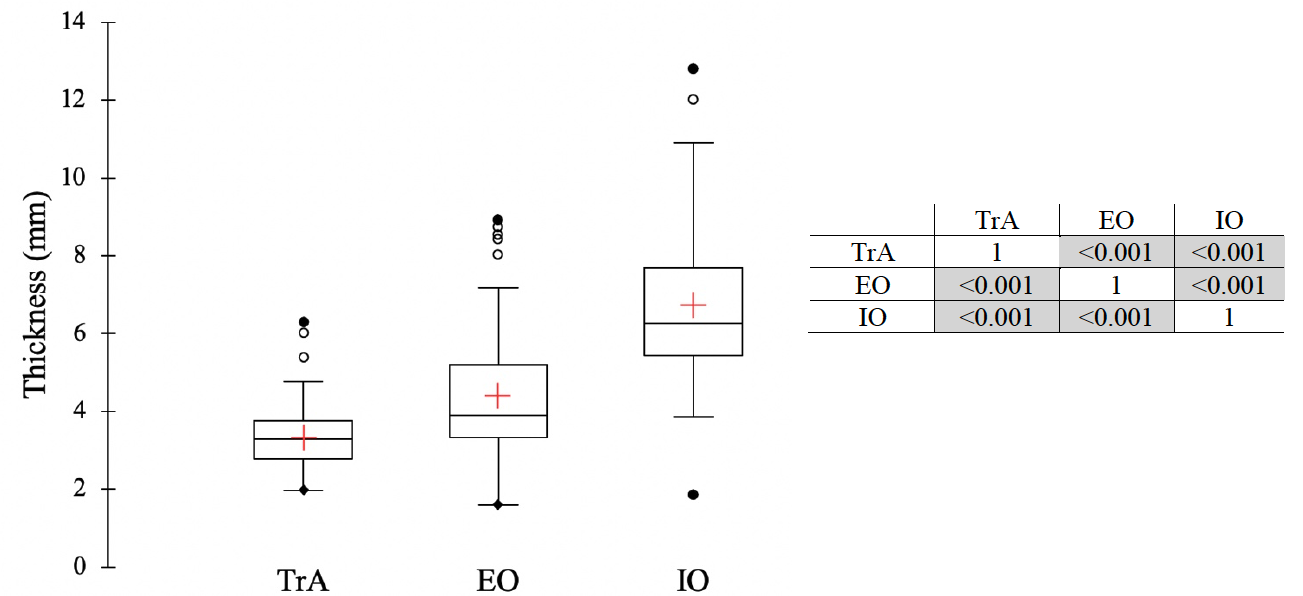
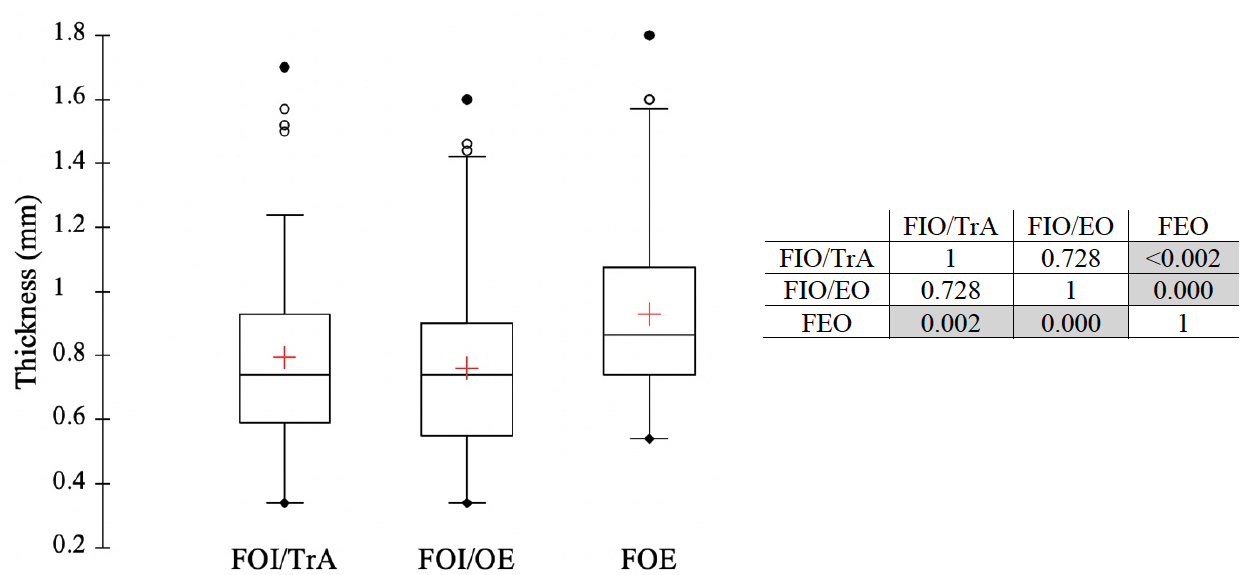
Mean (±SD) values for the three muscles and fasciae structure and for TrA activation outcomes for all participants and for men and women are presented in Table 2. The results of the Mann-Whitney tests for the muscle and fascia thickness comparisons between sexes showed that men had significantly greater muscle thickness than women; however, no significant differences were found between sexes for fascia thickness and for TrA activation. The results of the thickness comparisons between the three muscles and between the three fasciae are shown in Figure 2 and Figure 3, respectively. For the muscle thickness comparisons, as shown in Figure 2, a significant pattern (p<0.001) of increasing order of median abdominal muscle thickness was found: TrA < EO < IO. A significant difference in fascia thickness was only observed with the comparison between FEO and FIO/EO and between FOE and FIO/TrA; p values are presented in Figure 3.


Associations between myofascial structures and TrA activation with age
The Spearman’s rank correlation coefficients for myofascial structures and TrA activation with age as independent variables are presented in Table 3. Moderate, negative significant correlations were found for the muscle thickness of all three muscles (as dependant variables) and age = -0.66 for EO, -0.51 for IO and -0.59 for TrA), indicating that the thickness of these three muscles decreases with age. Moderate, positive significant correlations were found for the thickness of FEO and FIO/EO with age = 0.39 for FEO and 0.54 for FIO/EO), whereas a strong positive correlation was found for FIO/TrA = 0.74). These data demonstrate that fascia thickness increases as people age. With respect to correlations for TrA activation with age, a moderate, significant negative correlation was found for the activation ratio (TrA AR). In other words, TrA activation seems to decrease with advancing age.
Hierarchical regression analysis was used to explain TrA AR with age, gender, TrA muscle thickness and TrA fascia thickness (FIO/TrA). The results are presented in Table 4. The first model showed that age accounts for 19.5% of the variance of TrA AR (F1,84 = 20.295, R2 = 0.195; p = 0.000). Adding sex to the model added 3.6% to the prediction of TrA AR (F1,83 = 3.848, R2 = 0.036); p = 0.05). However, adding TrA thickness did not account significantly to the variance in TrA AR (F1,82 = 0.178, R2 = 0.002; p = 0. 674), nor did the addition of FIO/TrA (F1,81 = 1.520, R2 = 0.014; p = 0.221).
Discussion
This study is the first to investigate abdominal muscular structure considering epimysial fasciae and TrA activation in relation to age, using US imaging assessments. These results demonstrate that normal aging is associated with changes in deep abdominal myofascial structures and TrA activation. The participants’ characteristics show that the sample was similar in terms of age range and proportion of men and women to the population used by Rankin et al.,36 who published one of the most definitive studies on normal reference values for thickness of the lateral abdominal muscles. They investigated a cohort of 123 participants within the same age range (20 to 72 years); this cohort also had a similar proportion of men vs. women (44% and 64%, respectively). However, the authors reported higher mean muscle thickness values for EO (6.7 mm), IO (10.2 mm) and TrA (0.50). Rankin et al. used the anterior superior iliac crest as a landmark, whereas we used the posterior rim of the thoracolumbar fascia. Therefore, the probe position used in the current study might have been slightly more posterior. This could explain the difference between the two studies. However, the mean muscle thickness values are close to those of Tahan et al.10 who also investigated a large cohort of healthy participants (n=156) comprised of 75 men and 81 women. A similar pattern in order of thickness for the lateral abdominal muscles as reported in previous studies was found (i.e. IO>EO>TrA).10,36,37 With regard to the difference in muscle thickness by sex, the current results show that men have greater muscle thickness than women, which is in accordance with the findings of other studies.10,12,36 The TrA AR values of the present study are slightly lower than those reported by Stetts et al.29 and by Teyhen et al.,11 but they are similar to those reported by Gorbet et al.38 However, comparison between studies is difficult due to the specificity of the population studied: Gorbet and Teyen involved only younger participants, whereas Stetts’ sample was composed of older adults only. Moreover, studies’ heterogeneity in the instructions given to the participants to contract their TrA or in the maneuver the participants had to perform might have led to different level of muscle activation. The maneuver used in the present study and in Gorbet’s study is normally executed at low force level and TrA activation measured with US imaging has been shown to correlate to EMG recordings.14
Abdominal fascial thickness values are reported in three other studies.12,33,39 The thickness values reported in the present study are very similar to those reported in the reliability study published by Pirri et al.33 However, their thickness measurements were based only on one participant. It would have been interesting to know whether the similarity would have continued if the data had been collected on a larger sample. The current results cannot be compared to the two other studies12,39 due to differences in methods. Neither study reported individual epimysial fascia thicknesses, but both reported the sum of all fascia thickness measurements. Even if we calculate the sum of all 3 fascia measurements, none of the 3 studies considered the same fasciae in the equation. As for Whittaker et al.,12 gender effect was not present for fascia thickness.
The results related to the primary objective of the study demonstrate that a negative correlation was found between muscle thickness and age, while a positive correlation was observed between the epimysial fasciae associated with these muscles and age. A negative correlation was also found between TrA activation and age. These results are in accordance with the authors’ hypotheses. If we look more closely at the association of muscle thickness with age, a significant reduction in muscle thickness for all muscles investigated (EO, IO, and TrA) was observed with age. A negative association between all three muscles thicknesses and age was also observed by Rankin et al36 in a population similar to that of the present study. Tahan et al10 and Ota et al19 also observed a negative association between EO and IO, but not TrA. This discrepancy with the TrA can be related to the participants’ characteristics. The population sample for the study by Ota et al. only included women. Studies have shown that a decline in muscle mass with age is more evident in men,40 which could explain why the conclusion of Ota et al. differs from the current conclusions. In Tahan et al., the sample included participants of both genders. However, the participants ranged in age from 18 to 44 years of age. As revealed in other studies40,41 investigating age-related changes in muscles mass, the age effect on TrA thickness can occur later in life, most probably over 50 years of age. Moreover, as people become less involved in functional activities requiring postural adjustments or lumbar stabilization, their TrA may be engaged less. Although the relationship for TrA atrophy with decreased activities was demonstrated in Ikezoe et al.,18 data on the physical activity level of the participants in the present study would be needed to confirm this assertion.
Interestingly, a positive correlation with age was found for all fasciae associated with the three abdominal muscles. Whittaker et al.12 did not find a significant correlation with age, but as mentioned, their fascia variable was defined as the sum of the FEO/IO, FIO/TrA and FTrA (posterior fascial layer of the TrA) in contrast to the present study, which considered different fascial layers (FEO, FEO/IO and FIO/TrA). The population in Whitaker et al. was composed of much younger participants and the effect of older age on connective tissues might not have been captured. Since the association with age was not the primary research question, the sample size was probably not large enough to have sufficient power for a correlation analysis. Fan et al.39 did not find a correlation with age but again, methodological considerations make comparisons with the results difficult, given that the fascia thickness was measured differently and that the sample was composed of women of younger age.
The present study is the first to investigate the relationship between TrA activation and age while considering both the muscle and the fascia components. The results from the bivariate analyses showed that TrA activation decreases with age. Other studies have found either an increase in abdominal muscle activation or a decline in activation with age. This discordance can be explained by methodological differences (i.e., these studies were not TrA specific, muscles’ activations measurements via EMG during different tasks).20–22 However, the strength of the correlation was moderate, indicating that TrA activation is explained by other factors. The results of the hierarchical regression analyses support this assertion, demonstrating that demographic factors such as age (19.5%) and gender explained 23.1% of TrA activation. Adding structural factors such as TrA muscle and fascia thickness indicated that these factors did not significantly explain TrA activation. Although the current results support that TrA and fascia change with age, the authors’ assumption that these structural modifications could impair TrA activation cannot be supported by the results of the present study. One possible explanation for this is that thickening of the epimysial fascia might not alter TrA activation, but thickening of intramuscular fascia (perimysium and endomysium) as seen in aging might do so.42,43 Therefore future US imaging studies could explore, for example, the percent of echogenicity (number of black and white pixels) of the TrA to better understand the role that intramuscular fascia might have on muscle activation. Moreover, normal aging is a multifactorial process involving not only modifications of myofascial structures but also a progressive decline of various organ systems, including the central and autonomous nervous systems, as well as potentially less time spent in standing and being involved in physical activity.44,45 All of these factors can have an impact on activation capacity of the TrA.46 Additionally, changes in TrA activation might be related to adapted breathing function: older people may need less oxygen, may breathe more superficially or use less of a TrA activation range. This raises a very interesting question: Could age-related TrA activation be a natural process without negative consequences?
Study limitations
The results of the present study cannot be generalized to symptomatic populations since factors such as pain, spinal pathologies and deconditioning have an impact on myofascial structures and muscle activation that go well beyond those of normal aging. Although measurement of lateral abdominal muscles is now recognized as valid and reliable, measurement of fascia thickness is a new field. Radiological anatomy studies support that the fascia can be measured with US imaging,24,47 but the reliability of these measurements has only been reported in one study which neglected to take participant variability into account. Nevertheless, we believe that the method used (i.e. taking the mean of three measurements at equidistant intervals within 1.2 cm) reduced intra- and inter-operator variability and may be more robust than taking only one measurement. Sliding of the TrA as done by Chen et al.48 would have provided useful information about age-related muscle-fascia dynamics. These results cannot be generalized to adults with chronic diseases or conditions. Lastly, as previously mentioned, other factors such as level of physical activity involving recruitment of the TrA or factors related to the functioning of the central and autonomous system during TrA activation or to breathing pattern would have provided valuable additional information to predict decline in TrA activation with age.
Conclusion
The results of the present study demonstrate that normal aging is associated with changes in myofascial structures and TrA activation. These results can serve as reference values for sport physical therapists involved in rehabilitation or in strengthening programs for older healthy individuals. Assessing these metrics with US imaging can provide valuable baseline values that can be used to monitor the effect of these programs. Age and gender are good predictors of TrA activation, but other factors should be considered to complement the understanding of the very complex nature of TrA activation.
Conflict of interest
All authors confirm that no prior or duplicate publication has been released elsewhere concerning this manuscript and that no commercial relationships which may lead to conflict of interest were associated with this work.