
INTRODUCTION
Anterior cruciate ligament (ACL) injuries can be devastating for athletes across many sports and age groups. In the United States, there are between 100,000 and 200,000 ACL injuries per year.1 Athletes who experience an ACL injury typically miss extended periods of sports participation and suffer both short and long-term consequences including functional limitations, muscle weakness, and most significantly chronic knee pain and osteoarthritis.2 Almost 30% of active individuals who undergo ACL reconstruction suffer a second ACL injury in the first two years after surgery.1,2 This increased risk exists not only for the ipsilateral limb, but the contralateral limb as well. Multiple studies have shown that contralateral injuries occur more often than ipsilateral injuries, especially in female athletes.3–5 Not only do individuals suffer subsequent ACL injuries, but individuals are at increased risk of secondary meniscus injury following ACL reconstructions. Up to 50% of individuals undergo meniscus surgery following return to play after ACL reconstruction.1,2 Predictors of primary and secondary ACL injuries include younger age and participation in sports that involve jumping, pivoting and cutting.1,2 A proposed additional risk factor includes exercise-induced decreases in a muscle’s ability to produce force or power, also known as neuromuscular fatigue.6 Neuromuscular fatigue has frequently been accepted as a risk factor, but its full role in ACL injury is not yet known. It is suggested that fatigue results in reduced muscle strength, and potential alteration in lower extremity kinematics.6,7 It is worth noting that the definition of, and factors that affect neuromuscular fatigue are numerous and defining these is outside of the scope of this study.
The primary reason for undergoing ACL reconstruction is the intent to return to sports.1,2 Health care professionals, responsible for the rehabilitation of individuals following surgery, attempt to mitigate the risk of secondary injury through the use of objective return to sport criteria. These criteria typically include the establishment of a Limb Symmetry Index (LSI) in tests such as quadriceps muscle strength, single leg hop tests, agility, etc. LSI compares the affected limb to the uninvolved limb, using the uninvolved limb as a reference standard and “healthy” control.8 Despite the use of strict return to sport criteria including LSI, under 14% of individuals meet these standards (isokinetic strength testing, hop testing, etc.) within six months.9 Current practice patterns suggest that rehabilitation professionals do not implement objective testing as frequently needed, and when these tests are implemented the standards for safe return to play (RTP) are not met.9–12
Despite numerous research studies and publications, there remains no gold standard for objective RTP criteria, and secondary injury rates remain high. It remains to be seen if LSI provide clinicians any meaningful data beyond that of symmetry. The use of the unaffected limb as a “control” may not be appropriate given that there are bilateral muscle strength, endurance, power, and rate of force development deficits following ACL injury.8 Though studies exist to assess overall resistance to fatigue (YoYo Fitness Test, Lower Extremity Functional Test), the overall effect on movement and injury risk following ACL injury remains to be seen.12 Furthermore, current assessment methods for RTP fail to account for the effects of fatigue on performance, the individuals’ overall endurance and fitness level, or its effects on movement quality.13–15 ACL rehabilitation can last anywhere from six to 12 months resulting in a significant period of changed activity levels. Investigations have shown that long periods of relative inactivity and reduced training volume result in significant reductions in functional capacity. These deficits are sustained locally in the affected limb, as well as globally throughout the rest of the body.8,9
While previous authors have attempted to determine the effect of fatigue on ACL injury risk, or to qualitatively assess fatigue’s effect on kinematics and kinetics, there has yet to be a study assessing fatigue’s effect on performance on objective RTP criteria.3,4,11As a result, the purpose of this study was to assess the effect of fatigue on performance of various hop tests used in clinical rehabilitation settings by examining LSI scores.2,8,9 It was hypothesized that individual hop distances would be lower for the operative limb (ACLR) than the non-operative limb (CON) in a fatigued state (FS), and that overall LSI scores would be lower in the fatigued versus non-fatigued states (NFS).
MATERIALS AND METHODS
Participants
Approval was first obtained by the Houston Methodist Institutional Review Board (IRB) and written informed consent and/or parental permission were obtained prior to testing from all participants and/or the parent/guardian. This study included individuals undergoing rehabilitation following ACLR (n=21). Participants were recruited from physical therapy clinics within the local hospital network between 2018 and 2020. All participants were at or after six months post-operative, and had been deemed ready for RTP testing by their treating rehabilitation specialist or physician. Each participant passed objective testing with >90% limb symmetry in the clinic or rehabilitation setting with their respective rehabilitation specialist (including Y-balance testing, single leg step down test, 1 repetition max testing for leg press and hamstring curl, and isometric strength testing via hand-held dynamometer). Specific inclusion criteria included (1) unilateral ACLR, (2) completion of formal rehabilitation program following surgery (including, but not limited to: strength and conditioning training, power and plyometric training, and agility training) (3) deemed appropriate for RTP testing by treating rehabilitation specialist, and (4) planned to return to cutting and pivoting sports. The rehabilitation program after ACLR was not monitored or controlled by this study. Participants were included in this study regardless of graft type (patellar bone-tendon-bone autograft, hamstring tendon autograft, and allograft). Additionally, those with meniscus repair or partial meniscectomy at time of ACL reconstruction were included. Exclusion criteria included (1) age <16 or >50, (2) further injury or surgery that would preclude standardized rehabilitation protocols for ACL rehabilitation.
Objective Criteria Measures
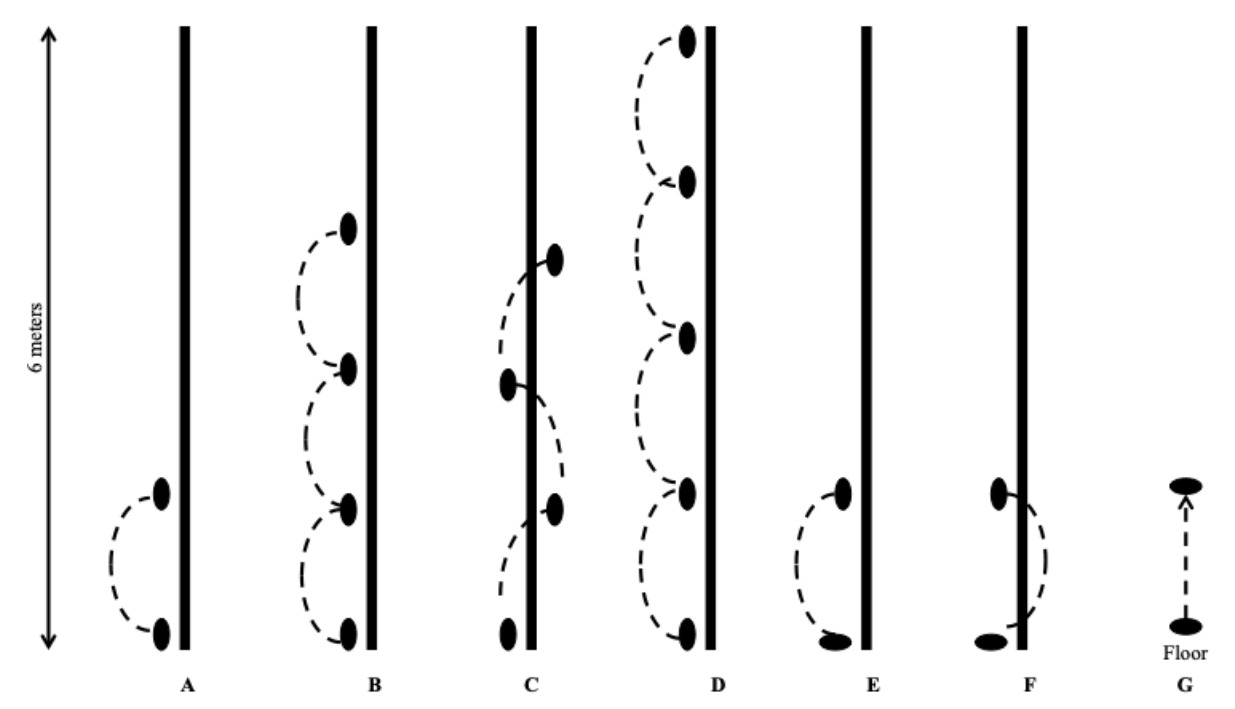
Objective criterion for RTP used in this study were based on recommendations in the literature. This included quadriceps and hamstring strength measurements, and single leg hop tests (single hop, triple hop, crossover hop, 6-meter timed hop, vertical jump, medial rotation hop, lateral rotation hop, and vertical jump).1–3,6–9,15 The selected measures were determined based on common tests seen in the literature to assess single and multi-planar movement ability, power production, and neuromuscular control. (Figure 1). Prior to all testing, participants completed a 15-minute dynamic warm-up including high knees, butt kicks, leg swings, lateral shuffles, carioca shuffles, A-skip, and other activities designed to prepare individuals for movement as directed by their treating therapist.
Participants completed two separate hop testing sessions after they met inclusion criteria. Testing consisted of a NFS test session (control test), and a FS test session; each performed on a separate day within one week of the first test session to prevent any variance in results due to neuromuscular or strength adaptations. Participants were randomized to perform testing in a NFS or a FS first based on enrollment in the study; with odd numbered participants performing NFS testing first, and even numbered participants performing FS testing first.
Fatigue Protocol
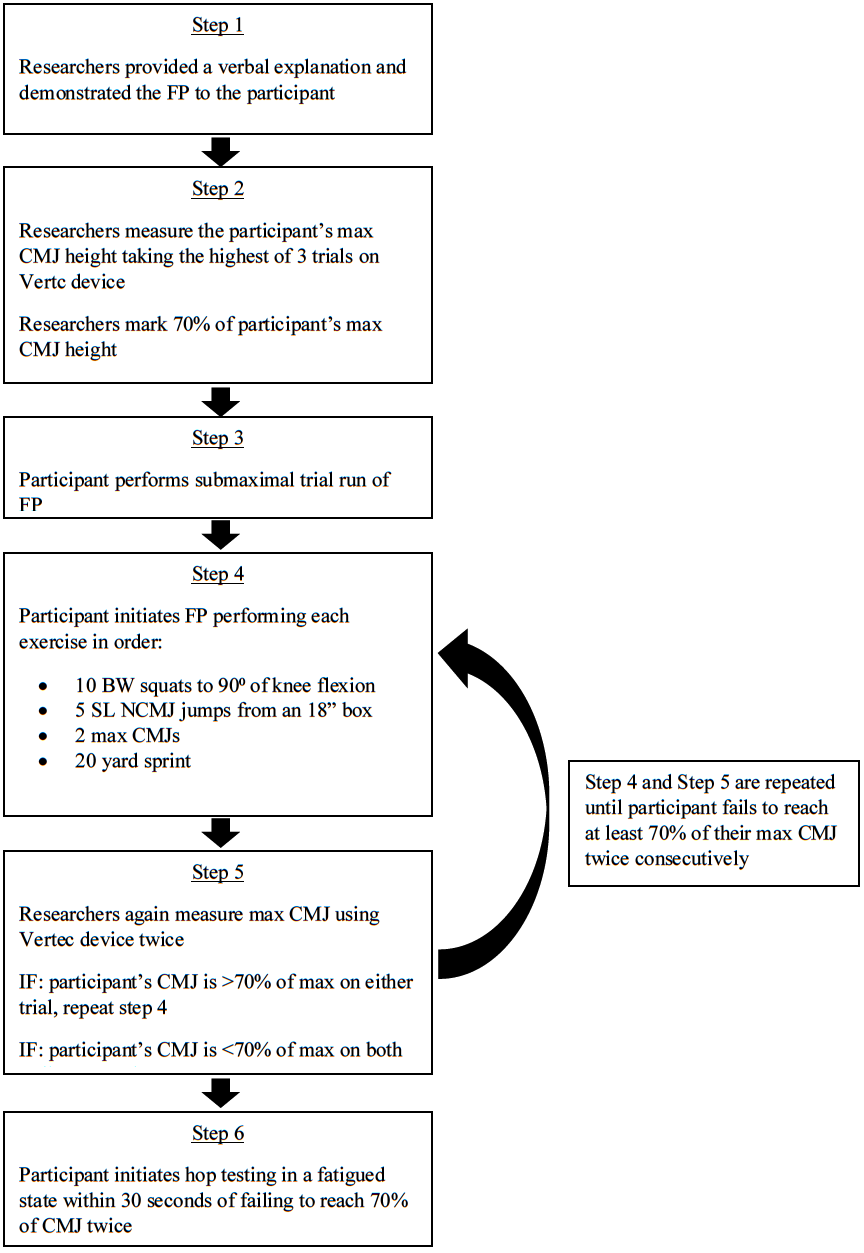
To achieve fatigue in participants prior to FS testing, a fatigue protocol was developed based on existing literature (Figure 2).16–20 Prior to performing single leg hop tests, participants performed the fatigue protocol until achieving fatigue. Fatigue was defined as an inability to reach 70% of maximal counter-movement jump (CMJ) height two times consecutively.15,17,18 First, maximal CMJ was measured with a vertical jump height device (Vertec, PeformBetter, Rhode Island, US) by taking the highest of three trials for maximum jump performance.19 Researchers calculated and marked 70% of the participants maximal CMJ on the Vertec. Participants then performed one practice trial of the activities within the fatigue protocol that consisted of four exercises performed consecutively upon completion. Exercises were performed in the following order: 10 bodyweight squats to at least 90 degrees of knee flexion, five single leg non-countermovement jumps from a standard 18 inch box, two maximal CMJs, and a 20 yard sprint. Close observation was provided throughout the fatigue protocol to ensure quality movement and appropriate effort throughout. After completing the protocol, participants re-tested maximal CMJ with the Vertec two times consecutively; if participant’s new CMJ height was greater than the 70% fatigue threshold, they were directed to perform the fatigue protocol again. Once the subjects’ CMJ fell below 70% on two consecutive attempts, the fatigue protocol was terminated.
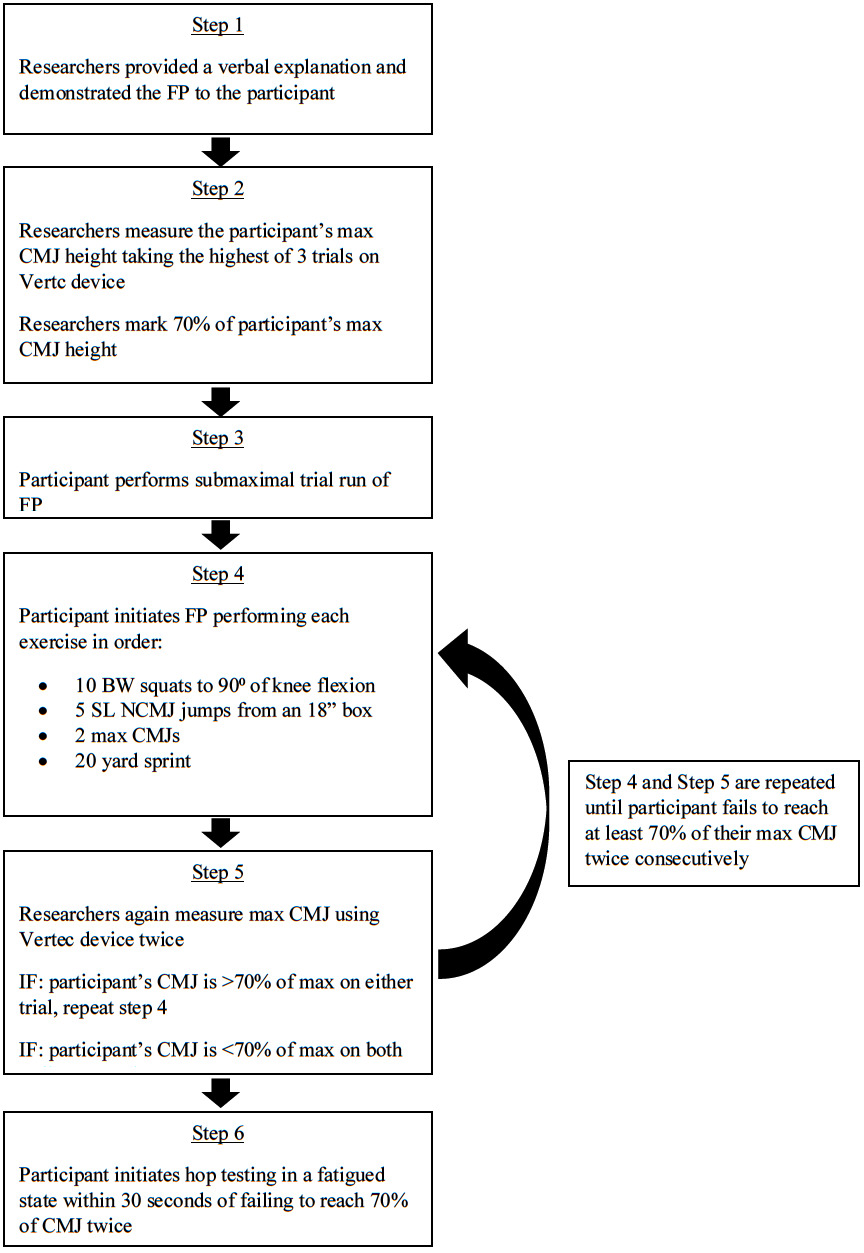
Upon achieving fatigue as defined by this study, participants were asked to give a rating of perceived exertion (RPE) for their overall perception of fatigue. Participants were shown a standard Borg RPE scale, from 6 to 20; 6 meaning “no exertion at all” and 20 meaning “maximal exertion”.15 RPE is commonly used to determine activity and session intensity and was developed to estimate individual’s heart rate based on how they feel.15 Single leg hop testing was then initiated within 30 seconds of completion of the fatigue protocol to ensure fatigue was present during testing.
Single Leg Hop Tests
Participants performed the seven single leg hop tests in the following order: single hop for distance, triple hop for distance, crossover hop for distance, 6-meter timed hop, lateral rotation hop for distance, medial rotation hop for distance, and vertical jump for height. Four of these hop tests are commonly used clinically and have good measurement reliability in individuals following ACL reconstruction.20 Participants completed a practice trial for each hop prior to performing three measured trials for the ACLR and CON limb, with limbs being tested in random order. Participants were given sufficient attempts, within reason, to successfully achieve three hops where they “stuck the landing”; meaning they were able to maintain single limb balance for >2 seconds after landing. If participants were unable to achieve three successful hops, data was recorded for the number of available hops. Quality of these jumps was not assessed as without motion capture technology this is a purely subjective measure, and is beyond the scope of the current study. The average of the three trials was utilized to calculate a LSI for hop testing: for distance and height measures LSI = (ACLR average/CON average) x 100%; for 6-meter timed hop LSI = (ACLR average/CON average) x 100%. A total LSI for all seven single leg hop tests was created as the mean of each individual score. A LSI less than 100% represents a deficit in the involved limb.
Statistical Analysis
All data were analyzed using SPSS (version 23.0 for Windows, SPSS Inc., Chicago, Illinois). A 2 (fatigue state) by 2 (limb) mixed model ANOVA was used to determine and compare the effects of fatigue within and between each limb (operative & non-operative). Significant interactions indicated by Type III tests of fixed effects were then followed by a Tukey’s post-hoc test for pairwise comparisons. In addition, a paired samples t-test was used to compare the ratio of ACLR to CON limb measures in the NFS and FS. The threshold for statistical significance was set at p<0.05. For all significant pairwise comparisons, effect size was calculated using a Cohen’s d statistic whereby effect size (ES) was interpreted as follows: <0.1, Negligible (N); 0.1-0.3, Small (S); 0.3-0.5, Moderate (M); 0.5-0.7, Large (L); >0.7, Very Large (VL).21–25
RESULTS
There were a total of 21 subjects in this study (15 male, 6 female) and their demographic and testing information can be found in Table 1.
Hop Testing Results
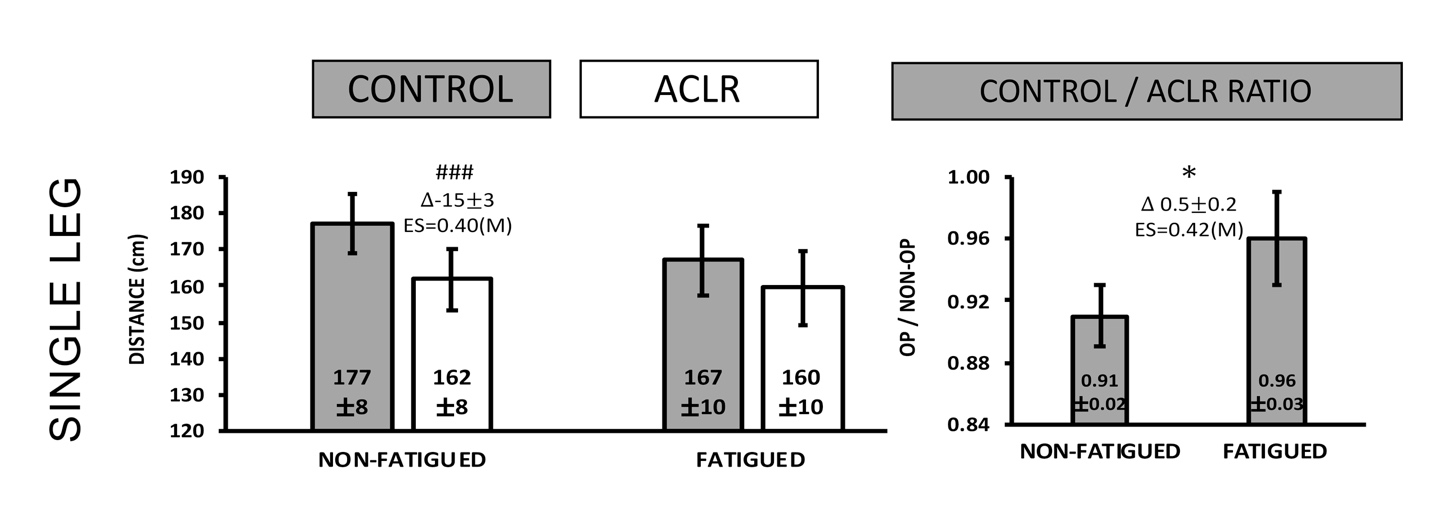
Single Leg (Figure 3A): The ACLR limb was observed to have reduced hop distance compared to the CONTROL limb in the NFS [p=0.0002, Mean Individual Diff.= -15±3cm, ES=0.40(M)] that was not observed in the FS. This resulted in a significant change in CON / ACLR limb symmetry between the NFS and the FS [p=0.010, ES=0.42].

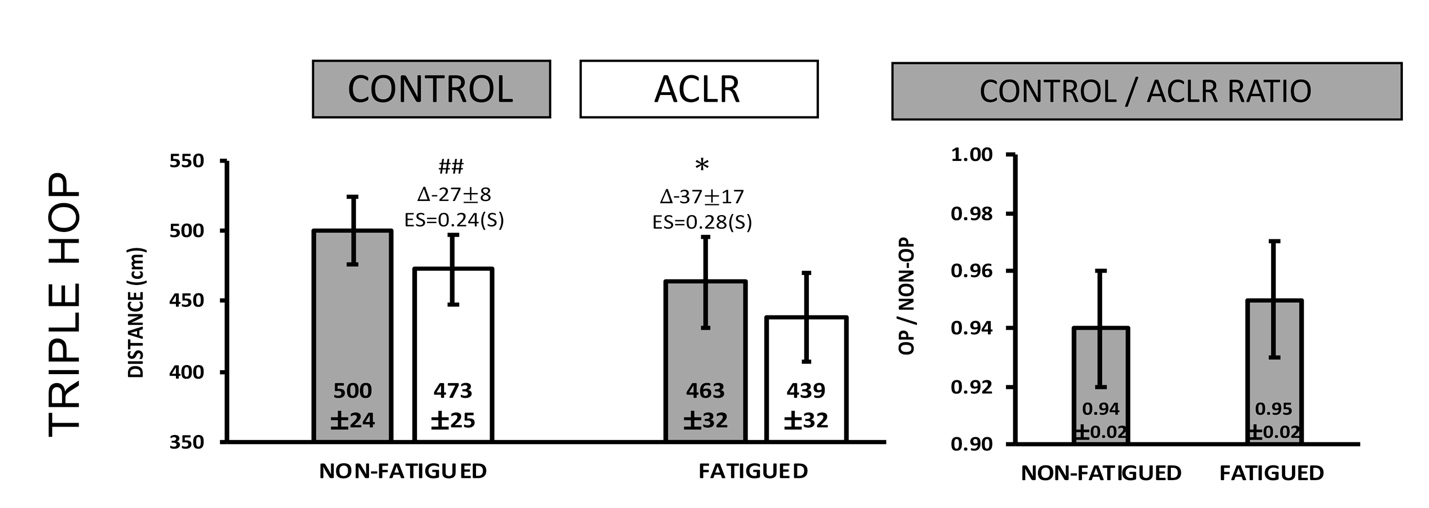
Triple Hop (Figure 3B): The ACLR limb was observed to have reduced hop distance compared to the CON limb in the NFS [p=0.005, Mean Individual Diff.= -27±8cm, ES=0.24(S)] that was not observed in the FS. Only the CON limb was observed to have a decrease in hop distance between the NFS and FS [p=0.045, Mean Individual Diff.= -37±17cm, ES=0.28(S)].

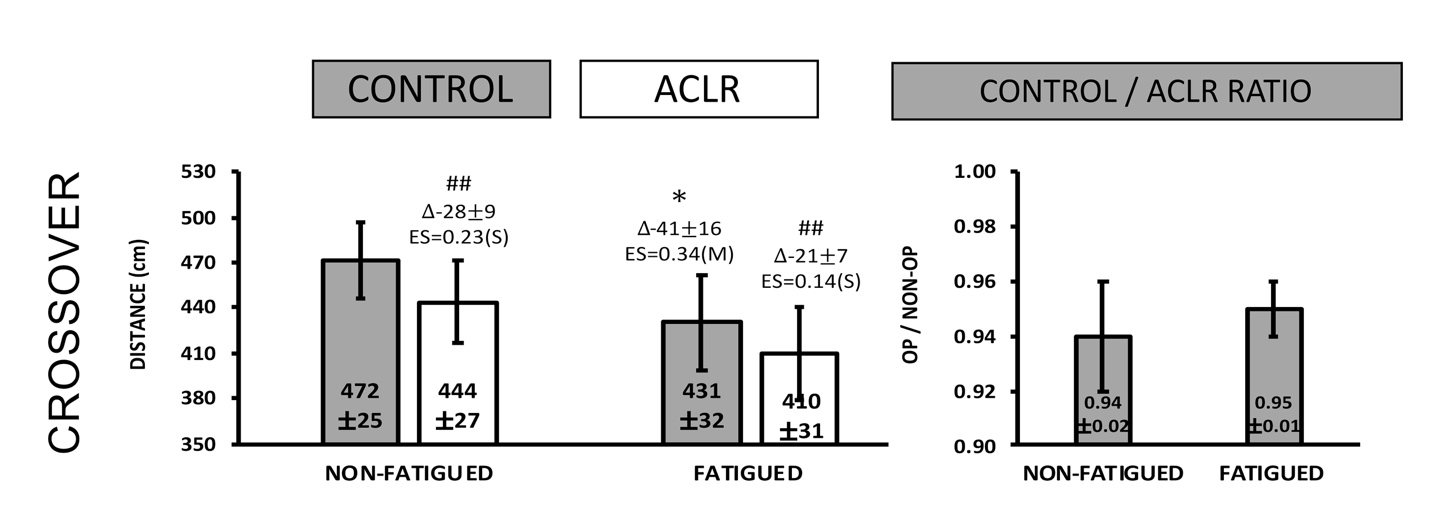
Crossover (Figure 3C): The ACLR limb was observed to have reduced hop distance compared to the CON limb in the NFS [p=0.008, Mean Individual Diff.= -28±9cm, ES=23(S)] and FS [p=0.005, Mean Individual Diff.= -21±7cm, ES=14(S)]. Only the CON limb was observed to have a decrease in hop distance between the NFS and FS [p=0.016, Mean Individual Diff.= -41±16cm, ES=0.34(M)].

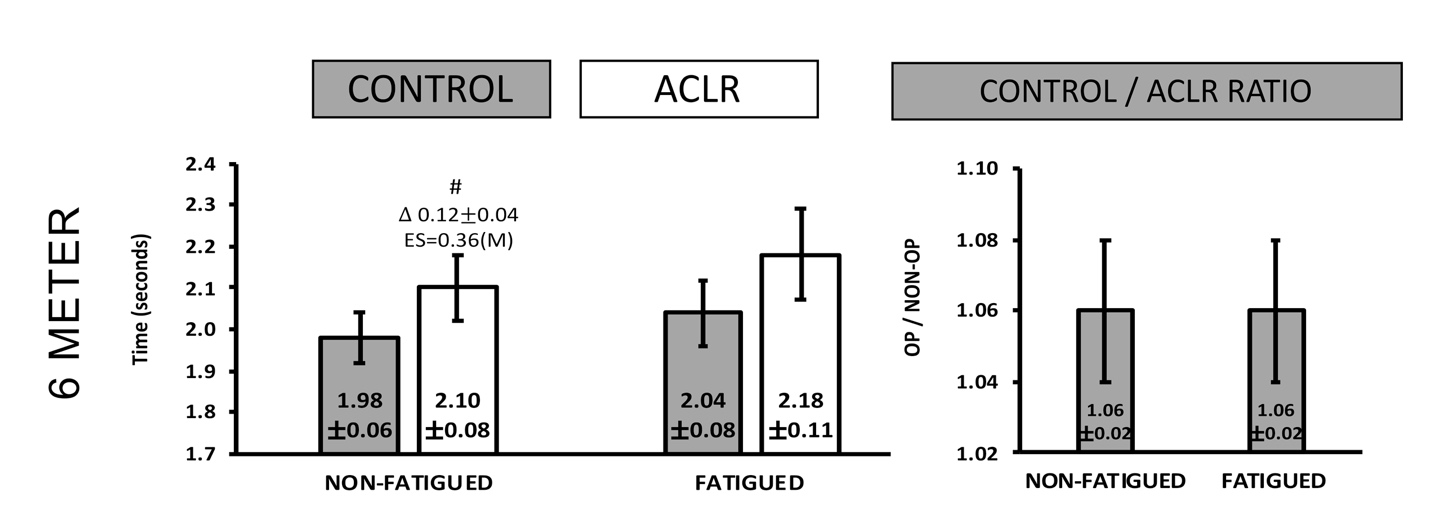
6 Meter (Figure 3D): The ACLR limb was observed to have an increased 6 Meter hop time (reduced performance) compared to the CON limb in the NFS [p=0.014, Mean Individual Diff.= 0.12±0.04 seconds, ES=0.36(M)] that was not observed in the FS.

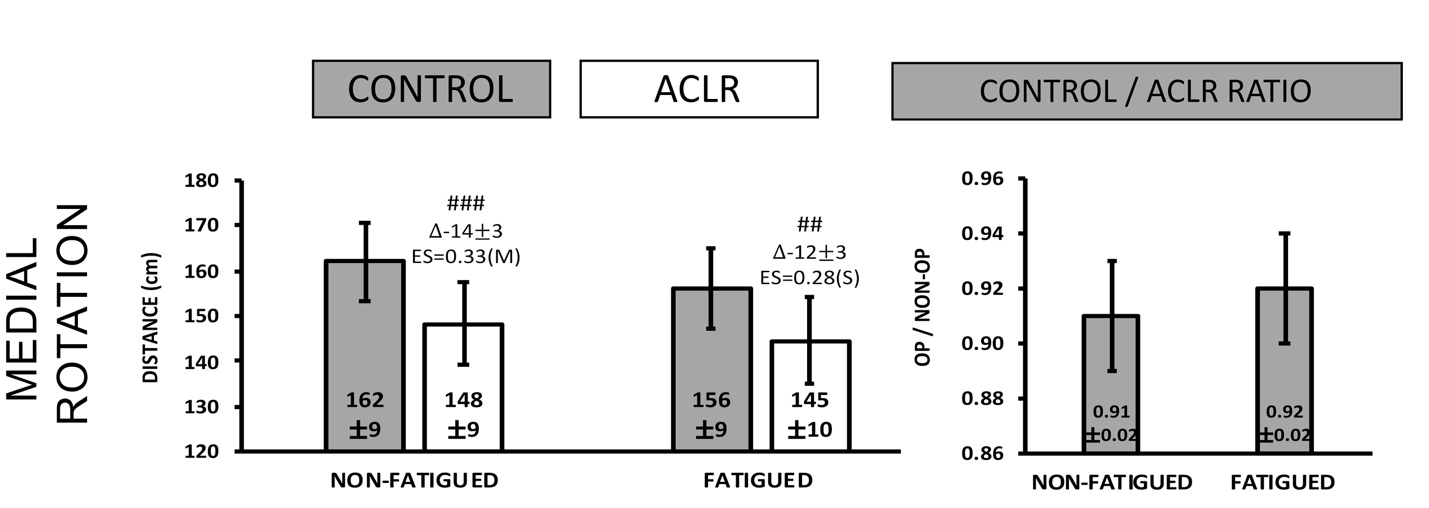
Medial Rotation (Figure 3E): The ACLR limb was observed to have reduced medial rotation compared to the CON limb in the NFS [p=0.0002, Mean Individual Diff.= -14±3cm, ES=0.33(M)] and FS [p=0.003, Mean Individual Diff.= -12±3cm, ES=0.28(S)].

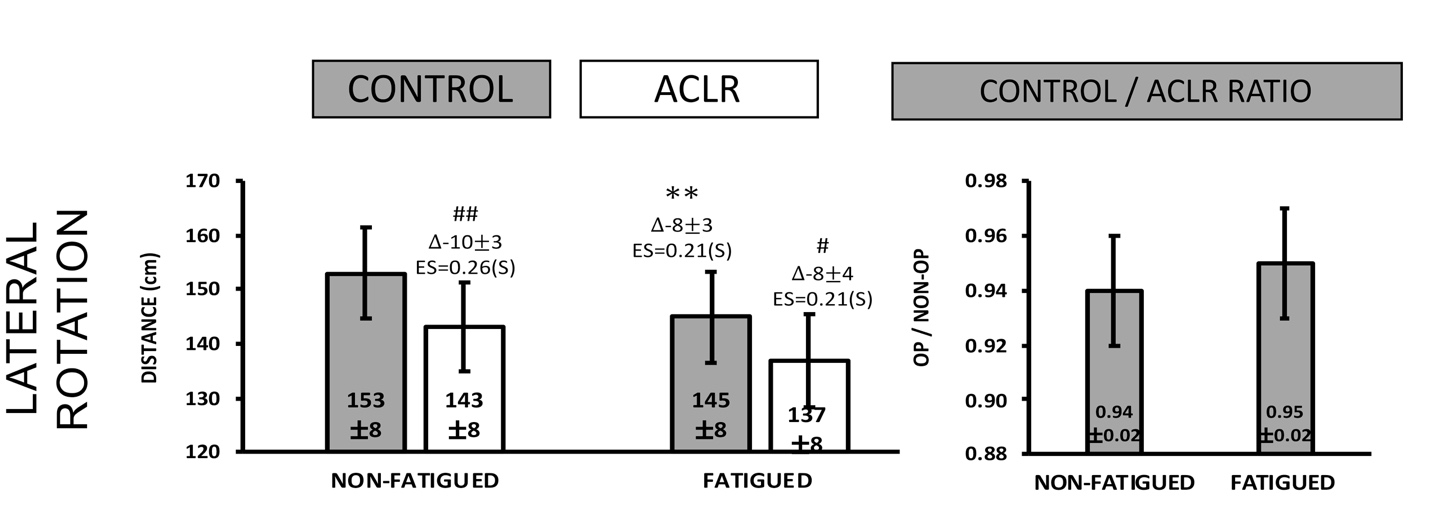
Lateral Rotation (Figure 3F): The ACLR limb was observed to have reduced lateral rotation compared to the CON limb in the NFS [p=0.002, Mean Individual Diff.= -10±3cm, ES=0.26(S)] and FS [p=0.032, Mean Individual Diff.= -8±4cm, ES=0.21(S)]. Only the CON limb was observed to have a decrease in hop distance between the NFS and FS [p=0.009, Mean Individual Diff.=-8±3cm, ES=0.21(S)].

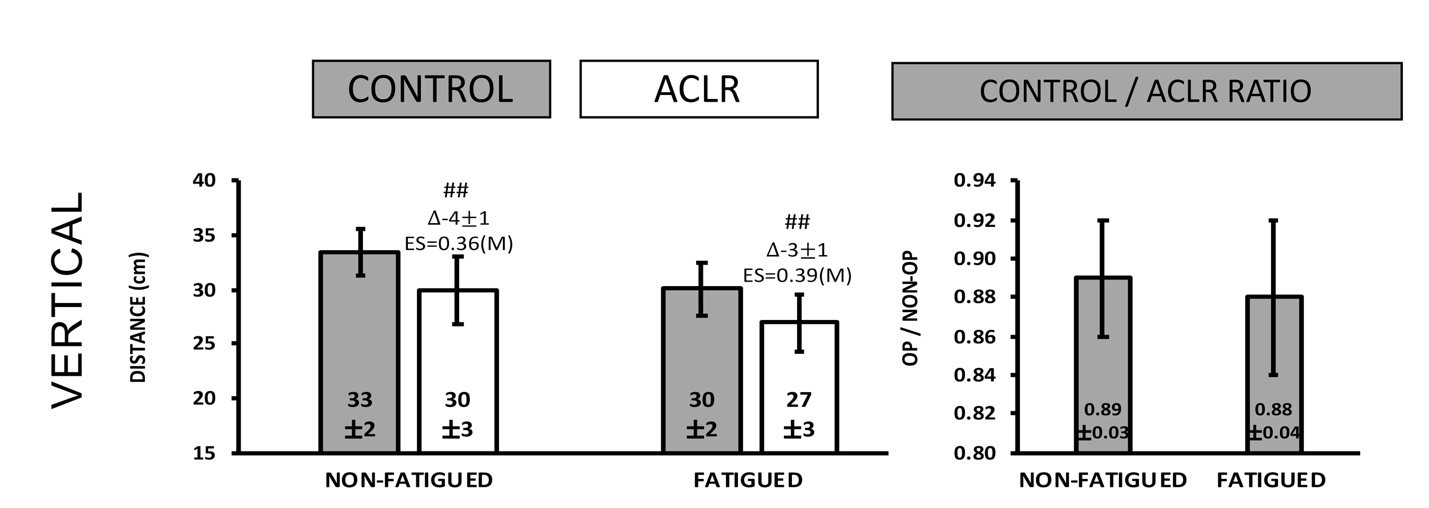
Vertical (Figure 3G): The ACLR limb was observed to have reduced vertical hop height compared to the CON limb in the NFS [p=0.002, Mean Individual Diff.= -4±1cm, ES=0.36(M)] and FS [p=0.004, Mean Individual Diff.= -3±1cm, ES=0.39(M)].

DISCUSSION
The purpose of this study was to assess the effect of fatigue on LSI during the performance of hop tests in non-fatigued versus fatigued states, post-ACLR with the intention of informing RTP decision making. Results from this study showed that in a NFS, the CON limb generally exhibited improved performance versus the FS on several hop tests. Additionally, in the NFS, participants were able to jump further, higher, and faster on their CON limb as compared to their ACLR limb. Conversely, in a FS, an ACLR to CON comparison indicates that jump distance, heights, and times were closer in magnitude. These results did not support the researcher’s original hypothesis that a fatigued state would have a greater effect on the ACLR limb. However, the most relevant finding of this study was that fatigue had a greater effect on the non-operative (CON) limb. Although the magnitude of differences within and between limbs across differing states of fatigue was generally small to moderate (ES=0.14 – 0.40), these data may provide useful information for future studies that examine fatigue and return to sport protocols, and highlight the potential role of fatigue as it pertains to injury risk for the non-operative limb in the early phases of return to sport participation.
A litany of research has been performed on the rehabilitation aspect of ACL reconstruction to date. However, there has been relatively little consensus throughout the literature on which measures are most clinically appropriate and whether or not fatigue should be considered during examination. Based on results of the current study, clinicians can be better informed on the clinical relevance of LSI and how fatigue may affect reported scoring measures.
Possible factors contributing to the current results include: (1) an overall detraining effect as a result of injury, surgery, and inactivity, and (2) a greater effect of said detraining on the unaffected limb as a result of increased focus by rehab clinicians on the operative limb. Previous authors have suggested that detraining occurs bilaterally as a result of injury and lengthy periods of altered activity levels.8,9,26–31 Future studies should attempt to screen for endurance prior to testing, but it remains possible that the current results indicate a neglect of the unaffected limb during rehabilitation, or a reduced resistance to fatigue.
Tests of limb symmetry are the most commonly used and reported objective criteria for determining readiness for RTP.6,8,9,26,27,29 Scores of <90% are indicative of a higher risk for re-injury, and current clinical commentary defines >95% as a more meaningful score for a successful and efficacious return to sport.8,29,30 These studies propose caution when interpreting limb symmetry scores, however, as function could actually be over-estimated with objective testing batteries – even when achieving “passing criteria” an athlete’s readiness to return may not be comprehensively reported.8,18 Fatigue is an under-reported element of return to sport assessment, and may provide valuable information in refining limb symmetry batteries.
The present study is not without limitations. First, fatigue is difficult to quantify and measure; there are multiple factors that affect the presence of fatigue, multiple forms of fatigue (cognitive, neuromuscular, etc.), and varying objective definitions of what is “a fatigued state”. Without the presence of live monitoring data such as a heart rate monitor or other biometric measurements, actual state of “fatigue” is unknown and could have been affected by the small time gap between the collection of RPE, and initiation of testing. The investigators attempted to account for this with a less than 30 second turnover to begin testing. Due to a lack of literature defining fatigue in an ACL population, the current study was designed to induce fatigue across multiple energy systems. Further investigation into objective measures of fatigue would benefit future research. Second, although the most common RTP testing criteria were used, there were other aspects of RTP testing that could be affected by fatigue including qualitative movement analysis and psychological/psychosocial variables of performance that were not accounted for. Future studies should aim to assess both quantitative and qualitative movement analyses in order to create a more complete picture of the effect fatigue has on movement following ACL reconstruction. Third, post-operative rehabilitation leading up to the study was not controlled, and may have varied greatly based on the treating rehabilitation specialist; this is an important factor to consider as treatment varies significantly based on clinical specialty and experience level.32,33 Based on the results of the current study, it is possible that increased focus on the CON throughout the course of rehabilitation could have altered results. Mirkov et al.33 and Hiemstra et al.34 highlight the effect of initial ACL injury on both the contractile and neural properties of the muscle, but as a whole, current studies fail to fully quantify and explain the magnitude of the detraining and initial injury on the CONTROL limb.33,34 As a result, further investigation into the effects of ACL injury on the unaffected limb is warranted.
CONCLUSION
The results of this study provide insight into the effect of fatigue on hop performance in individuals following ACLR which may inform RTP considerations. The results indicate that the effect of fatigue on the ACLR was generally less than on the CON limb for the given measures, which could have profound implications for RTP decision making when utilizing LSI as a criterion for RTP. As a result, the sole use of LSI in determining readiness for RTP may not be sufficient. Further research into the effect fatigue has on objective measures is needed to improve clinician’s decision making regarding RTP following ACL reconstruction. Although the full extent of the role of fatigue in ACL rehabilitation is not yet known, the findings in this study indicate that assessment of both limbs should be considered rather than just the ACLR limb when determining RTP criteria.
Conflict of interest
All authors declare no conflicts of interests.