
INTRODUCTION
Injury surveillance data demonstrates that elite rugby union has a high lower-limb injury occurrence,1 with an incidence rate of 41.1 injuries per 1000 player-hours in match situations.2 Furthermore, data from the 2015 Rugby World Cup indicates that at the international level, knee ligament injuries are responsible for causing the greatest time loss at almost 30% of the total days lost due to injury.3 Domestically, injury surveillance of the English Premiership indicates that knee injuries also accounted for the highest number of days lost.4 While the total number of knee injuries sustained reported by English Premiership teams has not changed significantly over recent years, there has been an increase in the incidence of severe knee injury.5 Furthermore, the knee joint has been classified as an area at high risk of injury across all playing positions in professional rugby union.6
Damage to the anterior cruciate ligament (ACL) is a severe knee injury which is relatively common in athletic populations.7 Professional rugby players may be at risk of 1.26 ACL injuries for every 1000 players-hours of match play8 and absence caused from this injury is on average 261 days.4 The most common non-contact mechanisms of this injury in professional rugby union are side-stepping, landing, stopping, passing, and running.9
ACL injuries frequently require surgical reconstruction, a lengthy period of rehabilitation, and have potential long-term consequences for the individual.10,11 Post ACL reconstruction, individuals are more likely to demonstrate high risk landing mechanics associated with elevated future ACL injury risk compared to a normal population.12,13 In elite sport, these injuries can negatively impact upon a team’s success, highlighting the need for appropriate strategies to reduce injury risk in this population.14 Despite ACL injuries being serious and relatively common in rugby, there is a lack of research in the area specific to elite rugby union.
It is important to understand injury mechanisms and also identify risk factors to inform prevention strategies.15 A recent systematic evaluation of tools which assess risk factors for ACL injury in a clinical setting emphasised that while laboratory-based measures are accurate, they often are not practically applicable.16 Measures relating to neuromuscular control have been identified as modifiable risk factors for ACL injury and interventions related to neuromuscular training have proven to reduce ACL injury risk.17,18 While successful, results of these interventions are affected by poor compliance in athletic populations.19 It has also been suggested that identification of individuals at high-risk of injury may be important in improving the adherence to risk reduction programs.20
The Landing Error Scoring System (LESS) is a clinical test that assesses landing biomechanics during a jump-landing task in order to assess the risk of ACL injury. The LESS requires minimal and inexpensive equipment in comparison to laboratory-based biomechanical measures; while offering good inter- and intra-rater reliability and concurrent validity against laboratory based three-dimensional analysis.21,22 However, there is a lack of population specific data available for elite rugby union players, and hence further research has been advised.21
Measures of performance in jumping tasks can also be used as markers of athletic ability in sporting populations. Information on power (P) and jump height (JH) are outcome measures which are regularly used in practice.23 More recently, reactive strength index (RSI), calculated as JH divided by contact time with the ground (CT), has been measured in evaluation of athletes.24 These measures provide information on the capacity of an athlete’s stretch-shortening cycle and are related to athletic performance and monitoring of neuromuscular fatigue.25,26 A shorter contact time improves power output in this test. Measurement of these parameters is now more accessible in practical settings with systems such as the OptojumpTM, a relatively inexpensive, portable system that offers data of comparable quality to laboratory-based measurements.27,28 However, as with the LESS test, published data on these measures are lacking in elite rugby union populations.
An ACL injury to a professional rugby player can be career threatening and unfortunately is relatively common in the game. Therefore, it is imperative that risk factors are identified in this population and linked to performance measures for targeted prevention programs. The purpose of this study was to report i.) normative LESS scores for elite rugby union players ii.) correlations between LESS scores and performance measures and iii.) differences in performance measures between LESS scoring groups. A secondary purpose was to report the intra- and inter-rater reliability of the LESS test when used in elite rugby union players.
MATERIALS AND METHOD
Participants
Thirty-six elite rugby union players participated in the study (age 24.9±4.63 years; height 184.6±7.54 cm, mass 105.9±14.84 kg). All participants were members of a squad playing in the Premier division of rugby union in England. The Club’s medical team approved the participation of all players, who were all uninjured. Informed consent was obtained from each participant, and they were advised of their right to withdraw from the study at any time.
Procedures
All procedures were approved by the University of Cumbria Ethics Review Board (Reference: 15/55). Height in centimetres (cm), weight in kilogrammes (kg), date of birth, playing position and lower limb dominance was recorded for each participant. A standardized warm up protocol was used for each participant which consisted of a self- paced five-minute jog, 10 body weight squats, 10 body weight lunges and 10 body weight push-ups. Each participant then performed the LESS.
LESS Procedure
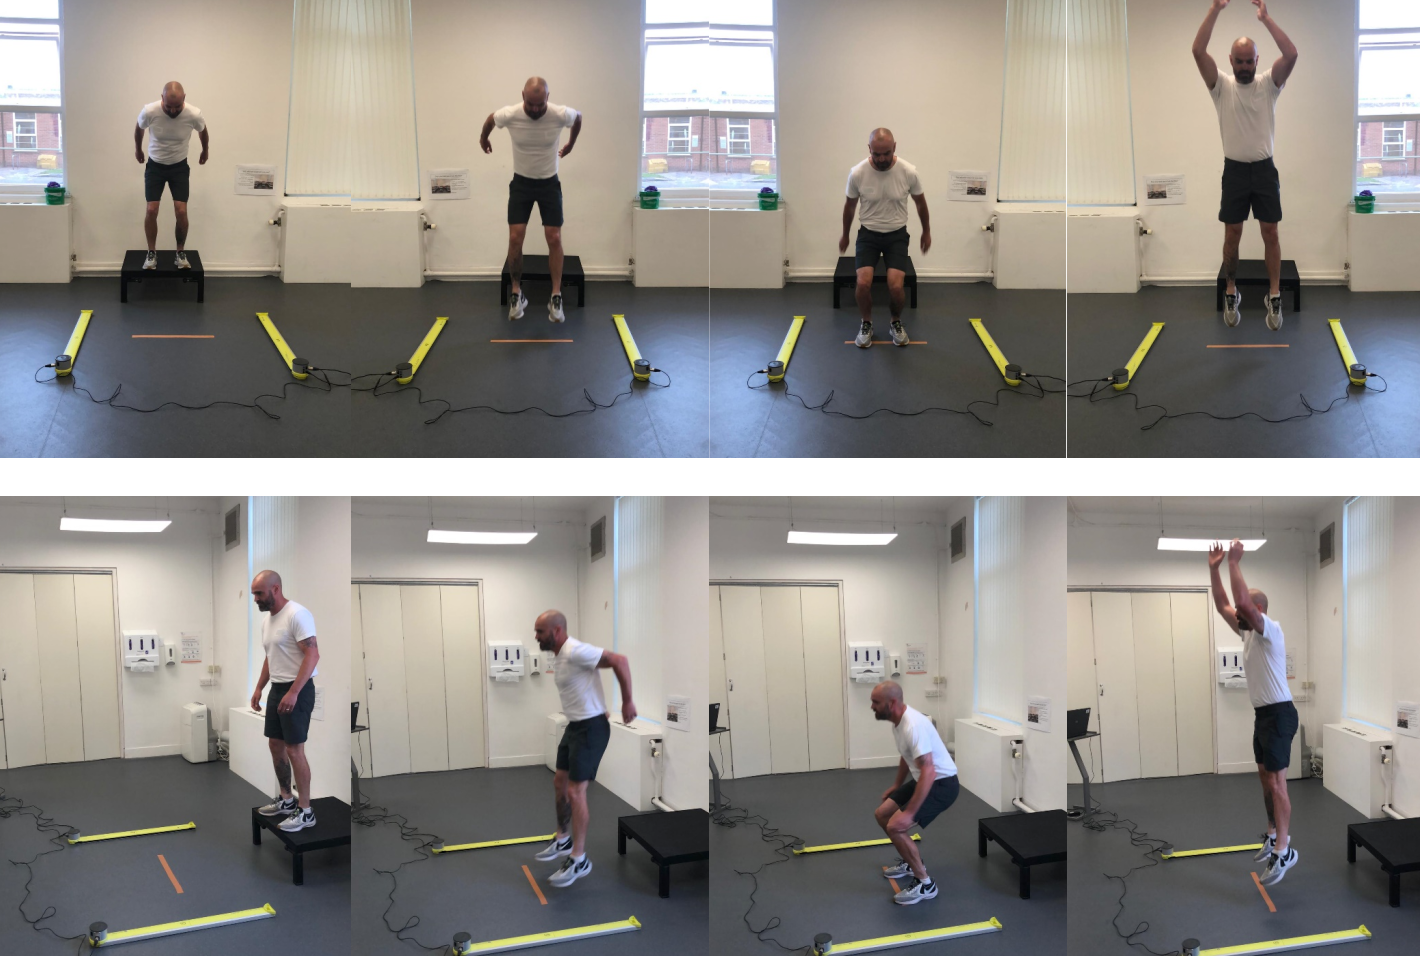
Testing procedure for the LESS was taken from previous work.22 Participants started the LESS standing on top of a 30 cm high box and were asked to jump forwards a distance equal to half of their height (indicated by a line on the floor), immediately upon landing they were required to perform a maximal vertical jump (Figure 1). Participants were provided with a verbal explanation and visual demonstration prior to testing; they were also permitted practice trials until comfortable with the procedure. Each participant completed three trials of the LESS and the average taken for analysis.
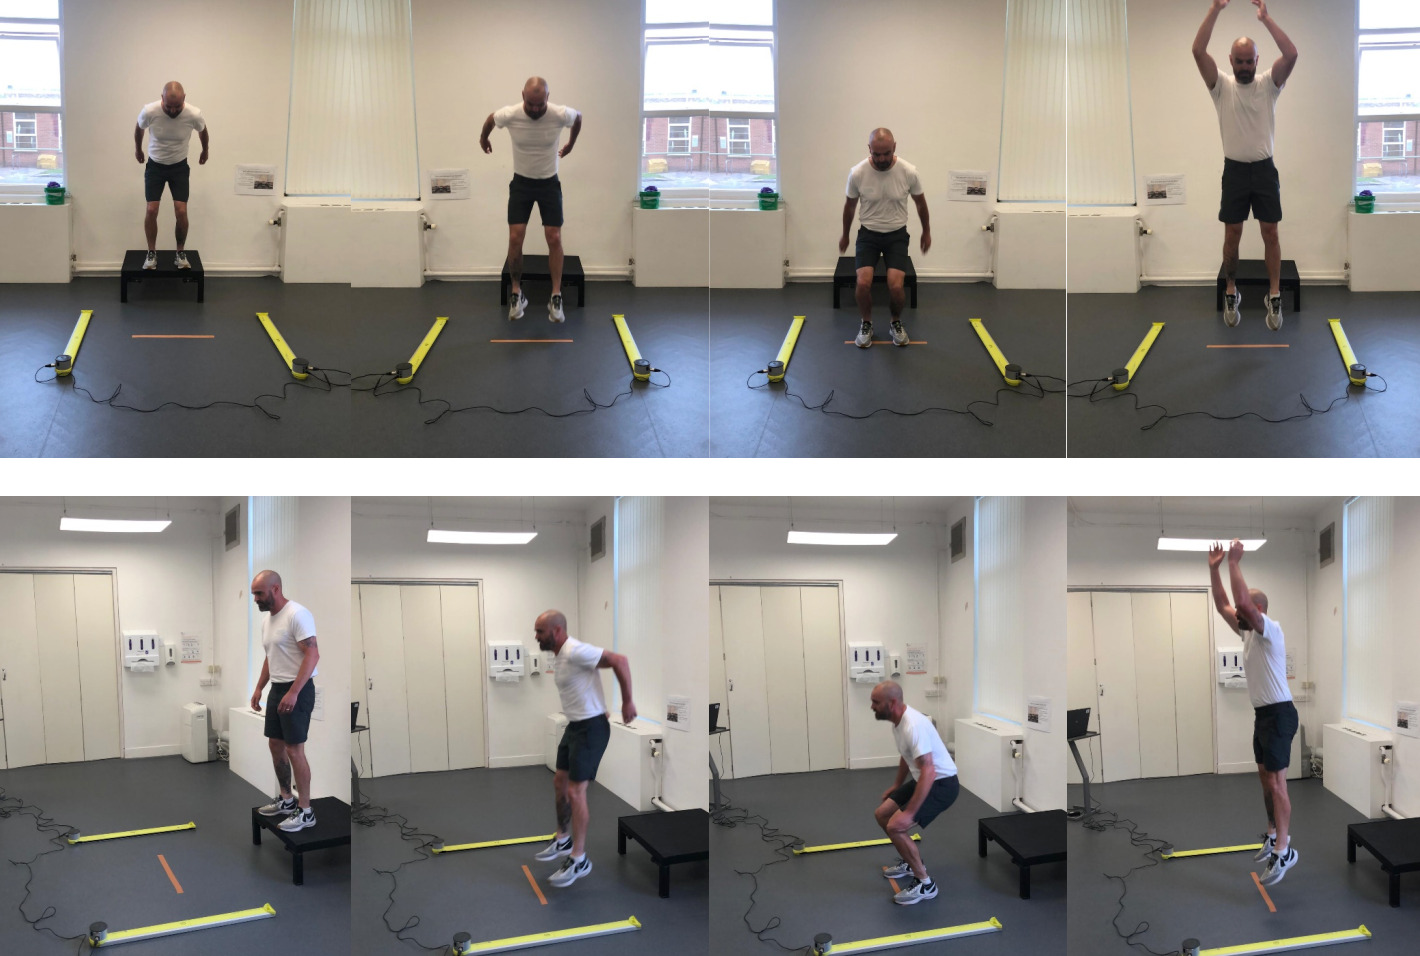
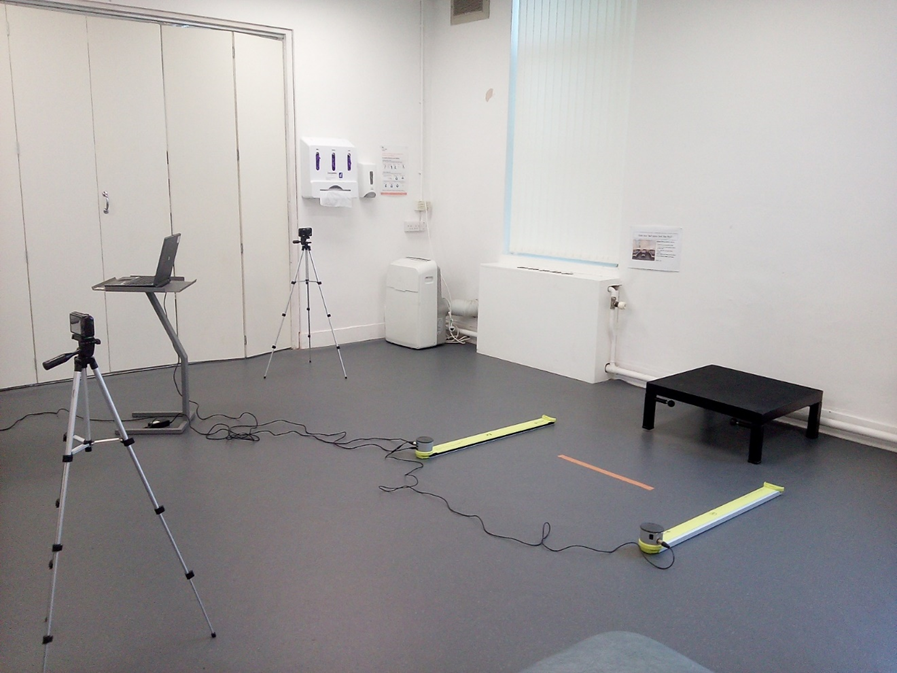
Each LESS trial was recorded from frontal and sagittal planes with video cameras (HX-WA30, Panasonic Corporation, Osaka, Japan) located 136 inches from the landing area, with the lens of each camera set at a height of 48 inches (Figure 2). Simultaneously, measurements of P (Watts/ kg), JH (cm), CT (seconds) and RSI (m/s) were recorded using the OptojumpTM optical measurement system (Microgate, Bolzano, Italy). Each LESS trial was analyzed using the scoring criteria22 which can be seen in Appendix 1. On the basis of their LESS score, participants were individually divided into the following groups: excellent (LESS score, <4), good (LESS score, 4-5), moderate (LESS score, 5-6) and poor (LESS score, >6) jump landing mechanics.22

Statistical Analysis
All statistical analyses were completed in SPSS (Version 22, IBM Corporation, New York, USA). Intra- and inter-rater reliability of the LESS scoring procedure was confirmed using intra-class correlation coefficients (ICC 2, 1), 95% Confidence Intervals and Cronbach’s α.29,30 A randomly selected data set of 32 LESS trials was analysed by two independent researchers; the ICC value between the researchers was 0.94 and 95% confidence intervals ranged from 0.89-0.97. The Cronbach’s α value was 0.97. One researcher repeated the analysis of the randomly selected data set of 32 trials; the ICC value within the researcher was 0.96 and 95% confidence intervals ranged from 0.92-0.98. The Cronbach’s α value was 0.98. ICC results greater than 0.75 are excellent, between 0.40-0.75 are modest and less than 0.40 are poor.31 Therefore, it can be confirmed that the intra-rater and inter-rater reliability of the LESS analysis technique was at an acceptable level in this study and can be used reliably in elite rugby union players.29,31
The Kolmogorov-Smirnov test was used to confirm normality of the data. Significant correlations between LESS scores and lower limb performance data were tested using a Spearman’s rho analysis with significance levels set a p < 0.05. Differences between excellent – good LESS scores (≤ 5) and moderate – poor LESS scores (> 5) for all testing data were analysed using a multi-variate ANOVA with significance set at p <0.05. Effect sizes were reported as partial eta-squared (η2) and were interpreted using Cohen’s (1992) classifications as follows; 0 – 0.1 is a small effect, 0.1-0.3 is a small to medium effect, 0.3-0.5 is a medium to large effect and 0.5 and above is a large effect.
RESULTS
Table 1 presents individual results for each player. The overall mean LESS score for all players was 7.039 (± 2.378), a poor LESS score.22 Figure 3 provides a breakdown of the LESS scores in the four LESS score groups.
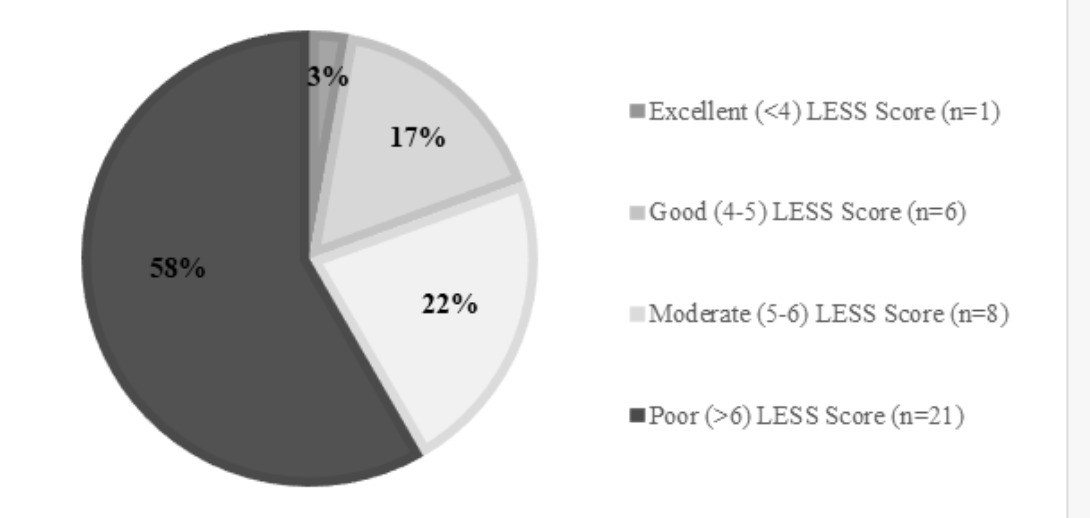
Table 2 details lower limb performance data in the two LESS groups; excellent – good and moderate – poor LESS scores. LESS score significantly correlated to only one of the lower limb performance tests conducted in this study; this was contact time of the LESS test (r = -0.461, p = 0.005). However, when the participants were divided into excellent to good LESS scores (≤ 5) (n = 7) and moderate to poor LESS scores (> 5) (n = 29), to allow for lower samples sizes in the excellent scoring group, there were significant differences in performance. Participants with LESS scores > 5 produced significantly greater power (mean difference = 8.45W/kg, p = 0.036, η2 = 0.139), lower contact time (mean difference = 0.1s, p = 0.002, η2 = 0.268) and greater reactive strength index (mean difference = 0.46m/s, p = 0.016, η2 = 0.180) compared to the participants with LESS scores ≤ 5 during the LESS testing procedure. No significant differences were found between participants with excellent to good and moderate to poor LESS scores in the performance parameter of JH (p = 0.842). There was also no significant correlation between body mass and LESS score (p =0.932).
DISCUSSION
The purpose of this study was to report i.) normative LESS scores for elite rugby union players ii.) correlations between LESS scores and performance measures and iii.) differences in performance measures between LESS scoring groups. A secondary purpose was to report the intra- and inter-rater reliability of the LESS test when used in elite rugby union players.
Results from the current study are in agreement with previous work in reporting excellent intra and inter-rater reliability for the LESS scoring procedure.21,22 In light of this, the current results support the use of the LESS for assessment of landing mechanics in elite level rugby union players. There is evidence that the LESS is able to identify individuals at risk of sustaining ACL injury in elite-youth soccer players.32 While the current results were not used to attempt to identify individuals at risk, the proportion of elite rugby union players presenting with scores ranked as moderate-poor (81%), suggests further investigation is warranted in this population.
Interestingly, results demonstrated that participants recording moderate-poor LESS scores recorded significantly higher P, and RSI but longer CT and lower JH when compared to those scoring excellent-good in the LESS test. Participants are advised to jump as high as possible when performing the LESS test.22 It is not known if higher risk mechanics which were displayed by these participants (such as increased power) occur during an attempt to improve performance measures or due to an inability to perform what are considered more optimal landing biomechanics when performing a maximal drop jump. Furthermore, it is not known where the higher performance measures are derived from in the moderate-poor LESS group; whether they are being created through the active neuromuscular system or through the loading of passive structures through the observed biomechanics. It is important to note that low effect sizes reported indicate that the magnitude and hence meaningfulness of these findings may be limited. These results suggest that future research should consider concurrent measurement of these performance markers alongside the LESS to develop a greater understanding of this relationship.
There was no significant relationship between body mass and LESS scores. This is an unexpected finding as it is perhaps logical to assume that heavier players would use differing biomechanics than lighter players.33 However, this finding may be due to the limited sample size and should be considered by researchers in the future.
Neuromuscular training is known to improve neuromuscular control and reduce ACL injury risk, although practical application has proven problematic.17–19 Whether improvements in neuromuscular control would affect performance measures, such as those measured in the current study is not known. The lack of significant difference in JH in participants with moderate-low LESS scores compared with significant differences in P, CT and RSI may suggest that high risk landing biomechanics can translate to potential performance decrements; an area which has not yet been investigated with this clinical tool.
Recently it has been suggested that the goal of predicting injury risk through the use of a specific test is unlikely to be sufficiently successful, however, may offer an insight into factors related to the injury process.34 In elite rugby union players the mechanism of injury for the ACL has been reported to occur more commonly during episodes of contact;9 in contrast to non-contact sports where non-contact mechanisms (such as jumping/landing) are more regularly observed.35–37 While this may be the case, the present study highlights the need for further investigation into the relationship between landing biomechanics and performance measures. This may be more clinically feasible in an elite rugby union setting, where player management is multi-disciplinary in nature.38
While not measured in this study, distinct biomechanical differences have been identified when comparing single- and double-leg landings and suggest that clinical assessments such as the LESS should reflect this when assessing lower limb landing biomechanics.39 Injury data supports this view and highlights that most commonly the mechanism of ACL injuries occurs in a single-leg position.40 Further development and investigation of the LESS to incorporate a single-leg landing assessment may be beneficial in improving the quality of results obtained for this clinical test.
Conclusion
The results of the current research indicate that a large percentage of elite rugby union players recorded poor results for the LESS. Participants recording moderate-poor LESS produced significantly greater measures of P, CT and RSI during their drop-jump performance, while JH was not significantly different compared to those scoring good-excellent in the LESS. Reliability of the LESS as a clinical tool is further supported. The authors suggest that further investigation of the utility of the LESS in an elite rugby environment is warranted given results from the current research, scarcity of other data, and significance of knee injury in the sport.