


INTRODUCTION
Despite increased evidence on injury prevention and identification, injuries ranging from minor to career-limiting continue to rise.1,2 Deficits in lower extremity dynamic neuromuscular control have been implicated as an injury risk factor and have been observed after lower extremity injury.3–6 Interventions to improve lower extremity dynamic neuromuscular control have been utilized as a component in multiple injury prevention programs. Specifically, researchers have observed that athletes who participated in an injury prevention program displayed improved lower extremity dynamic neuromuscular control.7,8 One study observed that the intervention group who was most compliant demonstrated the greatest lower extremity dynamic neuromuscular control improvement, and sustained lower extremity injuries at decreased rates.8 Additionally, health care practitioners frequently utilize dynamic neuromuscular control as an outcome measure for return to sport criterion. Thus, there is a need for a lower extremity dynamic neuromuscular control test that identifies athletes at increased injury risk, captures changes that may occur with intervention, and evaluates return to sport readiness (i.e., ensure motor control deficits that occur after injury have normalized). In order to be useful in a sports setting the test would need to be valid and easy to use.
The Star Excursion Balance Test (SEBT) and Y-Balance Test Lower Quarter (YBT-LQ) have been studied and used extensively for the determination of physical readiness and injury risk identification, return to sport testing, and pre-post intervention measurement.6,9 The SEBT, through a systematic review, has been found to be reliable, valid, and responsive to specific dynamic neuromuscular control training for injured and healthy athletic populations.6 The advantage of the SEBT and YBT-LQ is that they test neuromuscular control at the limits of stability, which may allow for identification and magnification of subtle deficits and asymmetry.6
The YBT-LQ was developed from the SEBT in order to improve the reliability and field expediency of the SEBT.9 The YBT-LQ was simplified to use only the most reliable three reach directions (compared to eight reach directions with the SEBT). While both tests require dynamic neuromuscular control at the limits of stability, there are differences between the tests. The YBT-LQ uses a standardized approach via a testing kit and revised protocol to improve the reliability and testing speed. Protocol revisions include: heel of stance foot is allowed to raise, no touch down is allowed with reaching limb, and kit incorporates a standard reach height off the ground is used.9
While the efficiency of the test may have been improved, these differences in test procedures can alter performance, leading researchers to conclude that the SEBT and YBT-LQ are not interchangeable.10,11 Coughlan et al.10 compared the performance on the SEBT and YBT-LQ, and found that healthy males reached farther on the SEBT in the anterior direction, but had similar reach distances in the posterior directions.10 Fullam et al.11 examined the kinematic differences between the SEBT and YBT-LQ. It was confirmed that healthy males reached farther in the anterior direction, and from a kinematic perspective, the YBT-LQ anterior reach had greater hip flexion.11 These differences may be due to procedural differences or the use of a standardized YBT-LQ test kit. In addition to the differences in results between the YBT-LQ and SEBT, researchers have found that there may be differences in performance based on sex, sport and competition level in both tests.3,4 Differences have been reported between subject performance on the YBT-LQ based on country of origin,12 as well as, competition level.13,14 However, it is uncertain whether these findings are isolated to these populations or represent a true difference in performance among populations.
While a systematic review has been performed on the reliability and discriminant validity of the SEBT, the YBT-LQ has not undergone a similar rigorous analysis regarding its effectiveness regarding injury risk identification.6 In the SEBT systematic review, the YBT-LQ was described as reliable, but only one study was available; thus, there is a need to investigate and summarize the YBT-LQ literature.6 The purpose of this systematic review and meta-analysis was to review the reliability of the YBT-LQ, determine if performance on the YBT-LQ varies among populations (i.e., sex, sport/activity, and competition level), and to determine the injury risk identification validity of the YBT-LQ based on asymmetry, individual reach direction performance, or composite score.
METHODS
Study design
A systematic review was performed on the reliability, validity, and population differences of the YBT-LQ. The Preferred Reporting Items for Systematic Reviews and Meta-Analyses (PRISMA) guidelines were utilized to conduct and report this review.15 This review was prospectively registered with Prospero CRD42018090102.
Search strategy
A comprehensive computerized search was performed, employing online databases (MEDLINE, CINAHL, Cochrane, Embase, SPORTDiscus, Health Source-Consumer Edition, Health Source: Nursing/Academic Edition, SocINDEX, and Social Sciences), from inception to October 30, 2019. Medical subject headings (MeSH) and keywords were utilized for “dynamic balance,” “Y-Balance Test,” “Star Excursion Balance Test,” and “single leg balance.” The full search strategy entailed “y balance test*”[All Fields] OR “star excursion balance test*”[All Fields] OR YBT[All Fields] OR SEBT[All Fields]. References were tracked in Covidence systematic review software (Veritas Health Innovation, Melbourne, Australia).
Eligibility criteria
Studies examining the YBT-LQ were included if they met the following criteria: 1) tested dynamic single leg balance using the YBT-LQ; 2) full-text articles were written in English. Study exclusion criteria consisted of 1) studies that did not use the Y-Balance Test kit during testing; 2) major deviation from the Y-Balance Test procedure (e.g., stance foot heel kept down); 3) the Y-Balance Test Upper Quarter procedure was utilized instead of the YBT-LQ; 4) conference abstracts or non-peer-reviewed papers.
Study selection
Four reviewers (GB, MG, BH, KS) were split into pairs, and each pair independently assessed half of the selected studies. Title and abstracts were first screened using inclusion and exclusion criteria. Four reviewers independently, who were all physical therapists and specialized in sports medicine, executed full-text review following title and abstract screening. Any conflicts were first discussed within the four reviewers. If a consensus could not be reached, another reviewer (PJ), who is a physical therapist, athletic trainer, PhD, with over twenty years’ experience in sports medicine, was utilized to determine final study eligibility. Following full-text review, a hand search was performed for any studies missed within the initial search.
Data extraction
Data were extracted into a customized Excel spreadsheet (Version 2013, Microsoft, Redmond, Washington, United States) in three domains: reliability, population differences, and injury prediction. Two reviewers verified data for each domain. Disagreements concerning data domain placement were resolved by a third reviewer (PJ). Data elements included study characteristics (e.g., publication data, study design, and population), YBT-LQ methodology, and results (number of injuries, reach distance, reach asymmetry, and reliability).
Quality assessment
All three domains (reliability, population differences, and injury prediction) were each analyzed by two independent reviewers (GB, MG, BH, KS). A third reviewer (PJ) resolved any quality assessment disagreements. The Oxford Centre for Evidence-Based Medicine (OCEBM) levels of evidence (Level I to IV)16 was used to discern study design. The YBT-LQ methodology was specifically assessed for uniformity.6 The YBT-LQ protocol factors that were assessed included the use of shoes during testing, the use of the average or maximum reach for each reach direction, hand placement during testing, number of practice trials, and number of data collection trials.6 The modified Downs and Black tool was utilized for methodological assessment for studies within the reliability and population differences domains.17,18 The modified Downs and Black tool has been shown to be reliable and valid.17 This methodological tool was scored on a scale of 0 to 15. The scoring system has a stratified ranking, with a score of 12 or greater deemed high quality, a score of 10 to 11 deemed moderate quality, and a score at or below 9 deemed low quality.18 The Newcastle-Ottawa Scale (NOS) was utilized for methodological assessment for studies within the injury prediction domain. The NOS incorporates a ‘star system’ for three broad perspectives: the selection of the study groups (four questions); the comparability of the groups (one question); and the ascertainment of outcome of interest (three questions). Multiple questions can have more than one star, which may result in the number of stars totaling greater than total number of questions.19
Statistical analyses
Percentage agreement and Cohen Kappa statistics were calculated to provide absolute agreement between raters in SPSS 23 (SPSS Inc, IBM, Chicago, Illinois). The extracted data were aggregated into three domains: reliability, population differences, and injury prediction. Reliability data were summarized in a narrative fashion. The population differences domain data were analyzed by pooling the study means through a random effects inverse variance approach, originally described by DerSimonian and Laird.20 Studies that reported more than one individual cohort were each calculated as individual studies. Heterogeneity was assessed with the Cochrane Q and I2 with high heterogeneity designated by a Q p-value <0.10 and I2 >50%. Meta-analysis was used to combine and summarize the data. In outcomes related meta-analysis, high heterogeneity indicates that there is large variation in study outcomes between studies and that results should not be pooled or combined. In this meta-analysis, high heterogeneity was observed indicating that there indeed may be differences in performance on the YBT-LQ among populations (i.e., age, sex, sport, activity, occupation, and injury status). Through an abundance of caution, a random effects model was used assuming that even within populations, results fall in a normal distribution. Data subdivisions were first grouped by sex for each YBT-LQ reach and composite score then analyzed through a series of z-tests (p<0.05). Due to the differences found between sexes, and the paucity of female studies, only males were assessed for further subdivisions. Additionally, competition level was not able to be compared as there were no greater than two subgroups at each competition level. Male sports differences (for all three YBT-LQ reaches and composite scores) were analyzed through one-way ANOVA with Tukey-Kramer Q tests to localize pair-wise differences based on pooled study means and variances (p<0.05).21 All meta-analyses were performed in R version 3.5.1 (R Core Team (2013). R: A language and environment for statistical computing (R Foundation for Statistical Computing, Vienna, Austria. URL http://www.R-project.org/), using the meta package.22 Given the heterogeneity in study design and data reporting, injury prediction data were summarized in a narrative fashion.
RESULTS
Study selection
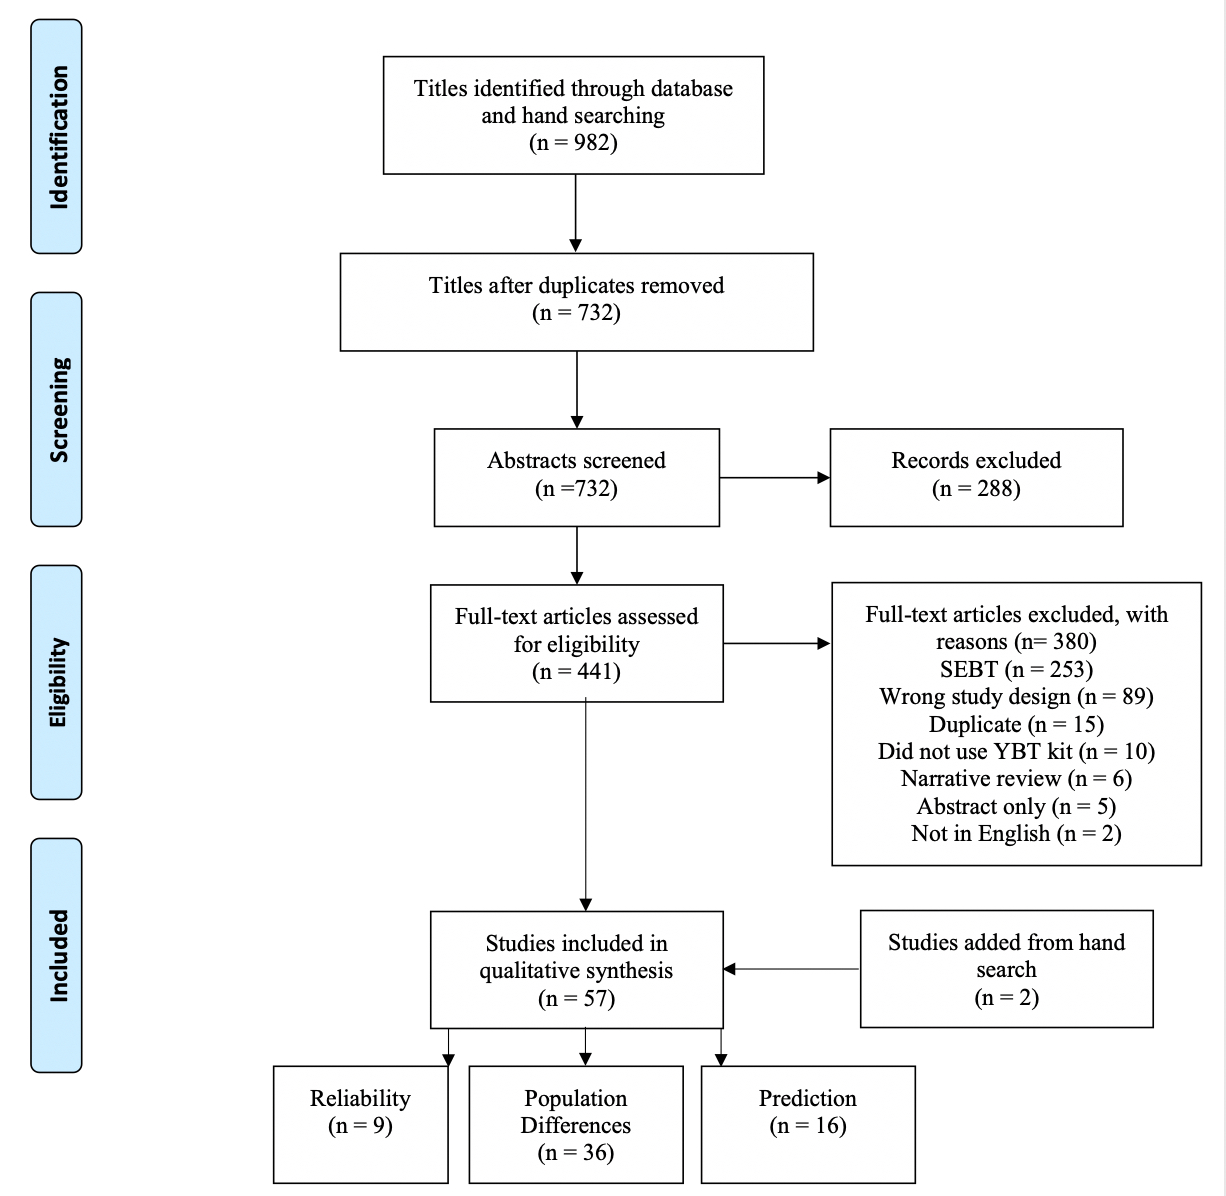
A total of 982 titles were identified through the initial database and hand searches. After removal of duplicate articles, 732 abstracts were reviewed for relevance. Substantial agreement was demonstrated in title and abstract screening (k=0.976, p<0.01). Full text eligibility assessment of the remaining 411 articles resulted in 57 articles with 4 in multiple categories (Figure 1).3,9,12–14,23–50 Nine studies9,25,33,40,46,51–54 assessed reliability, 36 studies12–14,23–30,32,35,37,38,41–45,47,49,54–67 examined differences in the performance on the YBT-LQ in different populations or reported mean performance on the YBT-LQ in a specific population, and 16 studies3,31,34,36,39,48,50,57,64,68–74 examined injury prediction (see Table 1). Substantial agreement was also observed for full text review (k=0.84, p<0.01).

Quality assessment
The NOS was used to assess quality of the included cohort studies (n=16). For the remaining 41 articles, the Downs and Black tool was used to assess quality. The scores of the included studies on the NOS ranged from 6-9 out of a possible 9, while the scores on the Downs and Black tool ranged from 7-13 out of a possible 15 (see summary in Table 1).
Reliability
Nine studies9,25,33,40,46,51–54 assessed reliability of YBT-LQ (see Table 1). Intraclass correlation coefficients (ICCs) for intrarater reliability ranged from 0.57-0.82 in adolescent populations,40 and 0.85-0.91 in adult populations.9 Interrater reliability ICCs ranged from 0.81-1.00.9,33,46,51 Test-retest reliability was assessed in five studies with ICCs ranging from 0.63-0.93.25,33,52–54
Sex differences
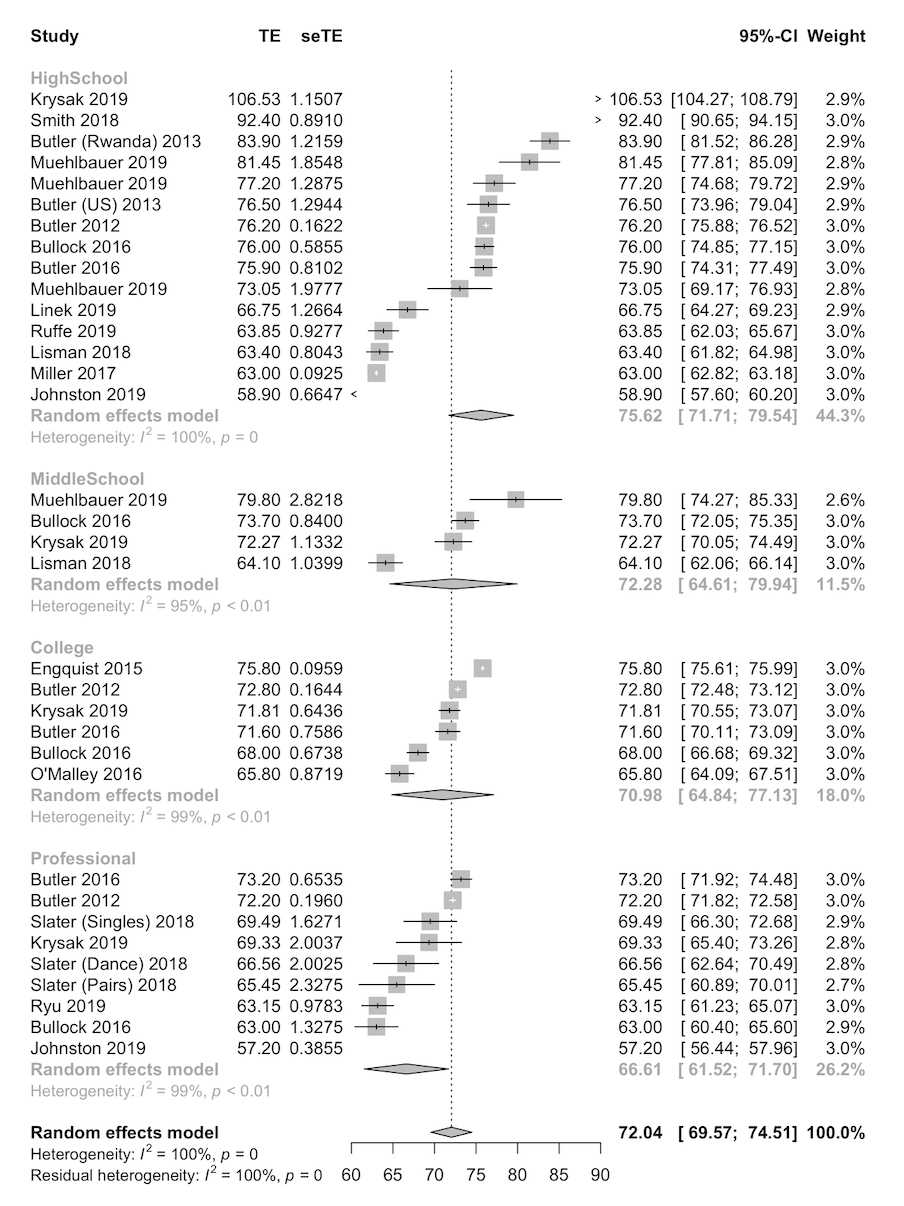
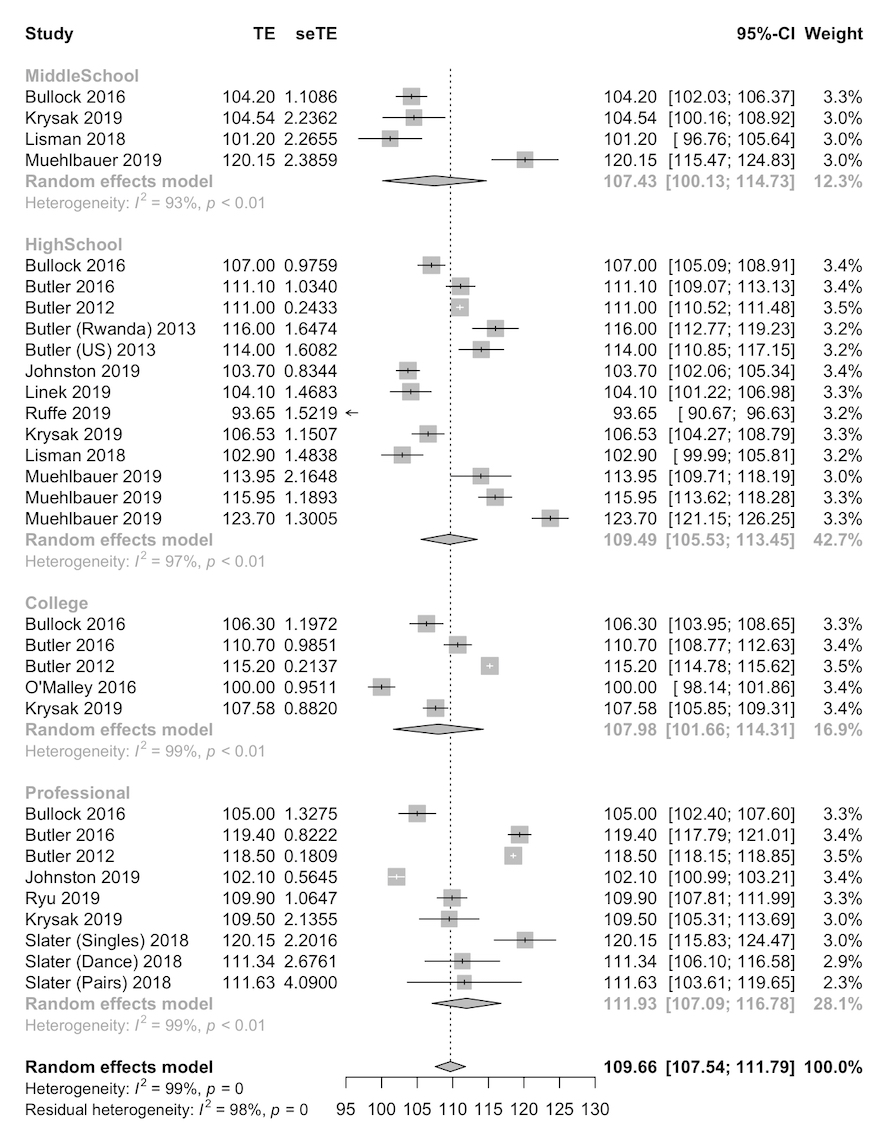
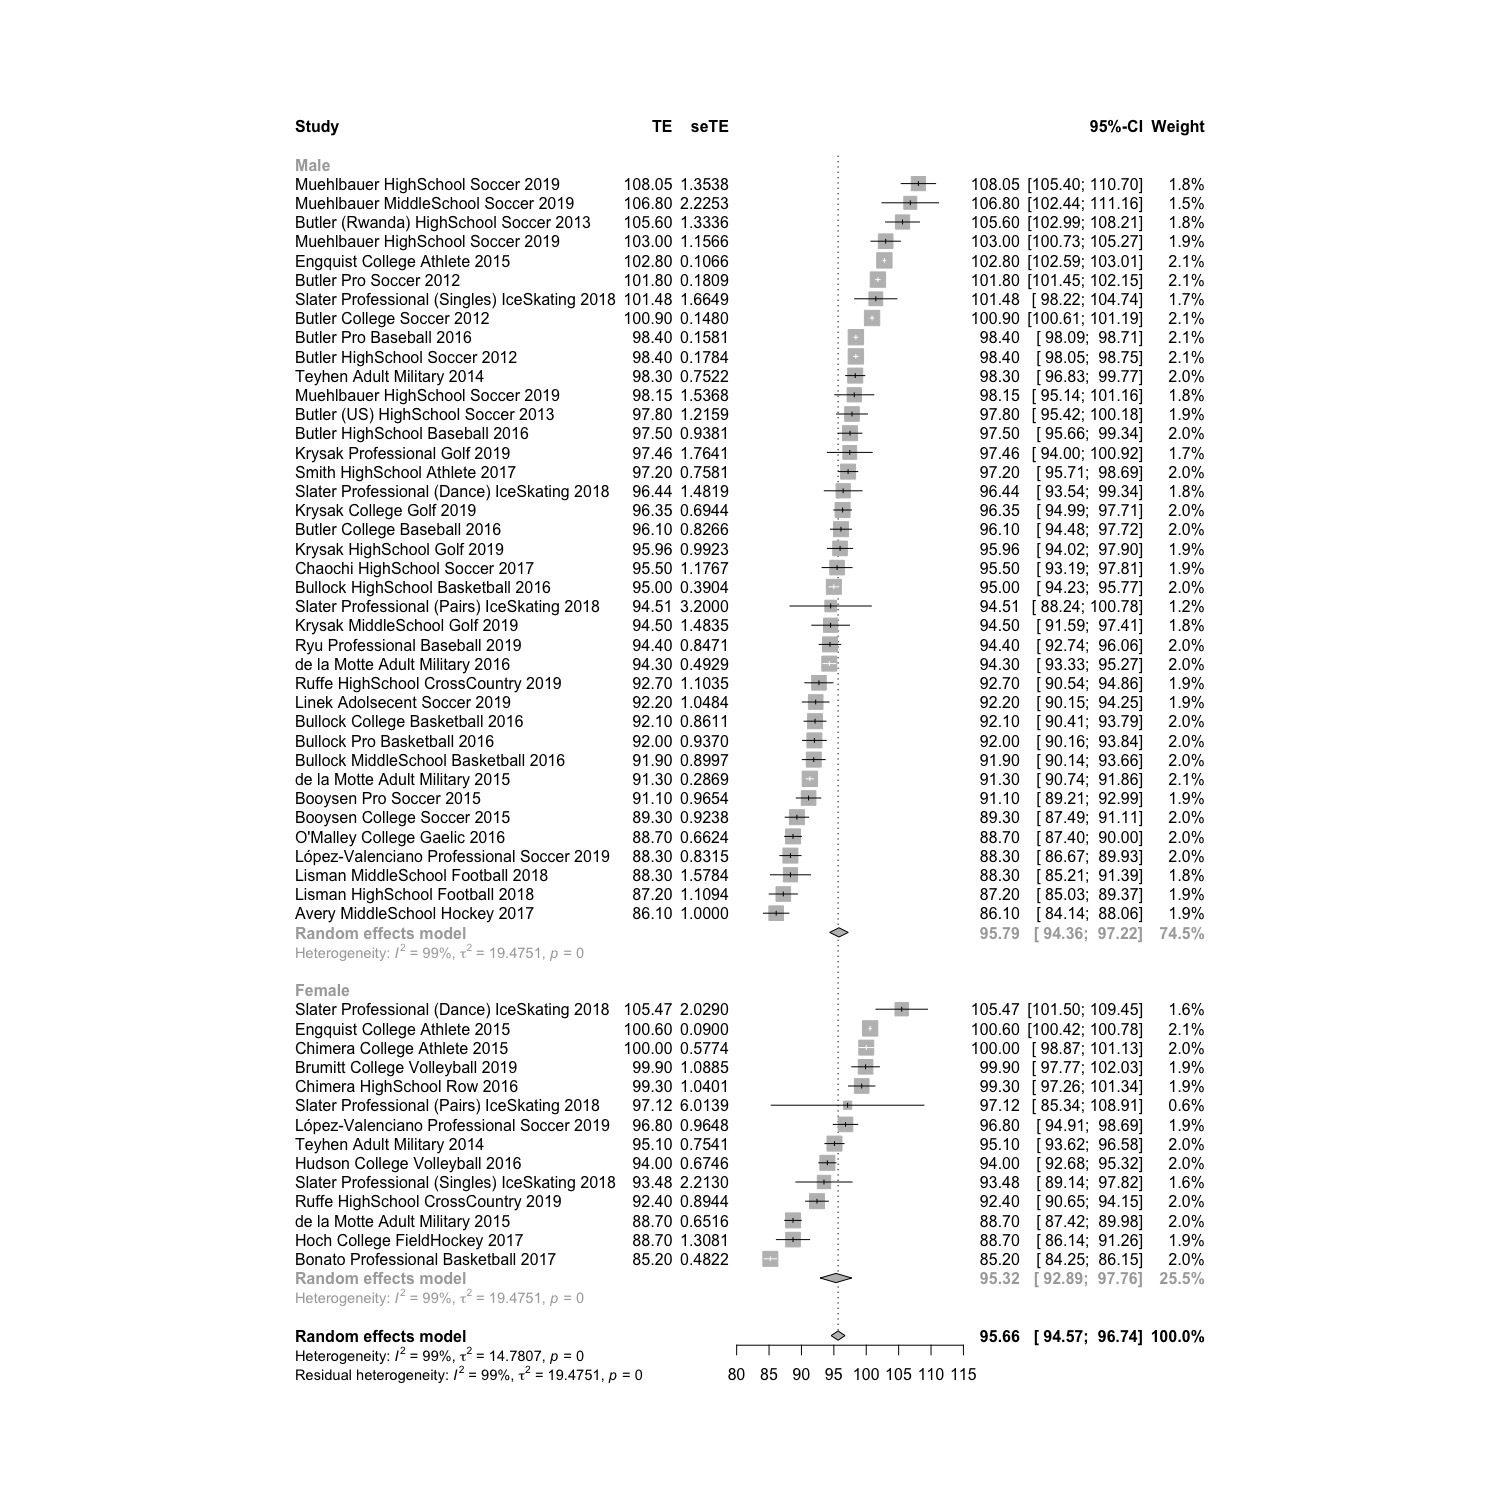
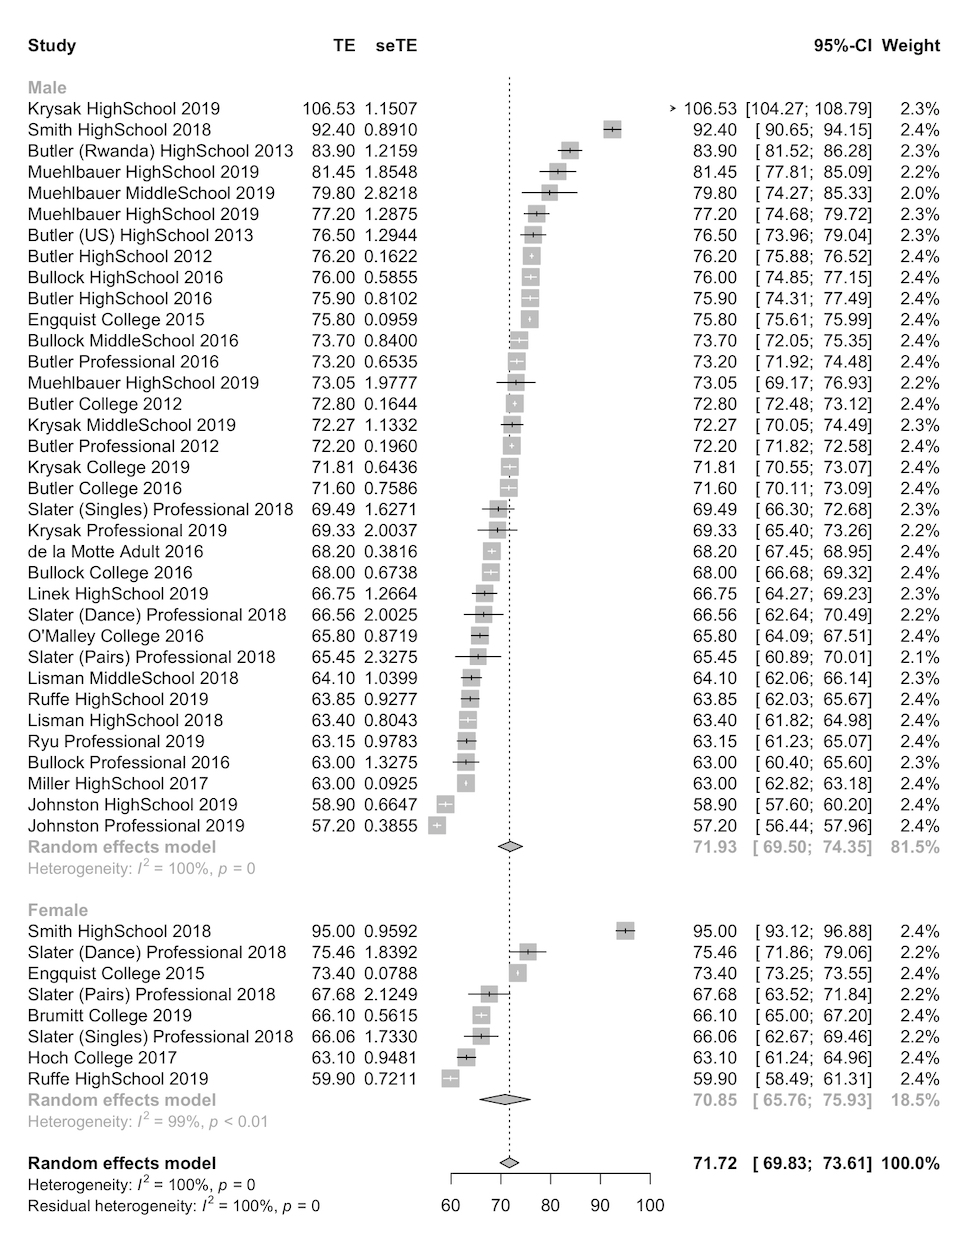
When sex was considered alone, differences were observed in the posteromedial direction (Male: 109.6 95% CI 107.4-111.8; Female: 102.3 95% CI 97.2-107.4; p < 0.01) and posterolateral direction (Male: 107.0 95% CI 105.0-109.1; Female: 102.0 95% CI 97.8-106.2; p=0.036).12–14,25,27,37,43,44,58–61,63–66 However, no difference was observed between sexes in the anterior reach direction (Male: 71.9 95% CI 69.5-74.5; Female: 70.8 95% CI 65.7-75.9; p=0.708)12–14,25,27,37,44,54,57–61,63,65–67 or in composite score (Male: 95.8 95% CI 94.5-97.2; Female: 95.3 95% CI 92.9-97.8; p=0.75) (Figure 2).12–14,24–30,32,37,38,42–44,55–57,59–66 However, there were significant differences based on sex, competition level, and sport throughout Figure 2. To illustrate, male Rwandan high school soccer players have a mean composite reach of 105.6 (95% CI 102.99-108.21),12 while male professional basketball players have a mean composite reach of 92.0 (95% CI 90.16-93.84).27 These scores also differ from female collegiate athletes, where a mean composite reach of 100.0 (95% CI 98.87-101.13) was observed.30
Competition Level Differences
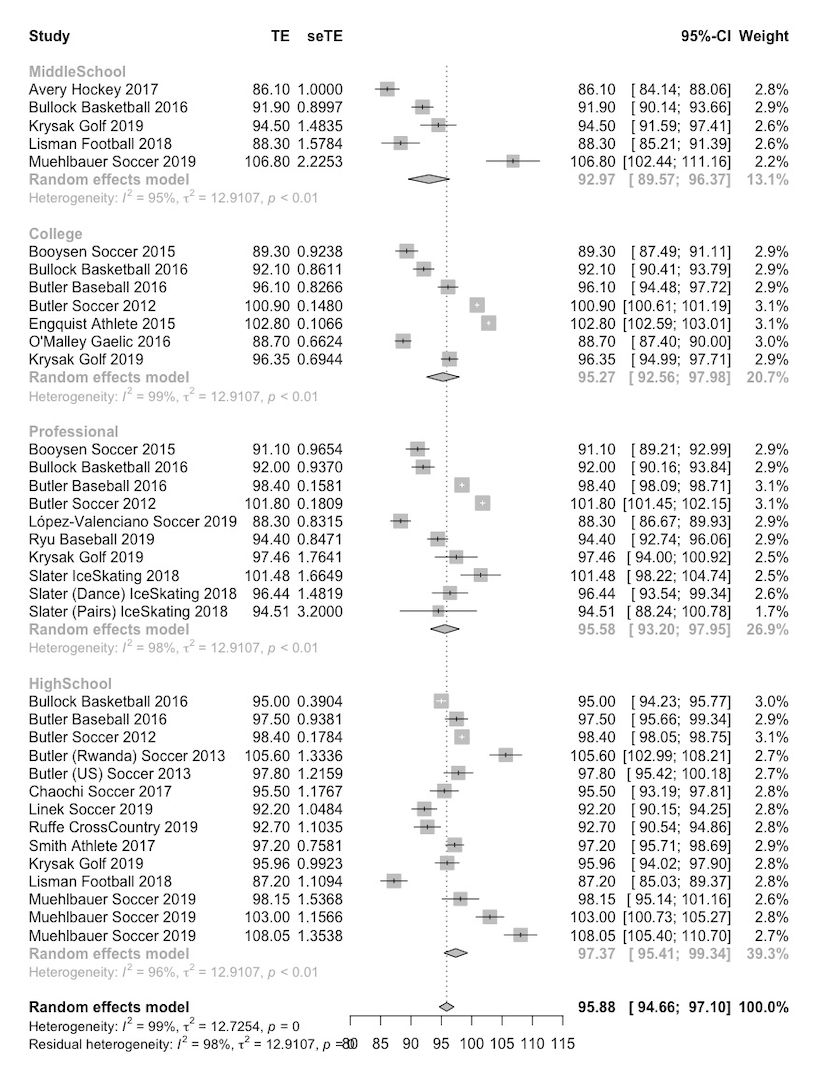
When competition level was considered alone (middle school, high school, college, professional), no differences were observed for the anterior (p = 0.05), posteromedial (p = 0.69), posterolateral (p = 0.62), or composite score (p = 0.15) (Figure 3, 4, 5, 6).12–14,23–30,32,35,37,38,41–45,47,49,54–67


Sport differences
In the anterior reach direction, a significant difference was observed between soccer and basketball athletes (Soccer: 76.0 95% CI 73.6-78.4; Basketball: 70.5 95% CI 67.7-73.2; p < 0.01).12–14,27 In the posteromedial reach direction, a significant difference was observed between soccer and basketball athletes (Soccer: 114.8 95% CI 111.6-118.3; Basketball: 105.6 95% CI 101.9-109.4; p < 0.01), and baseball and basketball athletes (Baseball: 113.8 95% CI 109.5- 118.1; Basketball 105.6 95% CI 101.9-109.4; p < 0.01).12–14,27 In the posterolateral reach direction, a significant difference was observed between soccer and basketball athletes(Soccer: 111.8, 95%CI 108.5-115.0; Basketball: 102.0 95% CI 101.3-104.4; p < 0.01), and baseball and basketball athletes (Baseball: 107.7 95% CI 105.7-106.1; Basketball: 102.0 95% CI 101.3-104.4; p < 0.01).12–14,27 For composite score, there was a significant difference between soccer and basketball athletes (Soccer: 97.6 95% CI 95.9-99.3; Basketball: 92.8 95% CI 90.4-95.3; p < 0.01) and baseball and basketball athletes (Baseball: 97.4 95% CI 94.6-100.2; Basketball: 92.8 95% CI 90.4-95.3; p = 0.02).12–14,27
Injury prediction
A total of 16 studies3,31,34,36,39,48,50,57,64,68–74 investigated the association between YBT-LQ performance and injury risk: 12 investigated anterior reach asymmetry, 10 investigated asymmetries in the posteromedial and posterolateral directions, five studied individual reach directions, and 13 utilized composite scores. Populations studied include collegiate athletes3,36,39,50,57,68,70 (n=1,493), elite female basketball players73 (n=169), male high school athletes72 (n=156), professional and amateur soccer athletes34 (n=74), rugby players71 (n=109), high school cross country runners64 (n=148), military personnel31,48,69 (n=1919), and firefighters74 (n=39).
Anterior Reach Asymmetry
Twelve studies34,36,39,48,50,57,64,68,69,72–74 investigated the injury prediction ability of the YBT-LQ anterior reach asymmetry (Subjects: n=3,986). Five of these studies34,50,57,64,68 examined anterior reach asymmetry using a cut off of ≥4 cm; three34,57,64 reported raw numbers of subjects falling above and below this cut off score. Due to the high level of methodological and reporting discrepancies in the available data, a meta-analysis was not able to be completed.
Smith et al.68 utilized the 4 cm threshold and found a relationship with future injury risk, reporting an OR of 2.20 (95% CI 1.09-4.46). The remaining seven studies varied in interpretation of anterior reach performance. Five studies39,48,69,72,74 utilized anterior asymmetry cut off values varying from 2-3cm; of these, Valuerin et al.74 found an asymmetry of ≥2cm was predictive of ankle sprains. Siupsinksaks et al.73 reported only limb difference scores and did not find an association to injury in elite female basketball players. Hartley et al.36 created a reach distance cut off of 54.5 %LL for the anterior reach and found a significant difference between injured and uninjured collegiate athletes. Populations and definition of injury and asymmetry varied between studies, however, the three studies identifying a relationship between injury risk and anterior reach all included collegiate or professional athletes.
Posteromedial and Posterolateral Asymmetry
Ten studies3,34,36,39,57,64,68,72–74 examined the relationship between posteromedial and/or posterolateral reach asymmetry and future injury risk. Gonell et al.34 reported an OR of 3.86 (95%CI 1.46-10.95) for male soccer players with a posteromedial asymmetry of 4cm or greater. No relationship was observed with posterolateral asymmetry. Four studies57,64,68,72 used the same 4cm or greater asymmetry threshold for both the posteromedial and posterolateral directions, and found no relationship to future non-contact injuries in collegiate basketball players, high school cross country runners, collegiate athletes, or musculoskeletal injuries in male high school athletes, respectively. Hartley et al.36 also reported a significant difference in posteromedial reach asymmetry, with injured female athletes having a significantly reduced asymmetry compared to uninjured counterparts. Lai et al.39 reported asymmetries of 9cm in the posteromedial reach direction and 3cm in the posterolateral direction resulted in a sensitivity of 17.1% and 54.9% (respectively), while specificity was reported as 89.9% and 54.6% (respectively). Valuerin et al.74 and Siupsinskas et al.73 reported varying values for asymmetry in reach directions or limb differences, though no relationships to future injury risk were noted. Finally, Butler et al.3 did not observe significant differences in reach asymmetry between injured and uninjured football players.
Individual Reach Directions Distance
Five studies34,36,50,69,71 described the relationship between injury and individual reach directions. Four of these studies34,36,50,69 reported normalized reach distances for all reach directions, with no significant difference noted between injured and uninjured subjects.
Johnston et al.71 examined the relationship between the anterior reach and future concussions. Using an inertial sensor, rugby players with increased sample entropy when reaching in the anterior direction were found to be 3 times more likely to sustain a concussion. No association between posteromedial and posterolateral reaches to concussion was noted.
Composite
One3 of 13 studies3,31,34,39,48,50,57,64,68,69,72–74 found a relationship between composite score and future injury. Butler et al.3 reported an odds ratio of 3.5 (95%CI 2.4-5.3) when using a cutoff of 89.6% (SN=100%, SP=71.7%) in football players. Wright et al.50 and Brumitt et al.57 utilized different composite cutoffs for athletic teams, ranging from 89-94%, all yielding non-significant likelihood ratios (ranges 0.55-1.32 and 0.50-1.70, respectively). Nine studies31,34,39,48,68,69,72–74 did not report significant relationships between composite scores and future injury.
Three studies34,64,69 examined the relationship between composite score asymmetry and future injury. Gonell et al.34 and Ruffe et al.64 both utilized 12cm or greater threshold for asymmetry and no relationship to injury was noted. De la Motte et al.69 found no significant differences in composite asymmetry between injured and uninjured military personnel (p=0.50).
DISCUSSION
Testing is an important function for researchers, health care providers, and performance professionals. Many decisions hinge on test results, and it is essential to have validated tests in this process. While commonly used, the YBT-LQ has not been rigorously studied via systematic review and meta-analysis. This systematic review observed that the YBT-LQ is a highly reliable test. Dynamic balance differences were observed between sex, sport, and competition level, and asymmetry in the anterior reach demonstrated increased risk of lower extremity injury.
Reliability
The YBT-LQ demonstrated high reliability over time and between raters. The high YBT-LQ reliability is comparable to the SEBT, which highlights the ability of the YBT-LQ to accurately measure dynamic neuromuscular control.9 Higher variability in single session performance on the YBT-LQ in children may be due to the greater variability of balance performance seen in children.75
Difference in YBT-LQ by sex, sport, and competition level
Sex differences
When sex was considered alone, differences were observed in the posteromedial and posterolateral directions, but no differences were observed between sexes in the anterior reach direction or in composite score. While it may appear that there was not a difference between sexes in composite score, it is important to note that there was large variability in each sex, sport, and age/competition level in YBT-LQ performance. This was confirmed by the high heterogeneity observed indicating that there indeed may be differences in performance on the YBT-LQ among populations (i.e., age, sex, sport, activity, occupation, and injury status). This overall heterogeneity helped confirm that sex, sport, and competition level differences may exist. Thus, when the pooled means were analyzed, no differences were noted. Composite reach scores varied by as much as 13 %LL depending on the sex, sport, and competition level. These differences may point to the differences seen in injury rate and type by sex.76
Sport differences
There were significant differences observed between baseball and basketball in the posteromedial, posterolateral reach directions, and overall composite reach, with baseball demonstrating greater reach distances normalized to limb length. There were also differences observed between soccer and basketball in the anterior, posteromedial, posterolateral reach directions, and overall composite reach, with soccer demonstrating greater reach distances normalized to limb length. This may be due to sport specific adaptations in dynamic balance based on the demands and environment of the sport. For example, while both sports spend time running, soccer spends more time in unilateral stance at the limit of stability (e.g., kicking the ball) compared to basketball.77 While these differences may be due to sport specific adaptations, or limb dominance, specifically greater dynamic balance strategies on the stance leg during the kicking motion, it is also worth noting that dynamic neuromuscular control differences could be due to disparate anthropometric body types in athletes. For example, basketball players may in general have longer femurs than soccer players, which may make single limb squatting (i.e., anterior reach) biomechanically more difficult for basketball players.
Population differences summary
There were significant differences across populations by sex and sport in YBT-LQ reach distance. There were not enough studies to analyze all the possible sex, sport, competition level permutations; however, it was clear that differences exist. For example, when male Rwandan high school soccer players were compared to male high school soccer players from the United States, the posteromedial and posterolateral reach distances were not different.12 However, there was a significant difference in anterior reach and composite score. This shows YBT-LQ performance can potentially be affected by environment factors (e.g., in Rwanda there is less frequent wearing of athletic shoes and more frequent deep squatting for activities of daily living compared to the United States).12
It is interesting to note, that not only sex, sport, and environment might influence YBT-LQ performance, but also biological maturation. Researchers have found that YBT-LQ reach distance was significantly associated with the total Balance Error Scoring System score as YBT-LQ anterior and posteromedial reach distances.78
Injury prediction validity of the YBT-LQ
Since there were sport and gender differences in YBT-LQ, predictive studies could only be analyzed if they used a population specific cut point or examined homogeneous populations (e.g., male collegiate football players). Cut points for asymmetry and composite score varied
between studies. Due to these differences, composite score was found to be predictive of future injury in one study.3 More research is needed to develop these population-specific cut points to more accurately determine future injury risk.
Lehr et al.5 used population specific cut points across multiple sports. The researchers found that accurate injury risk identification was possible when multiple risk factors, including the YBT-LQ, were combined. The authors used age, sex, and sport specific risk cut points to place athletes in risk categories. These cut points were based on previously published injury prediction studies and normative databases.5 Thus, it is important to include age, sex, and sport cut points for injury risk identification. This study was not included in the meta-analysis since the researchers included multiple risk factors and the YBT-LQ was not able to be isolated as a risk factor. Further, Teyhen et al.79 found using a multifactorial model in soldiers that included YBT-LQ: Anterior Reach ≤ 72% limb length as one of the risk factors in the model. This study further illustrates the point that YBT cut points are population specific but also that the YBT should be used as part of a multifactorial model rather than a single risk factor in isolation.
Six studies34,36,39,48,50,68 examined reach asymmetry as a predictor of injury. Four of the studies found a positive relationship between injury risk and reach asymmetry. However, there was variability in the definition of “asymmetry” with a wide cut point range and different risk reporting methods (e.g., odds ratios, likelihood ratio, sensitivity, and specificity). Thus, there may be an association with reach asymmetry and injury risk, but this was difficult to quantify given the variability of data reporting and analysis. Given that sport and sex differences were observed, it is likely that tolerance for asymmetry and direction of asymmetry may differ by sport or population. While asymmetry is an absolute value that is relative to the individual, it also may need population specific cut points, like composite score. A meta-analysis was not performed and definitive conclusions could not be drawn.
Limitations
While 57 articles were included in this review, there were not enough studies (even when combined) to provide enough power to compare populations by the different combinations of sex, sport, and competition levels. A meta-analysis on the YBT-LQ predictive ability was not completed because only two studies were found that used homogeneous methodology and reporting measures. YBT-LQ reach asymmetry as a predictive factor was not analyzed due to the highly variable reported risk cut points. Two studies9,40 were low quality, while the rest were moderate and high quality. Furthermore, some of the studies had high heterogeneity in the specific YBT-LQ methodology (hands free versus hands on hip, maximum versus average reach, etc.). Due to the study risk of bias stratification, and the methodological heterogeneity, these findings need to be taken with some caution. The YBT-LQ is a controlled dynamic balance test. As many sport injuries are sustained at high velocities and forces, the YBT-LQ does not mimic some sport mechanisms of injury, which decreases the transferability of these results to the sport setting. Finally, this systematic review investigated athletic and active populations; thus, these findings cannot be generalized to all adult populations (inactive adults, geriatrics, etc.).
RECOMMENDATIONS FOR FUTURE RESEARCH
From this meta-analysis, it is clear that populations when stratified by sex and sport perform significantly differently on the YBT-LQ. This has two large implications. First, future research needs to establish normative data for a wide range of populations that utilize this test. Second, injury predictive studies need to use population specific (e.g., age, sex, sport/activity) cut points for composite score and reach asymmetry. For asymmetry, these cut points should be greater than the standard error of measure (3.2cm),9 so that meaningful asymmetry, beyond the error of measure, can be identified. Further, given the findings of Lehr et al.5 and Teyhen et al.79 it may be most appropriate to combine the YBT-LQ asymmetry and composite score specific to age, sex, and sport, along with other testing to accurately determine injury risk. Interestingly, country of origin seemed to impact performance; thus, cut points may need to specify beyond the aforementioned factors to include geographical location. Future research should use adequately powered and homogenous age, sex, and sport/activity specific analysis to determine if composite score is related to injury risk.
CONCLUSION
The YBT-LQ is a reliable tool for capturing dynamic single leg neuromuscular control at the limits of stability. Performance on the YBT-LQ differs based on age, sex, and sport, therefore clinicians should consider these factors when interpreting results to ensure accurate clinical decision-making. The relationship between the YBT-LQ and future injury risk remains unclear; future studies should utilize population specific cut points and homogenous samples to determine utility in injury prediction.
Data sharing statement
This study is registered with PROSPERO, and the protocol can be found at https://www.crd.york.ac.uk/prospero/ with the identifier Prospero CRD42018090102.
Conflicts of Interest
Funding for payment of a graduate research assistant was made possible through the Ridgeway 488 Student Research Award from the University of Evansville.
Dr Phillip Plisky developed the Y-Balance Test Protocol and Test kit and receives royalties from the sale of the Y-Balance Test kit.