INTRODUCTION
Balance studies generally report statistical effects for magnitude and/or variability of measured outcomes such as center of pressure (COP) or center of mass (COM). Frequently, these effects are assessed using the component dimensions of the signal, roughly aligned with the anteroposterior (AP) and mediolateral (ML) anatomical planes. Another approach is to use the resultant signal, which may increase the likelihood of observing meaningful effects, but in doing so obscures potentially important information related to directionality.
Whether referring to component or resultant analyses, greater magnitude of motion is conventionally considered to reflect postural control deficits.1 In the context of sports medicine, it is common to observe increased postural sway following injury to the lower extremity or brain,2 which may affect various combinations of peripheral sensation, central integration, and motor effectors. While this perspective of sway is prevalent among both clinicians and scientists, recent work may suggest a more nuanced meaning of postural motion.3–6 Considering the context-specific nature of recent findings—particularly those that seem to challenge the presumed meaning of COP/COM outcomes—it is possible that prevailing analytical approaches are not sufficiently specific for use in broad-ranging clinical applications.
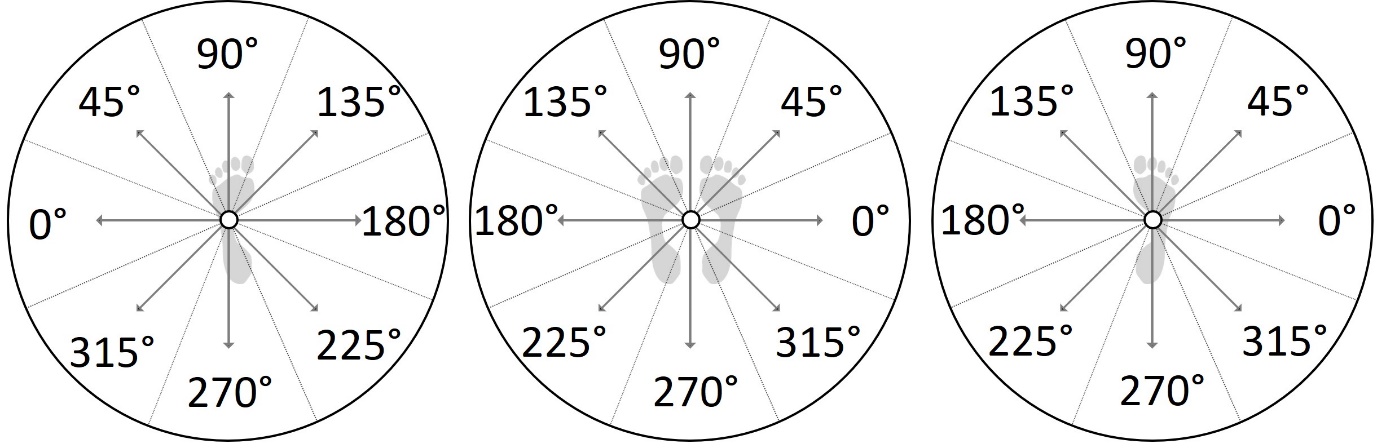
Meaningful postural behavior may occur outside the cardinal anatomical planes.7 It is known from perturbation and sensory manipulation paradigms that localized stimulus can induce sway behaviors in specific directions (such as depicted in Figure 1). Such responses are likely mediated by a variety of sensory8,9 and motor10 components of postural control and could suggest the presence of similar directional tendencies in spontaneous (i.e. quiet, unperturbed standing) sway when an individual’s sensorimotor adaptations result in localized variation in the ability to create and/or control postural motion. If quantifiable, these tendencies may present an opportunity for creating more descriptive measures of balance behavior while also providing insight into observations that conflict with conventional understandings of postural control. Further, profiles of such directional tendencies may partially control for the dependence of balance measures on anthropometric factors as such profiles can be assessed not only on the basis of their magnitude, but also their shapes or patterns.
One factor that may contribute to directional specificity within postural sway behavior is training history. Sport-specialization at the varsity collegiate level would hypothetically create reasonably homogeneous groups differentiated by the influence of training adaptations on balance behavior. The athletic adaptations that are generally most relevant to performance vary across the sports sampled in this study. Soccer prioritizes speed, power, and endurance, with long-duration sprints, numerous turns, jumps, and changes in speed and direction.11 Tennis involves repeated bouts of rapid acceleration and deceleration, frequent changes in direction, and high-intensity frontal and transverse motion of the upper body.12,13 Basketball, like tennis, is characterized by frequent changes in direction, starts and stops, and movement mode transitions including lateral shuffling, with a relatively greater emphasis on frequent high-power vertical jumps. Finally, relative to the comparison sports used in this study cross country prioritizes sustained forward running gait with associated sagittal plane foot mechanics and comparatively small adjustments in the mediolateral direction.
The purpose of this study was to quantify the effects of sport-specific training history on directional profiles of center of pressure displacement and velocity among collegiate athletes. Based on the attributes summarized in the preceding paragraph, the authors hypothesized that participation in basketball and tennis will be characterized by a greater degree of control in the medial and lateral headings when compared with soccer and cross country.
METHODS
This research was approved by The University of North Carolina at Greensboro Institutional Review Board. All participants provided written, informed consent prior to participating. Division I collegiate varsity athletes performed a series of balance tests as part of an annual, station-based preparticipation exam. The sample included 80 female (19.12±1.08 years, 169.79±7.03 cm, 65.69±10.43 kg) and 87 male (19.59±1.33 years, 181.25±9.06 cm, 76.40±12.73 kg) participants representing 4 varsity sports: basketball, soccer, tennis, and cross county. The present analysis is limited to those subjects who were cleared for sports participation at the time of data collection and had no history of lower extremity surgery or fracture. Data were averaged across years for any athletes with data from multiple years.
Subjects performed one trial each of double leg and single leg stance (each limb tested once). Subjects were familiarized with the task, but were not allowed to practice. The dominant limb was defined as the limb one would stand on when kicking a ball for maximum distance.14 All trials were completed with bare feet, eyes closed, and hands on hips. Athletes were instructed to remain as motionless as possible for the duration of each 10 second trial. Stance width in double leg stance was determined by height using short, medium, and tall guidelines commonly applied in dynamic posturography.15 For single leg trials, the long axis of the foot was aligned with the forward/backward axis of the force plate. Participants were instructed to touch down on the force plate if unable to complete a single leg trial.16 In order to prevent such touch downs from excessively influencing the data, single leg trials in which COP displacement exceeded conservative boundaries defined using criterion data from the authors’ prior work17 were discarded. Any discarded trial was discarded in its entirety. That is, all analyzed trials were 10 seconds in duration.
Ground reaction forces were recorded at 100 Hz using an AMTI Accusway force plate (AMTI Inc., Watertown, MA) and used to create time histories of AP and ML COP coordinates, which were then low-pass filtered (2nd order Butterworth with a cutoff frequency of 13 Hz).18 Subsequently, a directional heading was calculated at each sample of the differenced COP time series using the atan2 function in base R (The R Foundation, Vienna, Austria). All heading time series samples were then discretized into one of eight equally-spaced, nonoverlapping bins with each accounting for a 45° (≈ 0.79 radians) arc (Figure 1). For double leg trials and single leg trials on the right limb, 0° corresponded to the subject’s right. For single leg trials on the left, 0° was redefined as corresponding to the subject’s left and positive rotation was redefined as clockwise. Therefore, the anatomical meaning of the heading bins for single leg trials does not depend on whether the right or left leg was used (Figure 1).

Average COP velocity and total displacement were then calculated within each directional bin and used for further analysis. Two points of clarification should be noted: 1) Each data point’s heading is expressed relative to the previous data point rather than the coordinate system origin. Because of this, absolute positioning of the participant’s foot on the force plate does not affect results; only foot orientation is important. 2) Computations of within-heading COP velocity and displacement involve only those data points in which the COP was moving positively (i.e. forward) in the associated direction. Thus, for example, a datapoint adding to displacement within the 90° bin would not also subtract from displacement in the reciprocal 270° bin.
The effect of sport on the average COP velocity and total displacement vectors in each heading was examined using profile analysis.19 Profile analysis is akin to a multivariate version of repeated measures ANOVA in which vectors of the dependent measure are evaluated for null hypotheses related to parallelism, equality, and flatness in that order. In practical terms, a rejection of parallelism would indicate that distribution of COP displacement or velocity within different heading bins varies by sport. A rejection of equality would indicate that average COP displacement or velocity, but not their distribution within heading bins, differed by sport. Lastly, a rejection of flatness would indicate that COP velocity or displacement vary by heading, but that sport had no effect on average or within-heading magnitudes. While the present analyses were conducted in keeping with standards for profile analysis, it should be noted that, because the vectors are not expected to be flat in this case, neither rejections of flatness nor comparisons between heading bins collapsed across sport are of great interest to the present study.
The effect of sport at individual levels of COP heading was tested using one-way ANOVA models with sport as the grouping variable. These models should be considered exploratory where not predicated by significant findings for parallelism or equality. Pairwise comparisons were performed with the false discovery rate controlled using the Benjamini-Hochberg method.20 Finally, for purposes of comparing the results of the current study with more conventional methods of analysis, one-way ANOVA models for average total COP displacement and velocity are also presented.
RESULTS
From the greater station-based preparticipation exam, a total of 776 balance trials met the criteria for inclusion in analysis. Of these, 165 trials (~21%) were discarded on the basis of exceeding screening boundaries. Three additional trials were excluded due to coding errors.
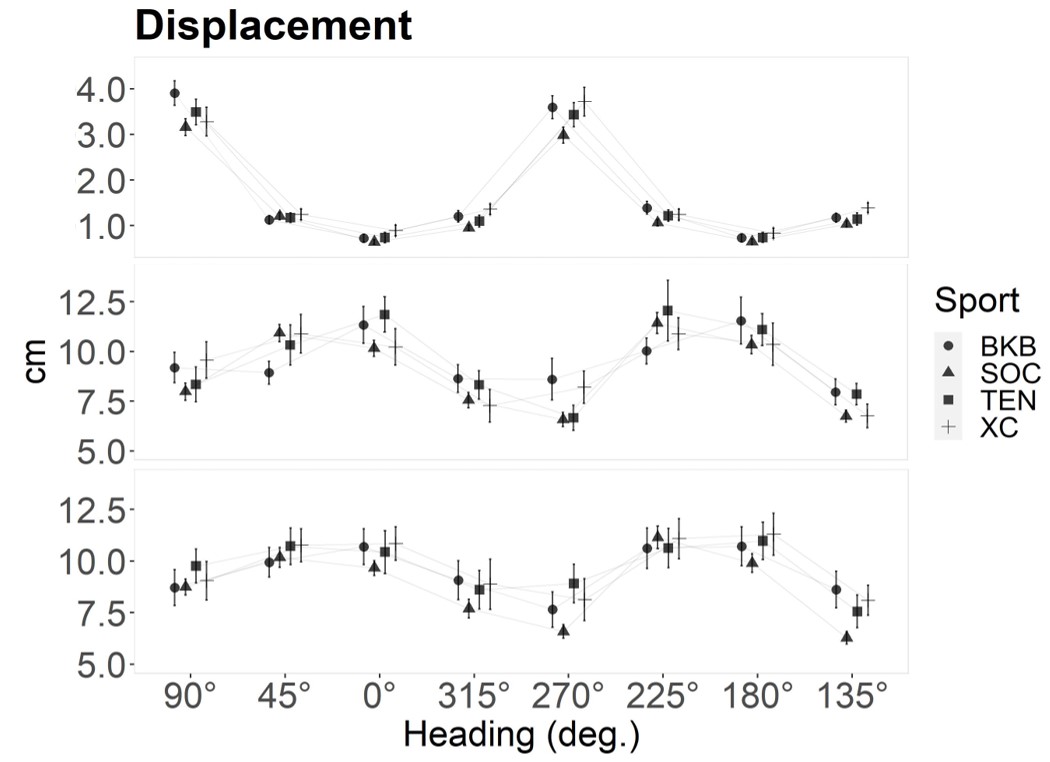
Parallelism of the total displacement summary vectors (Figure 2) was rejected for double leg stance (Wilks Λ = 0.813, F~(21.00, 445.63)~ = 1.590, p < 0.05) and single leg (dominant limb) stance (Wilks Λ = 0.752, F(21.00, 353.74) = 1.756, p = 0.02). Neither parallelism nor equality was rejected for single leg (non-dominant limb) stance (parallelism: Wilks Λ = 0.849, F(21.00, 339.38) = 0.946, p = 0.53; equality: F(3.00, 124.00) = 1.507, p = 0.22). Following these nonsignificant tests for parallelism and equality, flatness was rejected for single leg (non-dominant limb) stance displacement profiles (flatness: F(7.00, 118.00) = 18.799, p = 0.01).
__.jpeg)
Significant follow up contrasts for within-heading displacement (Table 1) in double leg stance were observed in the 135° (anterior/left) and 315° (posterior/right) headings, wherein displacement was greater in cross country than in soccer. The follow up contrast for average (i.e. all headings) displacement was also significant, with greater displacement in both basketball and cross country when compared with soccer. Significant follow up contrasts for within-heading displacement were also observed in single leg (non-dominant limb) stance. Here, displacement in the 135° (anteromedial) heading was significantly greater in basketball than in soccer. The follow-up contrast for the 270° (posterior) heading was significant at the omnibus level; however, no significant pairwise effects were observed.
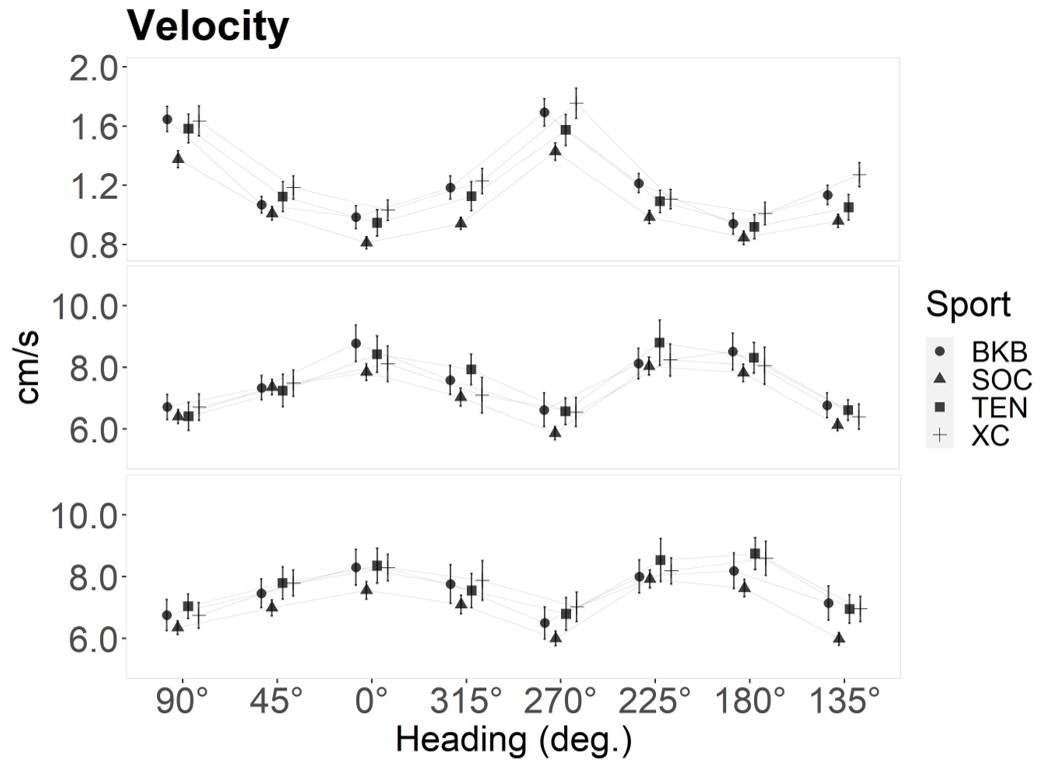
Parallelism of mean velocity vectors (Figure 3) was rejected for double leg stance (Wilks Λ = 0.799, F(21.00, 445.63) = 1.724, p = 0.025). Neither parallelism nor equality of the vectors of mean velocities was rejected for single leg (dominant limb) stance (Wilks Λ = 0.845, F(21.00, 353.74) = 1.017, p = 0.44; equality: F(3.00, 129.00) = 0.588, p = 0.62). Similarly, neither parallelism nor equality of the vectors mean velocities was rejected for single leg (non-dominant limb) stance (Wilks Λ = 0.856, F(21.00, 339.38) = 0.896, p = 0.60; equality F(3.00, 124.00) = 1.457, p = 0.23). Flatness of the mean velocity vectors was rejected for both single leg stance conditions (dominant limb: F(7.00, 123.00) = 34.950, p = 0.01; non-dominant limb: F(7.00, 118.00) = 31.561, p = 0.01) stance.
Follow up contrasts for within-heading velocity (Table 2) in double leg stance indicated significant effects for sport in the 0° (right), 90° (anterior), 135° (anterior/left), 225° (posterior/left), 270° (posterior), and 315° (posterior/right) headings, as well as the all-heading average. Pairwise contrasts indicated greater COP velocity in cross country compared with soccer in the 90° (anterior), 135° (anterior/left), 270° (posterior), and 315° (posterior/right) headings, as well as for the all-heading average COP velocity. Additionally, greater COP velocity was observed in basketball when compared with soccer for the 90° (anterior), 225° (posterior/left), and 315° (posterior/right) headings. The follow-up contrast for single leg (non-dominant limb) stance COP velocity in the 135° (anteromedial) heading was significant at the omnibus level; however, no significant pairwise effects were observed.
DISCUSSION
The purpose of this study was to quantify the effects of sport-specific training history on directional profiles of center of pressure displacement and velocity among collegiate athletes. The principle finding was that profiles of COP motion in specific headings vary by sport. Specific differences by sport were observed for double leg COP displacement in the 135° (anterior/left) and 315° (posterior/right) headings (cross country > soccer), non-dominant limb single leg COP displacement in the 135° (anteromedial) heading (basketball > soccer), double leg COP velocity in the 90° (anterior), 135° (anterior/left), 270° (posterior), and 315° (posterior/right) headings (cross country > soccer), and double leg COP velocity in the 90° (anterior), 225° (posterior/left), and 315° (posterior/right) headings (basketball > soccer). The hypothesis regarding relatively greater control of COP motion in the medial and lateral headings among basketball and tennis players was not supported. However, some observations may suggest that training adaptations in basketball may preferentially affect postural control in off-sagittal headings in ways that are less evident in other sports. Because this study featured NCAA Division I athletes, sport-specific adaptations likely play a role in the observed differences. This discussion first considers whether the present observations agree with previous findings. On this topic, comparison is mostly limited to the more conventional AP, ML, and resultant metrics. The authors then address adaptations that might contribute to the patterns observed, emphasizing that their observations may result from preferential adaptation of different postural regulatory mechanisms or directional specificity within these mechanisms.
Published findings concerning the effect of sport specialization on non-cardinal direction COP motion are lacking. Athletes generally control their posture better than non-athletes, and increasing levels of competitiveness appear to strengthen this effect.1,21–23 Balance test performance is also known to vary by sport, possibly reflecting sport-related adaptations.21,24 As is the case in the current study, previous work has found more confined postural motion in soccer than in basketball whether through clinical rating24 or laboratory instruments.25,26 There is some evidence for a similar effect in tennis and basketball in single leg stance, although the study in question also reports substantially lower COP path length for tennis in comparison with soccer, which contrasts with the current findings.26 Thus, these results are somewhat novel by virtue of the sports compared but appear to align with previous findings regarding postural control in soccer and basketball.25,26
The relevant adaptations to specific training involve changes in muscular properties; vestibular or proprioceptive sensory function; or central processing at varying levels of involvement.22 Visual adaptations are intentionally not considered as the trials in this study were performed with eyes closed, which should exclude the ability to use visual information in direct support of maintaining balance from affecting the present results. Further, the adaptations contributing to balance control in the study participants—especially for basketball, soccer, and tennis—are likely non-visual in nature as visual attention must largely be allocated to game play.27 Even so, the authors acknowledge here the possibility that visual adaptations may affect balance behavior to the extent that different athletes may have varying levels of visual dependence.
__sing.jpeg)
Greater strength and power of the lower extremity has been shown to correlate with better balance control.28 This could manifest as decreased COP motion in higher-strength/higher-power sports (e.g. basketball, soccer, tennis), with directional tendencies perhaps indicating sport-specific movement characteristics. The best case for such an argument in this dataset would likely be double leg stance, in which COP displacement and velocity tended to be highest for cross country athletes. Notably, both velocity and displacement in dominant-limb single leg stance appear to tell a contrasting story for cross country. Off-sagittal control of COP in cross country athletes was often good in comparison with other sports (differences non-significant) where it was expected that they would tend to perform comparatively poorly.
With one exception, follow-up models for COP displacement in single leg dominant-limb stance were nonsignificant at the pairwise level. Certain effects likely contributed more than others to the rejection of parallelism in this case. A relatively greater degree of COP motion for basketball in the 270° (posterior) heading, which appears confined to dominant limb displacement, may relate to well-developed plantarflexors and their influence on COP motion in these athletes.10 COP displacement in basketball is also higher than all other groups in 135° (anteromedial) and the opposing 315° (posterolateral) headings. Interestingly, this pattern is reversed in the perpendicular axis defined by headings 45° (anterolateral) and 225° (posteromedial).
It is not immediately clear why this unique drop in single leg (dominant limb) COP displacement along an anterolateral-to-posteromedial axis would be observed in basketball athletes and not others. The most obvious distinction of basketball performance is the greater involvement of vertical jumping relative to the other sports included in this study. While the dominant limb is defined as the stance limb used when kicking a ball for maximum distance, it is feasible that this definition would correspond with the preferred push-off limb used for unilateral jumping. Therefore, although non-significant, the observed trend may relate to unilateral vertical jump adaptations. It is worth noting that limb dominance does appear to be factor both for COP displacement and velocity. For example, the relative deficits in COP displacement control for basketball in the 90° (anterior) and 270° (posterior) headings and the relative advantages in the in 45° (anterolateral) and 225° (posteromedial) headings are far less pronounced for the non-dominant limb.
The potential mechanisms contributing to the present observations include directional strength and power adaptations at the muscular level, along with their complementary neural adaptations. In the study sample, subcortical and spinal reflexive loops may be most influential considering the simplicity of the task (i.e. quiet, unperturbed stance).29 While neural plasticity at these levels has been demonstrated in response to training generally,22 direct comparisons between sports are again scarce. In the case of differences between soccer and basketball25, the observations coincided with a relative increase in high-frequency components of COP motion for soccer, which the authors contend could indicate greater use of somatosensory postural regulation mechanisms. As the competition level increases for multidirectional athletes, there are also tendencies for increased proprioceptive acuity30 and more efficient use of vestibular information.23 This might be expected both as a consequence of their training stimulus and from visual resources being allocated elsewhere during play.
Two additional potential mechanisms bear consideration, although based on what is currently known it would be premature to draw strong conclusions regarding their involvement. The first is cutaneous feedback, through which potent directional effects have been demonstrated.8,9 These effects may have analogs which operate at the level of spontaneous COP motion where training or injury affect the intrinsic properties of involved structures. It is not clear whether such training adaptations exist, particularly in relation to shod activities.31 The second potential mechanism is the muscle synergy, a synchronous muscle activation pattern which theoretically serves to reduce the complexity of motor tasks.32 Muscle synergies have been temporally linked to specific compound COP motions in voluntary leaning tasks10 and in reaction to perturbations.32 This would appear to be a likely contributor to the extent that reactionary postural control behavior overlaps with chronic training-induced, static, unperturbed balance. Current evidence to support a training effect in postural muscle synergies is speculative.33
Several limitations should be noted in this study. First, a single, 10-second trial may not be sufficient to create an accurate representation of spontaneous directional COP behavior. Decisions regarding number of trials, trial duration, and forgoing practice were intended to optimize throughput during high-volume testing sessions. Scheduling constraints also precluded controlling for periodization cycles or any variation in training status associated with proximity to competition season. Lastly, it was determined that enrollment was not sufficient to allow for exclusion based on injury history beyond the criteria specified in the methods section.
In summary, directionally-specific spontaneous COP motion appears to be associated with sport type in varsity collegiate athletes. Specialization and training status within this population may suggest that sport-specific adaptations are partially responsible for the observed patterns. These adaptations likely reflect the sensorimotor demands of a given sport, including lower extremity strength and power, proprioceptive acuity, and efficiency of integrating vestibular information.
CONCLUSIONS
The results of the current study indicate that profiles of COP motion in specific headings vary with sport-specialization at the collegiate varsity level. Analysis of directional tendencies in postural control tasks could enhance the scientific and clinical utility of balance assessment in athlete populations. Potential future applications include increasing the specificity of reference norms used where baseline data are unavailable, as well as evaluating training effects that may have direction-specific influences on sway behavior. Additionally, while this manuscript focuses on training adaptations specific to athletes of collegiate sports, comparable COP/COM signatures associated with injury may exist. If injuries have directionally-specific balance effects (or causes), similar analyses could be used to provide information relevant to prevention or treatment in individual clinical cases.
Conflict of Interest Statement
The authors have nothing to disclose.