INTRODUCTION
Popularity of Olympic-style shooting events has grown since the first Olympics in 1896.1–3 The sport has been present in the summer Olympics since 1896 and in the winter Olympics since 1924.1–4 Women started competing in the summer Olympics in 1968 and in the winter Olympics in 1992.2,4 According to the International Shooting Sport Federation (ISSF), the 2016 summer Olympics, in Rio de Janeiro, Brazil had 390 athletes in summer Olympic-style shooting events.2 The 2018 winter Olympics in PyeongChang, China had 230 athletes in shooting events.5 Despite the growing popularity of the sport and representation at the summer and winter Olympics and other events, the types and prevalence of injuries in competitions is unknown.
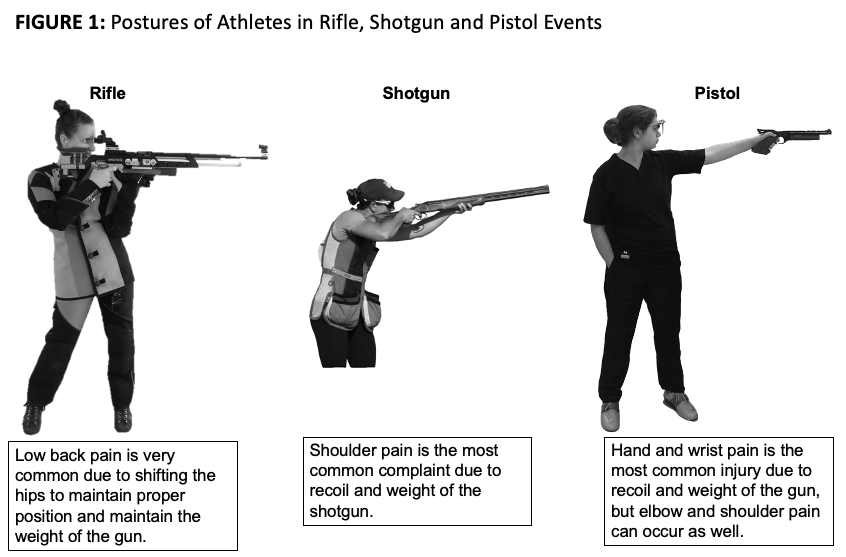
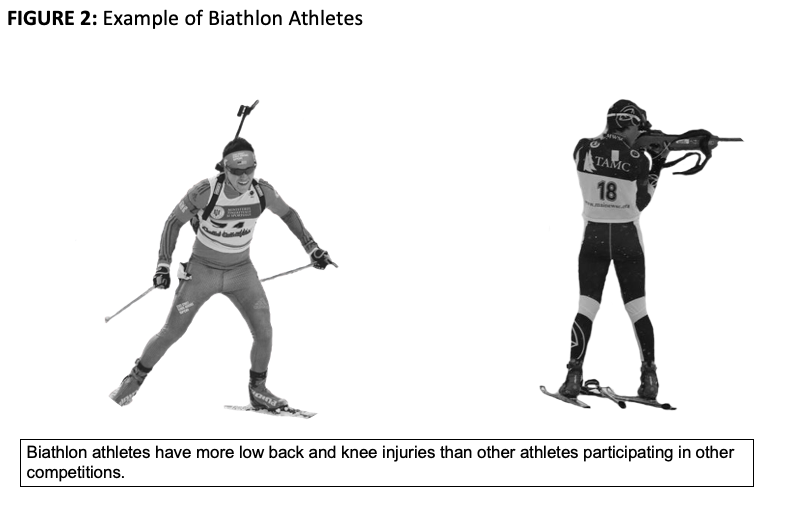
Injury surveillance studies have found the prevalence of injury for athletes of shooting events in the Olympics to be as low as 0.78%6 or as high as 6.90%.7 These studies defined the included injuries as acute, and may not capture the chronic musculoskeletal injuries that commonly affect athletes that compete in shooting events.6–8 By only focusing on acute injuries, this could underestimate the needs of these athletes and limit the amount of resources allocated. Summer Olympic shooting events include rifle, pistol, and shotgun.1,2 Winter Olympic events include the biathlon as it is a combination of target rifle shooting and cross-country skiing.4 The different physiological demands from each sport and the use of different types of firearms may lead to injuries in specific body parts (i.e. neck, shoulder, low back) (Figure 1, Figure 2).8 Across the events, pistol shooters tend to have more wrist injuries, shotgun shooters tend to have more shoulder injuries, and both rifle and biathlon typically have more low back injuries.8


The purpose of this study was to systematically review the literature to examine the available evidence regarding the incidence, prevalence, and types of injuries that affect athletes in Olympic-style shooting events. The authors hypothesized that 1) injury rates for Olympic-style shooting events would be low due to the emphasis of acute injury tracking in the literature, since these athletes typically endure chronic musculoskeletal injuries 2) injury rates would be higher in biathlon winter Olympic style shooting events than summer Olympic shooting events due to the increase physiological demand, and 3) athletes who use a rifle or shotgun would have higher injury rates than athletes participating in events with handheld firearms due to the differences in shooting position.
METHODS
Study Design
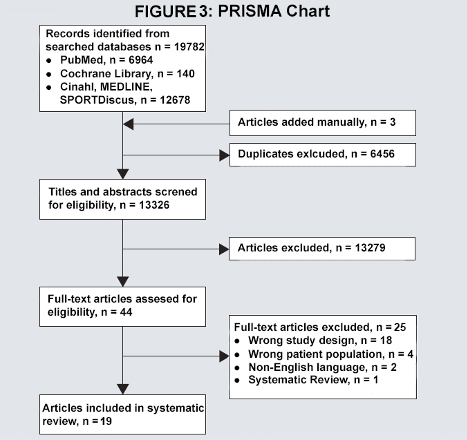
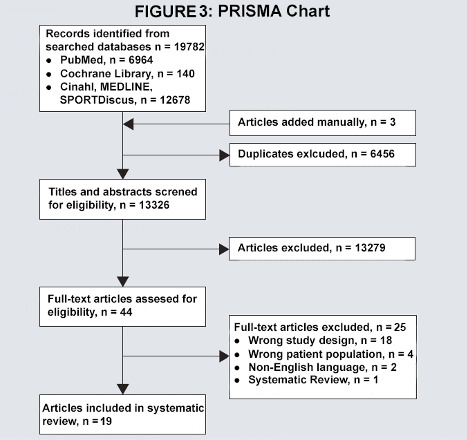
This systematic review was performed with the guidelines of the Preferred Reporting Items for Systematic Reviews and Meta-Analyses (PRISMA) (Figure 3).9 The systematic review was registered in PROSPERO (CRD42020152019).
Information Sources
An electronic search of five databases (PubMed, Cochrane Library, Cinahl, MEDLINE, and SPORTDiscus) was performed from inception to February 3rd, 2020. These databases were selected in order to find shooting studies related to sports medicine and to carry out the search strategy.
Searches
Each database was searched using key terms related to firearms, Olympic-style shooting events, and sports medicine (Appendix). These terms were developed based on Medical Subject Headings (MeSH) in PubMed.10
Eligibility Criteria
The research question was developed from the PICO question (Table 1). From the PICO question, eligibility criteria for included studies was determined. Studies were included if they met the following criteria: (1) reported injury rate, prevalence, or incidence of injury in Olympic-style shooting events (Olympics, World Cup, etc.) (2) English language, and (3) had full text available. Studies were excluded based on the following criteria: (1) non-Olympic style shooting event, (2) case report, (3) clinical commentary, (4) systematic review (5) expert opinion (6) non-peer reviewed study. Although systematic reviews were excluded, if they were of interest, the references were screened for inclusion.
Study Selection
The studies were identified and uploaded to Covidence, a systematic review tool created by a non-profit company in Australia to organize the study screening process.11 Two independent reviewers (MH, BU) independently screened the titles and abstracts using the aforementioned inclusion and exclusion criteria. A third reviewer (CM) resolved conflicts. This process was repeated for studies that qualified for full text review with two independent reviewers (MH, BU). A third reviewer (CM) resolved conflicts.
Quality Assessment of Studies
The internal validity of the studies was assessed by one author (BU) and confirmed by another (MH) using the NIH Study Quality Assessment Tool for Cohort and Cross-Sectional Studies.12 Based on the quality appraisal of included studies, the risk of bias was considered and a rating was assigned to each study according to the number of questions that had a ‘Yes’ response: Poor (1-5), Fair (6-8), or Good (9-14) (Table 2).
Risk of Bias Assessment
The Johanna Briggs Institute (JBI) critical appraisal tool, developed by the University of Adelaide in South Australia, was used to assess risk of bias for each study type by one author (MH) analytical cross-sectional studies and confirmed by another author (BU).29,30 A rating was assigned according to the number of questions that had a ‘Yes’ response: Poor (1-3), Fair (4-5), or Good (6-8) (Table 3).30,31 A ‘Good’ rating indicated a low risk of bias, ‘Fair’ a moderate risk of bias, and ‘Poor’ a high risk of bias. This process was repeated for cohort studies. A rating was assigned using the JBI tool specific for cohort studies according to the number of questions that had a ‘Yes’ response: Poor (1-4), Fair (5-7, or Good (8-11) (Table 4).30,31
Data Extraction
Extraction of pertinent information from each study included in the review was performed by the primary author (MH) and confirmed by another author (CM). Pertinent information included: author, year, setting (Olympics, World Cup, etc.), number of participants, age, sex, incidence of injuries, and prevalence of injuries. A custom designed table was created with the pertinent information that was extracted (Table 5).
Data Analysis
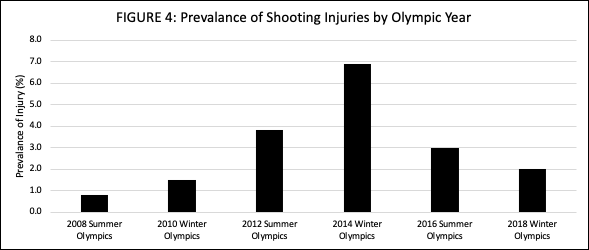
A descriptive analysis of the extracted data was performed. Data from all studies were compiled into a table to compare injury incidence and prevalence data from different years (Table 5). Data were formed into a chart to visually appraise some of the prevalence data (Figure 4).

RESULTS
Results of the systematic review yielded nineteen studies (Table 5). Of these studies, nine were on the Olympics, with three summer Olympics (Beijing 2008; London 2012; Rio de Janeiro 2016) and four winter Olympics (Nagano 1998; Vancouver 2010; Sochi 2014; PyeongChang 2018). Other studies included injury data from the Finland top athletes (1920-1965), International Shooting Championships (1983), Czech Internationals (1998), Females with Norwegian Biathlon Federation license (2007), Thailand National “Phitsanulok” Games (2008), Biathlon World Cup event (2008-2009), Turkish Shooting Sports Championship (2010-2011), National Sports Olympiad of Female University Students (2014), and Brandenburg, Germany sport schools (2015). In eleven of the studies, injury was defined as acute with pre-existing injuries not being recorded.5–7,13,16,22–27 Overall the prevalence and incidence of injury for athletes in shooting events was low, as most prevalence data was equal to or below 10% and five studies were at 0%.6,7,13,16–18,22–26
Quality Assessment
The NIH Quality Assessment Tool showed that ten of the nineteen studies had ‘Good’ overall quality, five had ‘Fair’ overall quality, and four had ‘Poor’ overall quality (Table 2). All studies clearly stated the research question/objective, clearly specified and defined study population, and selected/recruited subjects from same/similar populations with inclusion/exclusion criteria prespecified and applied. Four studies did not clearly define injury exposure measures or ensure they were valid, reliable, and implemented consistently. Nine studies assessed exposures more than once.
Risk of Bias
The JBI critical appraisal tool for analytical cross-sectional studies showed that six of the eight cross-sectional studies had ‘Good’ overall quality while two had ‘Poor’ overall quality (Table 3). Six cross-sectional studies clearly defined the criteria for inclusion in the sample and described the setting and subjects in detail. All the cross-sectional studies identified confounding factors, but only four stated strategies to deal with them. There was only one cross-sectional study that did not use an appropriate statistical analysis.
The JBI critical appraisal tool for cohort studies showed that ten of the eleven cohort studies had ‘Good’ overall quality and one had ‘Fair’ overall quality (Table 4). All of the cohort studies had groups that were similar and recruited from the same population, measured exposures similarly, had all the participants free of the outcome prior to the study, had sufficient follow up time for outcomes to occur, and completed the follow up. Only one cohort study did not use appropriate statistical analysis.
Summer Olympics
Since one study did not record an exact number of injuries sustained by athletes in shooting events, the average prevalence of injuries in the summer Olympics (2008, 2012, 2016) is between 1.53-2.53% with shooting having the lowest injury prevalence compared to all other sports.6,23,25,28 The prevalence of injuries by year was 0.78% (2008), 3.80% (2012), and between 0-3% (2016) (Figure 4).6,23,25,28 In the 2008 Olympics, 100% of the injuries occurred during training.6 One injury mentioned was a coracoid process fracture in a shotgun trap shooter.28 In the 2012 Olympics, one injury occurred during competition while the others resulted from overuse during training.23 In the 2016 Olympics, one severe injury was mentioned, with severe referring to the need for absence for longer than a week.25 Although it is unrecorded for the 2008 and 2016 Olympics, there was a higher percentage of females injured than males in 2012 (6.9%).6,23,25,28
Winter Olympics
The average prevalence of injuries in the winter Olympics (2010, 2014, 2018) was 3.47% with the percentage of injuries being one of the lowest out of all sports.7,22,26,28 The prevalence of injuries by year was 1.50% (2010), 6.90% (2014), 2.00% (2018) (Figure 4).7,22,26,28 In the 2018 Olympics, the prevalence of injury dropped.26 There was a higher percentage of males injured than females in the 2010 (1.9%) and 2014 (8.6%) Olympics.7,22,28
Three studies contained data that pertained to the Sochi 2014 Olympics. One was a systematic surveillance of injuries and illnesses, another was a surveillance of the Great Britain team at the winter Olympics, and a third was a prospective cohort study on the 2014 Paralympic games.7,16,24 There was a high percentage of biathlon injuries compared to other years, though none of these injuries occurred within the Great Britain team.7,24 With an incidence of 6.86%, four of the injuries occurred during competition and the rest occurred during training.7 Most of these injuries were from overuse with two requiring over a week of time loss from competition.7 In the 2014 Paralympics, the prevalence of injuries was 10% with the biathlon data being combined with cross-country skiing.16
Non-Olympic Events
A high prevalence of low back pain in shooters at the 1983 International Shooting Championships was seen with 78% of shooters reporting low back pain during competition and 63% reporting pain lingering after competition.20 In another study, there was a high number of participants at the 2008 Thailand National “Phitsanulok” Games with 771 shooters but zero injuries were reported.
At the 2008-2009 Biathlon World Cup Event, there was a high prevalence of injuries at 40.50%.15 Running was the primary cause of injury with most occurring during training.15 Low back injuries were the most frequent with other common injuries being knee and shoulder injuries.15 There was a higher overall number of injuries in females (39 vs 29), a higher number of lower back injuries (10 vs 4), and a higher number of knee injuries (7 vs 3).15
At the 2010-2011 Turkish Shooting Sports Championship, there was a prevalence of injuries at 12.80%.8 Most injuries were due to overuse with common injuries occurring in training being strains and muscles tears in the shoulder, calf-thigh, and hand-wrist.8 Common competition injuries were sprains, muscle tears, tendinitis, and sprains in the shoulder and foot-ankle.8 Rifle events showed a high risk of low back and shoulder injuries while pistol showed a high risk of hand injuries.8
A study that was performed on Czech International shooters showed a high prevalence of low back pain at 58%.14 Rifle shooters had a high incidence of spinal deviation/scoliosis while pistol shooters had the highest number of weak abdominal muscles.14 Other findings included neck pain, shoulder pain, thoracic back pain, and tightened muscles.14 Osteras et al. reported a high prevalence of injuries at 57.40% for females with Norwegian Biathlon Federation licenses.21 Knee injuries were the most frequent.21 The prevalence of low back pain was 10.8%.21 A study on National Sports Olympiad of Female University Students showed a relatively low prevalence of low back pain in shooters compared to other sports with a point prevalence of 9.9% and a life-time prevalence of 50.5%.19 Muller et al. researched adolescent athletes in Brandenburg, Germany sport schools and found a high back pain incidence in shooting and a prevalence of greater than or equal to 10%.13 An interesting finding from a study that assessed Finland’s top athletes from the years 1920-1965 was a low incidence of knee osteoarthritis in shooters with a prevalence of 3%.18
Sex Differences
There was a higher number of male shooters than females in each study that included both sexes.6,7,22,23,25,28 Females suffered a higher average percentage of injuries in the summer Olympics (males 1.7% vs females 6.9%) while males had a higher average percentage of injuries in the winter Olympics (males 5.25% vs females 3.05%).6,7,22,23,25,28 The incidence of injuries during the 2008-2009 Biathlon World Cup demonstrated the opposite with a higher percentage of injuries in females (males 39.7% vs females 54.4%).15 Zeman et al. reported females having more occurrences of weak abdominal muscles than males, thought to be due to a lack of strengthening.14
DISCUSSION
The purpose of this systematic review was to provide a collective understanding of the current literature and evidence of the incidence and prevalence data in Olympic-style shooting events. The first hypothesis that injury rate for Olympic-style shooting events will be low due to the emphasis of acute injury tracking in the literature, since these athletes likely endure more chronic musculoskeletal injuries was accepted. Injury rate for Olympic-style shooting events were low within studies that emphasized acute injury tracking.6,7,13,16,22–28 Fourteen of the nineteen studies had included data from a wide range of sports, while the remaining five studies had data that was just from shooting and biathlon events.6–8,13–28 Studies that analyzed injury rate of a wide variety of sports had more acute injuries, resulting in a relatively low percentage of injuries from shooting sports in comparison to other sports.6,7,13,16–19,22–28 The six studies that collected data on only shooting athletes at non-Olympic events had either no incidences of injury at all or had a high incidence rate from including incidences of pain within the injury rate in order to capture the full extent of physical demand the athletes go through.8,14,15,20,21
The majority of injuries that these athletes endured were likely not captured due to their chronicity.6,7,13,16,22–28 Athletes in shooting events tend to experience more chronic injuries than acute due to holding positions for long periods of time rather than undergoing sudden movements.8 More studies that seek to capture chronic injuries rates in injury surveillance are needed in order to better understand the extent of injuries that athletes in shooting events endure. If injury surveillance data only captures acute injuries for these athletes, then medical associations and event planners are likely underestimating the needs of these athletes. This could result in a lack of appropriate medical care and a lack of resource allocation
There was an overall lack of specificity in recording data for separate shooting events. Most studies combined all the events into one category of “shooting.”6,8,13,18,19,23,25,26,28 This does not capture the accurate injury rates since each event has different mechanisms of injury due to the differences in physical demands. These differences lead to distinct common injuries within each category. For example, shotgun events tend to have more shoulder injuries due to the contact of the firearm to the shoulder and the recoil while pistol does not have this contact and handles recoil differently. To effectively understand the medical needs of these athletes, data should be separated by event to show which events need more medical care and what specific injuries are more common to appropriately provide treatment.
The second hypothesis that injury rate would be higher in biathlon winter Olympic style shooting events than summer Olympic shooting events due to the increase physiological demand was accepted. The average injury rate was higher in biathlon winter Olympic shooting events than summer Olympic shooting events.6,7,22,23,25,26,28 This may be due to the added physiological demands as biathletes combine cross-country skiing with competition shooting. The summer Olympics had approximately the same percentages of injury rate each year, while the winter Olympics had a little more variance between years, having varied between 1% and 6.9%.7,22,26
The third hypothesis of this review was that athletes who use a rifle or shotgun will have higher injury rates than athletes participating in events with handheld firearms due to the differences in shooting position could not be confirmed. There was a lack of specificity in the available data to fully assess this hypothesis. Fourteen of the studies examined a wide variety of sports, leading to shooting sports being combined into one category instead of multiple. The only shooting sport that had its own category in each study, except for the 2014 Paralympic study, was the biathlon.7,16,22,26 Shooting event categories were only distinguished when listing specific injuries or if the study was seeking out the differences between the individual shooting events. Thus, it is unknown if one event had more injuries than the other, however trends were seen in terms of common types of injuries prevalent in each event. This is due to the different stances and demands placed on the body from the type of firearm being shot.14
Sex Differences
Injury rates for Olympic-style shooting events differed between sexes. Women had more injuries in the summer Olympics, while men had more in the winter Olympics.6,7,22,23,25,26 The increase in injuries for women in the summer Olympics may have been due to the style of the shooting events as they emphasize holding positions without the strain of cross-country skiing. It is possible that women experience more strain from holding these unnatural positions than men due to the differences in anatomy, particularly in the pelvis. Women have a wider pelvis and men have a more narrow pelvis.32 Other differences include increased muscle mass, increased bone density, and decreased fat in men.33 The winter Olympics saw the opposite in injury rates as men had more than women.7,22,26,28 This may be due to the anatomical differences in pelvic structure between sexes. The pelvic structure of women may lead to more injuries from the static shooting positions in the summer Olympics than the dynamic sport of biathlon in the winter Olympics.
Clinical Implications
Back pain, particularly in the lumbar region, has been shown to occur in elite athletes across many sports including shooting events.34,35 Identifying early signs of back pain can be important to prevent acute injuries from becoming chronic. Elite female athletes in particular may be more susceptible to this type of injury, shown in both previous literature34 and the present study. It has been suggested that female anatomy, such as a wider pelvis and lower muscle mass, may predispose the development of back pain in elite sports like shooting events.32–34 This present study revealed that a higher number of females have injuries in the summer Olympic events. These events require more endurance to hold positions compared to the winter Olympics, so it may be necessary for these athletes to undergo a proper strength training program with a focus on trunk stabilizing muscles and proper form while participating in this sport.
The results of this systematic review demonstrate a need to expand injury surveillance to not just include acute injuries, but to also consider chronic musculoskeletal injuries. This can better inform medical staff on the needs of these unique athletes. These athletes in particular may benefit from a robust injury prevention program to prevent chronic musculoskeletal injuries. Each shooting event requires athletes to maintain unnatural or strenuous body positions, as depicted in Figures 1 and 2. They also place different physiological demands on the body that challenge the focus of the athlete’s accuracy during the shooting event.1–4,8 Summer shooting events require the athlete to hold specific shooting positions for long amounts of time.2,8 Depending on the specific event’s time limit, rifle and pistol athletes may stand for one to two hours without leaving the firing line.2 The winter biathlon puts cardiovascular and musculoskeletal demands on the body for cross-country skiing before requiring a controlled breathing for the shooting portions.4 All shooting events require the ability to control one’s heartrate for improved accuracy.1 The type of firearm and the weight of the firearm can force the shooter to shift their center of balance and place prolonged stress on the neck, arms, trunk stabilizers, low back, and lower extremities.2,8,14 These rigid positions place much of the body weight, as well as the firearm weight, asymmetrically on the lower back, neck, shoulders, hips, and knees. With athletes having to hold specific postures for long periods of time, it is also likely that there needs to be a focus on ensuring the postures are safe and correct to prevent injury from occurring, as repetitive mechanical strain and extreme body positions have been implicated to contribute to back pain occurring in athletic populations.34 It has been observed that elite athletes who experience back pain may have a lower intensity of pain when they spend more time on back-strengthening activities.35 These activities may be particularly beneficial to shooting sport athletes due to the back strain that can occur from the traditional shooting postures.
Strengths and Limitations
This systematic review was the first to examine the literature for injury incidence and prevalence for shooting events. It utilized a search strategy to thoroughly search for relevant studies. However, several limitations were encountered. Although the research strategy was robust, only five databases were searched, which may have impacted the number of studies identified. Two had to be excluded due to being in languages other than English, further limiting the number of extracted studies. A limitation of some of the included studies (n=6) is that pain was classified as an injury based on the location of the pain on the body, and the underlying condition likely remained undiagnosed.13–15,19–21 This could lead medical staff to treat the pain location, rather than the cause of the pain, and could lead to suboptimal outcomes for the athlete. While pain itself can cause major limitations for athletes, it is also important to recognize if an underlying condition is present. Injury surveillance programs for Olympic firearm events should take this into consideration with injury tracking.
CONCLUSION
Injury incidence and prevalence was low for athletes in shooting sports compared to other sports. Future research should seek to capture injury incidence and prevalence data that is more relevant to the shooting sports by including chronic injury surveillance and seeking out injury rates for different shooting events. While the results of this systematic review indicate that there is a higher injury rate in winter Olympic events, likely due to increased physiological demands, the overall injury rates for each event may be low due to the lack of focus on chronic injuries. With the lack of data and the lack of differentiation between events, more data are needed to capture the effects that the type of firearm might have on prevalence of injuries. The sex differences in injury rates and the most common types of injuries should also be explored further. More research on injury surveillance may help with resource allocation and provide a better understanding of injury patterns for athletes that compete in shooting events.
Conflicts of Interest
The authors report no potential conflicts of interest in the development of this article.
Acknowledgements
The authors would like to thank Brendan Cyr, Amber M. English, and Emily Nothnagle for providing photos of the different shooting events.