
INTRODUCTION
Softball is a popular sport among athletes of all ages, and it is the third largest college sport for women, making up roughly 9.3% of total female athletes in the National Collegiate Athletic Association (NCAA) according to statistics from 2019-2020 data.1 In a given year at the collegiate level, there are an estimated 20,800 female softball athletes participating in roughly 995 softball programs across the country, and 296 of these are Division 1 schools, 288 are Division 2, and 411 are Division 3.1 Based on annual statistics, these numbers have been steadily increasing over the past decade with a total athlete participation increase of 17.3%.1
In baseball athletes, the overhead throwing motion is frequently associated with predictable adaptations at the shoulder joint on the throwing side which are believed to take place through a combination of humeral retroversion, posterior capsular thickening, and muscular tension.2–4 Additionally, reduced mobility and strength at the hip has been associated with impaired performance and injuries in both upper and lower extremities due to inappropriate compensation.5–8 While numerous studies have examined range of motion (ROM) and strength patterns in baseball players, few studies have explored these metrics in softball players. Even though the overhead throwing motion is similar for baseball players and softball position players, a study performed by Hibberd et al. showed that baseball players had significantly greater degrees of IR deficit and humeral retrotorsion when compared to softball position players.9 These results indicate that the physical adaptions in response to repeated overhead throwing in softball athletes may differ from baseball athletes. Therefore, performance training and injury prevention programs designed for baseball athletes may not be as effective for softball athletes.
In a study conducted by Oliver et al., ROM in the hip and shoulder joint in softball position players demonstrated significant side-to-side differences between throwing and non-throwing sides.10 However, no side-to-side differences were observed in pitchers.10 Since side-to-side deficiencies like glenohumeral internal rotational deficit and total arc motion deficit are associated with injury in overhead throwing athletes,8,11 position players may be at greater risk of injury when compared to pitchers. Some authors have suggested that the stress of the underhand windmill pitch may place pitchers at greater risk for shoulder injury than position players.12 Since there are distinct differences between the physical demands of pitchers and position players in softball, further study of how these athletes differ in terms of strength and mobility is warranted to help athletic trainers and team physicians design training and injury prevention programs.
Since Division 1 collegiate softball represents one of the most elite levels of competition in the sport, the information gathered from these athletes is important for understanding how strength and mobility correlates to performance. Some studies have described normal ROM and strength in softball players, but no studies have assessed how these metrics change over the course of a competitive season. The purpose of this study was to characterize range of motion (ROM) and strength at the shoulder and hip of healthy softball players and observe how these change after a competitive season, how they compare between throwing and non-throwing sides, and how they compare between pitchers and position players. By measuring change over a season, this study aims to better understand how the demands of a competitive season impact the strength and mobility profile of a healthy, competitive softball athlete.
METHODS
Participants
This was a longitudinal descriptive study including a prospective cohort of 54 college softball players who participated in at least one set of preseason and postseason measurements. Data were collected over the course of six competitive seasons with an average of 55 games played per regular season. Athletes were recruited from a single NCAA Division 1 softball team. Athletes were followed linearly as long as they had no reported injury or surgery within six months prior to preseason measurements and maintained active participation in their sport without reported injury. Because the purpose of this study was to characterize ROM and strength changes that occur in healthy athletes, athletes with recent injuries were excluded for concern that their measurements might alter the data due to ROM or strength limitations. A total of 54 healthy athletes were included, and no exclusions were made from preseason to postseason. A total of 127 player seasons were recorded.
Measurement Procedures
Participation involved a preseason and postseason assessment of passive ROM and strength at the shoulder and hip joint. Preseason measurements were taken prior to any organized preseason workouts, and postseason measurements were taken prior to regional tournament play towards the end of the season. Athletes did not perform a warmup prior to having measurements taken. In athletes who participated for multiple seasons (37 out of 54 athletes), each pair of preseason and postseason measurements was classified as a separate player season. A two-tester method was used for all measurements with one tester who was present for all measurements, and each measurement was performed only one time to avoid the effects of fatigue from testing athletes through multiple repetitions. Therefore, no measurement error values were included.
For ROM measurements in the shoulder, a goniometer was used to determine degrees of deviation from a standard position. Passive internal rotation (IR) and external rotation (ER) measurements were performed with the athlete in a supine position with the shoulder abducted 90° and the arm held in 90° of elbow flexion. One tester stabilized the scapula using a C-shaped grip with fingers on the posterior scapula and the anterior coracoid while passively moving the shoulder to end ROM in either internal or external directions. The second tester positioned the goniometer axis of rotation at the olecranon process with the stationary arm perpendicular to the table and the moving arm parallel to the shaft of the ulna. This technique, used in prior studies by this group of authors,13 has shown good interrater reliability with an intraclass correlation coefficient (ICC) of 0.43 and 0.88 for IR and ER measurements, respectively.14,15 Total arc of motion (TAM) was calculated by the sum of internal and external rotation in each shoulder.
For hip ROM, the athlete was placed in a prone position with hip at 0° of extension and abduction and the measured knee flexed at 90°. One tester stabilized the pelvis with one hand while rotating the hip passively until end ROM was reached. The second tester placed the bubble inclinometer proximal to the medial malleolus. The inclinometer was calibrated perpendicular to the plane of the table, and the reading was recorded at end ROM for hip rotation measurements. The axis of rotation was through the longitudinal shaft of the femur. This method, previously used by these authors in Zeppieri et al., has shown good interrater reliability with ICC of 0.98.16 TAM was calculated by the sum of IR and ER in each hip.
For strength measurements at the shoulder, a microFET 2 digital handheld dynamometer (Hoggan Health Industries, Salt Lake City, Utah) was utilized. The athletes were instructed to apply a maximal force against the force pad of the dynamometer for five seconds. To measure shoulder IR and ER strength, the athlete was positioned prone with their measured shoulder abducted at 90° and elbow held in 90° of flexion. One tester stabilized the scapula by placing a hand over the posterior aspect of the scapula while a second tester placed the force pad of the dynamometer on the volar aspect of the wrist for IR and the dorsal aspect of the wrist for ER. These techniques have shown excellent interrater reliability with ICC demonstrated between 0.93 and 0.99.17
To measure hip abduction strength, the athlete was positioned lying on their side with the leg to be measured on top, placed in a slightly extended and fully extended at the knee. The contralateral hip was positioned in 40° of flexion with 90° flexion at the knee. One tester stabilized the pelvis with hands placed at the lumbar and anterior iliac while a second tester positioned the dynamometer force pad proximal to the lateral femoral condyle. The subject performed a maximal muscle contraction against the dynamometer force pad for five seconds to record a result. To measure hip extension strength, the athlete was positioned prone with their measured hip at 0° extension and knee held at 90° of flexion. One tester stabilized the pelvis at the lumbar spine while the second tester positioned the dynamometer force pad proximal to the popliteal fossa, and the subject performed a maximal muscle contraction against the force pad for five seconds. These methods, previously used by these authors and Zeppieri et al., has shown a good interrater reliability reported by Krause et al. who reported good interrater reliability for hip abduction strength (ICC = 0.86-0.92) and hip extension strength (ICC = 0.91-0.93) and good intrarater reliability for hip abduction strength (ICC = 0.81) and hip extension strength (ICC = 0.88).18,19
Data Analysis
Descriptive statistics were calculated for selected demographic variables. A paired, two-tailed t-test was used to calculate differences in shoulder and hip ROM and strength between preseason and postseason. Preseason to postseason changes were analyzed based on 127 individual player seasons where each athlete’s preseason data was matched to that same athlete’s postseason data. Paired, two-tailed t-test with equal variance was used to compare differences between dominant and non-dominant preseason shoulder and hip ROM and strength. Preseason averages for the pitcher group and player group were calculated using a weighted average method to account for certain athletes who completed more preseason measurements than others. For example, a weighted average value for an athlete participating for three seasons was calculated as follows:
Preseason 1+Preseason 2+Preseason 33 seasons
Unpaired two-tailed t-test assuming unequal variance was used to compare preseason pitchers to position players shoulder and hip ROM and strength. Preseason averages for pitcher and position player groups were calculated using the same weighted average method as described previously. Given the multiple t-tests performed comparing side-to-side data and pitchers to position players, a Bonferroni correction was performed to adjust the α value and minimize the likelihood of Type I error.
RESULTS
Sample Description
The number of total subjects, type of player, and player seasons are shown in Table 1 along with descriptive statistics of age, weight, height, side dominance.
Preseason to Postseason Change
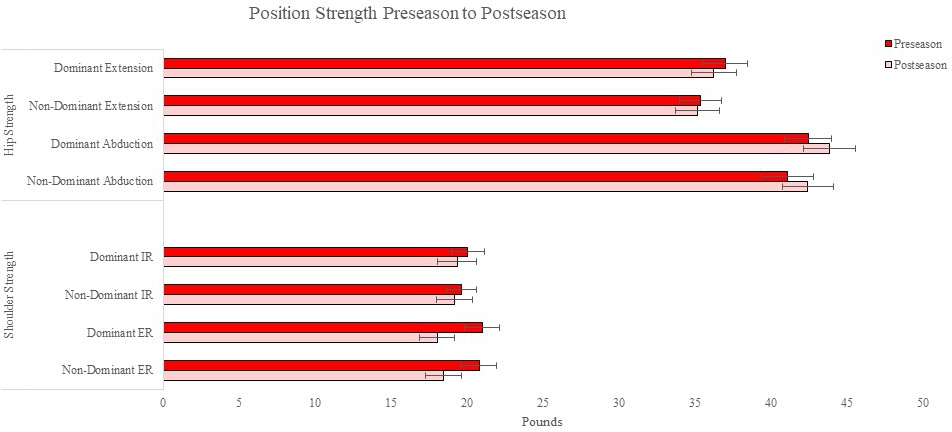
In position players, ROM for ER and TAM increased on dominant (D) and non-dominant (ND) sides (D ER change = +2.3°, p = 0.03; D TAM change = +4.0°, p = 0.009; ND ER change = +3.3°, p = 0.009; ND TAM change = +5.8°, p = 0.001). IR increased significantly in the non-dominant side (ND IR change = +2.6°, p = 0.013) but not the dominant throwing side (p = 0.086).
At the hip, ROM decreased significantly on both dominant and non-dominant sides (D ER change = -2.0°, p = 0.046; D IR change = -2.2°, p = 0.009; D TAM change = -4.2°, p < 0.001; ND ER change = -2.5°, p = 0.004; ND IR change = -3.2°, p < 0.001; ND TAM change = -5.7°, p < 0.001).
Decreased strength of ER at the shoulder was noted bilaterally (D ER change = -3.0 lb, p < 0.001; ND ER change = -2.3 lb, p < 0.001). The position player data from preseason to postseason comparison is summarized in Table 2, and a graphical representation is shown in Figures 1 and 2.


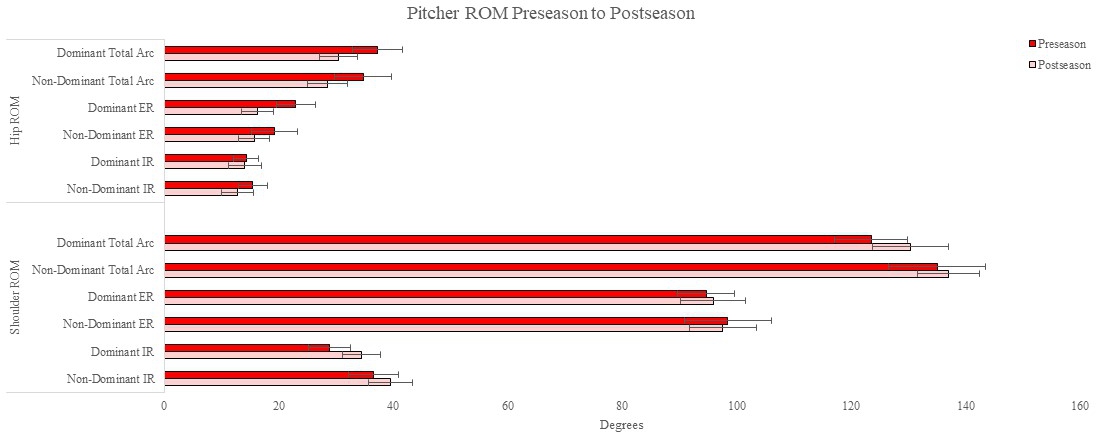
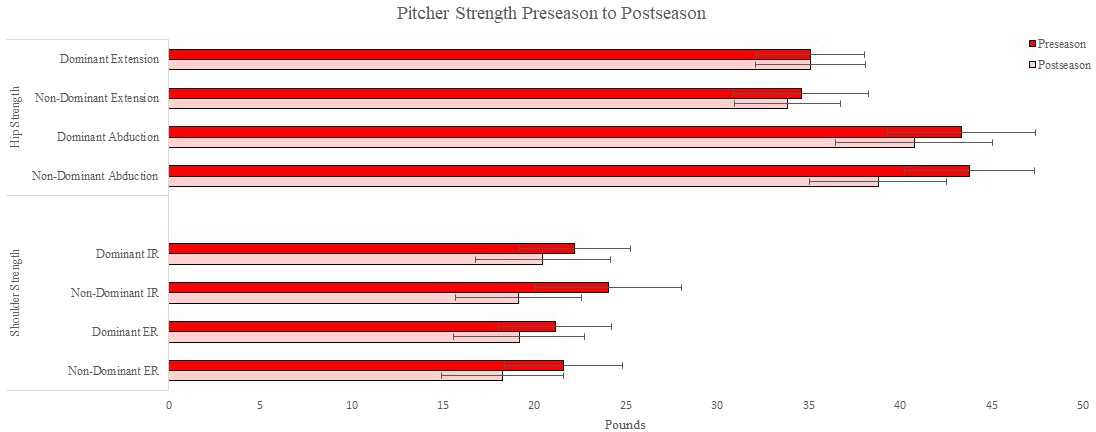
In pitchers at the shoulder, there was a significant increase in dominant side ROM for IR and TAM (D IR change = +5.6°, p = 0.002; D TAM change = +6.8°, p = 0.016). In the hip, there was a decrease in ER at the dominant side (D ER change = -6.7°, p = 0.001), and a significant decrease in TAM was noted in both sides (D TAM change = -6.9°, p = 0.004; ND TAM change = -6.2°, p = 0.006).
A decrease in both ER and IR strength was noted in the non-dominant shoulder (ND ER change = -3.3 lb, p < 0.001; ND IR change = -4.9 lb, p = 0.002) and a decrease in ER strength was seen in the dominant throwing shoulder (D ER change = -1.9 lb, p= 0.045). There was a decrease in strength of hip abduction in the non-dominant hip (ND Abd change = -5.0 lb, p = 0.001). The data for preseason to postseason change in pitchers is summarized in Table 2, and a graphical representation of the data is shown in Figures 3 and 4.


Side to Side Data
The comparison of dominant to non-dominant side in position players showed less IR in the dominant shoulder (IR mean difference = 5.3°, p < 0.001) but greater ER than the non-dominant side (ER mean difference = 4.5°, p = 0.029). Of note, the lesser IR in the dominant shoulder was the only difference which was significant after Bonferroni correction. The data comparing side to side measurements in position players are summarized in Table 3.
The comparison of dominant to non-dominant side in pitchers revealed no significant differences across all measurements of ROM and strength at the shoulder and hip (p > 0.05). The data from side-to-side comparison in pitchers are summarized in Table 3.
Position vs. Player
Comparing ER at the shoulder in the dominant throwing arm, position players had greater ER when compared to pitchers (Position Dominant ER = 101.8° ± 2.5; Pitcher Dominant ER = 92.4° ± 6.8; p = 0.013). Position players had greater TAM in the dominant throwing arm compared to pitchers (Position Dominant TAM = 133.4° ± 3.2; Pitcher Dominant TAM = 124.3° ± 6.3; p = 0.012). The ROM of IR did not demonstrate any significant difference. Lastly, pitchers demonstrated significantly greater hip abduction strength in their non-dominant side when compared to position players (Position Non-Dominant Abd = 39.8 ± 2.2 lb; Pitcher Non-Dominant Abd = 45.1 ± 4.4 lb; p = 0.032). The results comparing position players and pitchers are summarized below in Table 4. No comparisons between pitchers and position players reached significance following Bonferroni correction.
DISCUSSION
The purpose of this study was to identify changes in ROM and strength at the hip and shoulder in healthy collegiate softball athletes over a season and to describe side to side differences and differences between pitchers and position players across these metrics. In comparison to previous studies examining preseason passive total arc of motion in the dominant shoulder of softball athletes which range from 132.9°10 to 156.4°20 in position players and 140.5°10 to 153.2°21 in pitchers, this study found similar throwing side passive shoulder total arc of motion values in position players (133.4°) but lesser values for pitchers (124.2°). The results of this study help further characterize the mobility and strength of the hip and shoulder in the softball athlete, and this study has identified certain variables where significant change occurred over the course of a competitive season. Since this descriptive data represents the healthy, competitive athlete, it may be valuable for identifying athletes who demonstrate abnormal mobility or strength measurements and may be at risk for reduced performance potential or injury. Ultimately, understanding the physical profile of these elite athletes and how they change throughout a season will help inform training programs and injury risk assessment.
Analysis comparing preseason to postseason in position players showed significant increase in range of motion across all measurements in the shoulder except for internal rotation of the dominant throwing side shoulder. This finding is consistent with existing literature which shows that the repetitive stress in an externally rotated, overhead throwing motion throughout a season causes limited internal rotation due to increased laxity of the anterior glenohumeral joint capsule with tightening of the posterior capsule and adaptive humeral retroversion.4,11,21–24 Interestingly, there was still increased range of motion across all shoulder measurements in position players over the course of the season in this study. These results support the findings by Dwelly et al. which demonstrated bilateral increased external rotation and total arc of motion without significant increase in internal rotation in the throwing side when studying various overhead throwing athletes over a competitive season.11 The results from this study and the study performed by Dwelly et al. differ from some studies in baseball athletes which show reduced internal rotation and total arc of motion in the throwing shoulder after a competitive season.22,23 Therefore, the results from this study indicate that the activities of a competitive softball season lead to increased range of motion across both shoulder joints in position players, but the repeated stress of the overhead throwing motion performed by position players likely contributes to the relative limitation of internal rotation. This altered range of motion could potentially lead to altered biomechanics during the throwing motion and eventual impingement or labral pathology.4 Since the results of this study show that shoulder strength decreased symmetrically in both dominant and non-dominant shoulders, the loss of strength may be due to factors related to in-season strength and conditioning rather than the repetitive, asymmetric throwing motion.
In pitchers, a significant increase in total arc of motion occurred from preseason to postseason in the dominant throwing shoulder, mostly due to the significant increase of internal rotation. This change indicates that the limited preseason throwing side range of motion is susceptible to change in response to the physical stress of pitching throughout a season. The increased ROM maybe due to a combination of tightened muscles of shoulder adduction and internal rotation based on healthy pitching mechanics described by Oliver et al.,25 and also loosening of external rotator muscles in the throwing side shoulder. The significant decrease of external rotational strength in the dominant throwing side with preserved internal rotation strength seen in our study further supports this theory. Based on these results, pitchers seem to improve their relative glenohumeral internal rotational deficit during a competitive season. Since this deficit has been demonstrated to confer risk of shoulder injury in baseball players,3 an internal rotation stretching program which has been shown to improve internal rotational deficits in baseball players26 may be more beneficial to implement in the offseason. However, further study needs to be done to identify specific risk factors for upper extremity injury in softball pitchers.
In position players, range of motion in the hip is globally reduced bilaterally over the course of a playing season. Pitchers show reduced dominant side external rotation and bilaterally decreased total arc of motion. Since studies of baseball athletes demonstrate association between decreased range of motion at the hip and injuries to the hip, groin and lower extremity,6 implementation of stretching programs during the competitive season may be a reasonable strategy to mitigate this increased risk of injury, especially in position players who experienced globally reduced range of motion in the lower extremity in this study.
Pitchers also show decreased hip abduction strength in the non-throwing side after a season (Pre = 43.8 ± 3.5 lb; Post = 38.8 ± 3.7 lb; p = 0.001). However, hip extension strength is well preserved from preseason to postseason. This change in hip abduction strength may be due to the demand of non-throwing side hip abduction strength in the windmill pitching motion. In a study examining the changes in hip ROM and strength before and after a game, Oliver et al. showed that pitchers had significantly reduced strength measures in their non-dominant hip.27 Further analysis of muscle activation during various phases of the pitching motion has shown that gluteus medius engagement is maximized during the planting phase, which is believed to be an important phase for stability and energy transfer from the hip to the upper extremity.28,29 Therefore, it may be reasonable to consider implementation of specific hip abductor strength and conditioning strategies to maintain better strength throughout the season and maximize performance in pitchers.
From preseason data analyzing side-to-side differences, position players demonstrated greater external rotation ROM with lesser internal rotation ROM in their dominant throwing arm compared to their non-dominant arm. The significance of the internal rotation difference was more prominent since it was upheld after Bonferroni correction while the external rotation difference was not. However, the total arc of motion in both dominant and non-dominant shoulders was similar, which is consistent with literature on baseball players.30,31 Since the side-to-side difference in internal rotation remained relatively small (<6°) and the total arc of motion was similar between throwing and non-throwing sides, these results did not show any significant glenohumeral internal rotation deficit. As opposed to baseball literature which shows that the most significant predictor for injury was a lack of relatively greater external rotation (<5°) in the throwing shoulder compared to non-throwing shoulder,32 this study shows a preseason average difference of only 4.5° and only 3.4° in postseason data. Since these are healthy softball athletes without injury, the data from this study indicates that the side-to-side ROM discrepancies at the shoulder joint of softball position players may be less significant than those seen in baseball pitchers. This distinction may be due to differences in throwing speed, biomechanical differences between male and female athletes, and workload differences between the sports. Further study comparing healthy softball position players to those with injuries is needed to determine if the same injury risk factors seen in baseball pitchers are applicable to softball athletes.
In the comparison between pitchers and position players, external rotation and total arc of motion at the shoulder appeared significantly greater in position players (analysis with a standard t-test), which is consistent with previous studies on overhead athletes and softball athletes9,21,30,33–35; however, this difference was not significant after applying a Bonferroni correction which was needed due to multiple comparisons. In this study, it seems that the total arc of motion difference between pitchers and position players was mostly explained by the greater external rotation in position players, but pitchers also seemed to show relatively reduced internal rotation in their dominant throwing shoulder. It is possible that this reduced range of motion represents physical adaptation in response to the unique stress of the windmill pitch. These results are similar to those found in a study of windmill pitchers performed by West et al., but West did not find a statistically significant side-to-side difference in mobility of the throwing shoulder. The comparison to position players in our study helps show that there may be a subtle reduction in mobility of the throwing shoulder in pitchers due to the dynamics of the windmill pitch.35 Since pitchers with upper extremity pain were shown to have greater shoulder abduction and distraction during foot contact and ball release when compared to pitchers without pain in a study by Oliver et al., greater muscular tension leading to reduced mobility in the throwing shoulder is most likely a positive adaptation for injury prevention seen in healthy pitchers in this study.25,34
When compared to position players, pitchers showed significantly greater hip abduction strength in the non-throwing side; however, this difference was not significant after Bonferroni correction. Based on the symmetric strength in pitchers, this small difference is mostly due to a slight side-to-side disparity in position players who are weaker on the non-throwing side. This is likely due to the difference in throwing mechanics between the windmill softball pitch and the overhead throwing motion. Studies analyzing the softball pitching motion describe the importance of hip abduction strength in both throwing and non-throwing hips as it relates to maximum force delivery to the upper extremity12,35; therefore, pitchers may benefit from training designed to increase hip abduction strength.
Limitations
While several statistically significant findings were identified through this study, there are a few limitations. The position players were not separated by the specific position they play. Athletes were also not stratified by differences in their in-season workload. This cohort of subjects was not large enough to generate enough statistical power to divide the subjects into position specific groups. However, all position players share a similar overhead throwing technique. Therefore, data gathered from this group may apply broadly to healthy softball athletes who repeatedly use an overhead throw. Additionally, the group of pitchers (n) was significantly smaller than the position players, so statistically significant differences were more difficult to demonstrate in this group. However, this sample size was still adequate to demonstrate changes in certain metrics over a season. Also, the use of player seasons for the preseason to postseason analysis allowed for certain subjects to be accounted for more than others. Therefore, changes observed in this analysis may be skewed by athletes who participated in the study through multiple seasons. Ultimately, these subjects represent the more healthy, durable athletes since they remained injury free for multiple seasons, so their influence is valuable for defining the healthy softball athlete.
In the measurement procedures, only one repetition was performed for each ROM or strength measurements. This prevented the inclusion of measurement error in the data analysis. Additionally, the technique for strength measurement using the microFET 2 dynamometer was not performed against a solid structure, therefore the measurements may have been limited by the strength of the tester. Also, these measurements were not taken at a specific time point with respect to competition and workouts since this was logistically difficult to replicate each year of the study. However, they were consistently taken under similar conditions at a date soon before preseason workouts began without warm-up.
Future Research
Since this study was performed strictly in healthy subjects, future study including athletes with reported injuries during the season would help identify associations between injury and mobility and strength at the shoulder and hip. Also, study of in-season workload statistics like pitch count and workouts may help identify which specific activities are associated with the observed changes, and the effect of specific stretching and strengthening programs to mitigate the seasonal loss of strength or mobility may be studied. To better characterize the permanence of changes that take place over the course of a season, further study should be conducted to analyze the trend over the course of multiple seasons.
CONCLUSIONS
Softball pitchers and position players have unique mobility and strength profiles at the hip and shoulder. These profiles also demonstrate predictable changes over the course of a competitive season, and those changes are characterized generally by increased ROM at the shoulder, decreased ROM at the hip, and different patterns of decreased strength between groups. Position players showed similar changes to those observed in baseball players at the shoulder, but to a lesser extent in ROM change and side-to-side disparity. Pitchers showed preseason limited mobility in the shoulder which improved over the course of the season while losing hip abduction strength in the non-dominant hip. Ultimately, these observations taken in healthy, injury-free athletes may inform future position-specific training, stretching, and injury prevention programs in softball athletes.
Disclosures
This study was approved by the University of Florida Health Science Center Institutional Review Board (IRB-01).
Conflicts of Interest
None