INTRODUCTION
Collegiate runners participating in cross-country (XC) often suffer from overuse injuries, such as patellofemoral pain syndrome,1,2 Achilles tendinopathy,2,3 medial tibial stress syndrome,2,4,5 and stress fractures.1,2,5–8 They are collectively known as running overuse injuries (ROIs). Hayes et al8 reported that 53% of NCAA Division I and III runners suffered a new ROI across one XC season. Such a high prevalence of injuries can be detrimental to runners and their teams. Thus, there is a need to better understand underlying risk factors.
Many risk factors are suggested to contribute to ROIs,2,7–10 including age,9 sex,9,11 and previous injury history.7–9 However, these factors are all nonmodifiable. In contrast, modifiable factors like training load8,9 and biomechanical inefficiencies2,10 have generated the interest of clinicians and researchers. Biomechanical measurements of muscle strength,2,12 flexibility,12–14 and balance12,15,16 are routinely used by clinicians to quantify injury risk through a process known as injury screening.
Injury screening theoretically allows clinicians, coaches, and runners to identify and correct biomechanical inefficiencies, thereby reducing the likelihood of sustaining ROIs.17 The most practical injury screens are inexpensive, time efficient, and valid in predicting injuries. Several measures have been proposed to help predict the risk of developing injuries.2,16,18–21 Of these, the lower quarter Y-Balance Test (YBT) and Star Excursion Balance Test (SEBT) are similar measures of dynamic balance that have been extensively studied in athletes.15,16,20,22–28 Ruffe et al15 found that the YBT predicted ROI occurrence in male high school XC runners. Additionally, Smith et al16 found that the YBT predicted noncontact injury occurrence among NCAA Division I student-athletes. However, XC and track & field athletes accounted for only 22% of all participants. Thus, clinicians have worked with an incomplete pool of data to develop specific, evidence-informed injury screens for collegiate runners.
The purpose of this study was to investigate whether a preseason clinical assessment of dynamic balance, through a modified version of the YBT (mYBT), can predict risk of ROIs during one NCAA Division I XC season.
METHODS
Design
The study utilized a prospective case-control design, approved by the University of South Dakota Institutional Review Board. All participants completed an informed consent form prior to participation. All rights of participants were protected.
Subjects
Male and female student-athletes on the Division I XC team at a Midwestern University were recruited to participate in this study between August to November 2018. Exclusion criteria included: (a) having an injury within the prior six months that prevented the participant from running, (b) pregnancy, (c) under 18 years old, (d) non-English speaking, and (e) having a known balance impairment (e.g. unresolved head injury, vertigo, recent head cold, etc.).
Instrument
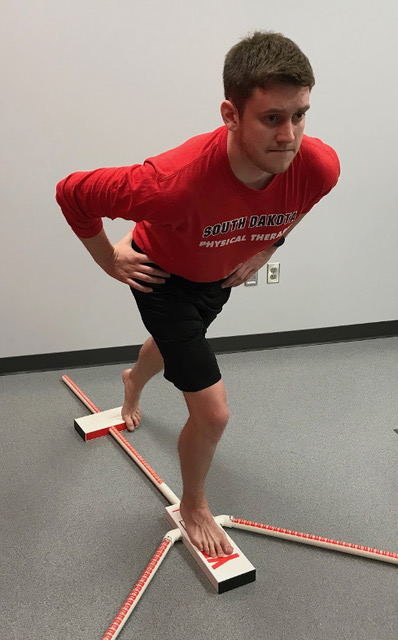
A modified version of the lower quarter Y-Balance Test (mYBT) was tested using the YBT Kit (Functional Movement Systems, VA, USA). During the original test, the participant maintains balance on one leg (tested leg), while reaching their opposite leg as far as they can in three directions: anterior (AN), posteromedial (PM), and posterolateral (PL). In this study, a fourth reach direction, posterior (PO), was added and termed the modified version of the YBT (Figure 1). The original lower quarter YBT has moderate to very high intra-rater reliability (ICC=0.68-0.94) and high to very high inter-rater reliability (ICC=0.73-1.00).29,30 The AN, PM, and PL reach directions have minimal detectable changes (MDC) of 5.87%, 7.84%, and 7.55%, respectively.29

Procedures
Demographic information was collected via questionnaire. Participants performed a five-minute, moderate intensity warm-up on a stationary bicycle, then partook in two clusters of preseason testing. The first test cluster included static balance, isometric hip strength, and isometric ankle strength. Data for the first test cluster were part of a larger study but were not analyzed in this report. Therefore, further details of the first cluster have been omitted. The second test cluster included three stations: (a) mYBT-AN and PO, (b) mYBT-PM and PL, and (c) leg length measurement. For both clusters, participants were randomly allocated to the first station, then proceeded through the subsequent stations in stepwise fashion.
During mYBT testing, participants were instructed to place their tested foot on the center platform with hands on their hips, then use their contralateral toes to slide the reach platform as far as possible, then return to starting position while maintaining balance throughout the entire motion. Errors, such as lifting hands away from hips, placing too much pressure or bearing weight on the reach leg, excessively pushing the reach platform, and lifting the heel of the stance foot, were not scored. Participants were given two practice trials followed by three scored trials in each reach direction. Right and left legs were tested in random order.
Scores (Table 1) were categorized by limb dominance: dominant (DO) and nondominant (ND), defined by the questionnaire as “which leg do you use to kick a soccer ball?” For each leg, the average of three scored trials in each direction was calculated to obtain a raw reach score (R). These were further normalized to leg length to create normalized scores (N). A traditional YBT composite score (CS) was calculated for analysis using the equation {normalized [AN + PM + PL]}. Raw difference (RD) was calculated using the equation {ABS[raw DO – ND]}. Percent limb asymmetry (%LA) was calculated using the equation {[ABS (normalized DO – ND)] / [MAX (normalized DO, ND)]}.
Injury Surveillance
After preseason testing, participants engaged in their usual routine with the XC team. ROIs were logged by the athletic training staff, who were blinded to participant test scores, using weekly injury reports over the entire XC season. Injury reports included the injury diagnosis and participation status of each injured runner. Participation status was categorized into four groups, in order from least to most severe restriction: “full go,” “as tolerated,” “modified/limited,” and “out.” In essence, this weekly categorization corresponded to minimal, mild, moderate, and severe injuries, respectively. In order to be classified under “ROI” for this study, the participant must have been listed as: (a) “as tolerated” for two or more consecutive weeks, or (b) “modified/limited” or “out” for one or more weeks.
Data Analysis
IBM SPSS Statistics 27.0 (IBM, NY, USA) was used to analyze data. Normality of descriptive statistics was tested using the Shapiro-Wilk test. A receiver operating characteristic (ROC) curve analysis was performed to determine the ability of mYBT scores to predict injury, which included raw and normalized scores for each reach direction, CS, RD, and %LA. Area under the curve (AUC) values were used to determine the effectiveness of each test using the following categories: 0.50-0.69 (negligible), 0.70-0.79 (acceptable), 0.80-0.89 (excellent), and 0.90-1.00 (outstanding).31 Statistical significance was set at α = 0.05. Optimal cut-off scores and relative risk (RR) with 95% confidence intervals (CI) were calculated for relevant tests. A secondary analysis by sex was also conducted.
RESULTS
Data from twenty-nine of 31 XC runners (mean age = 19.66 ± 0.974; 66% female, 100% right-dominant) were analyzed. One runner was excluded due to leaving the team mid-season (unrelated to injury) and another was disqualified due to exerting excessively abnormal effort during testing. Nine (5 female, 4 male) of 29 runners sustained an ROI during the XC season. No significant differences in demographics were found between injured and uninjured runners (Table 2).
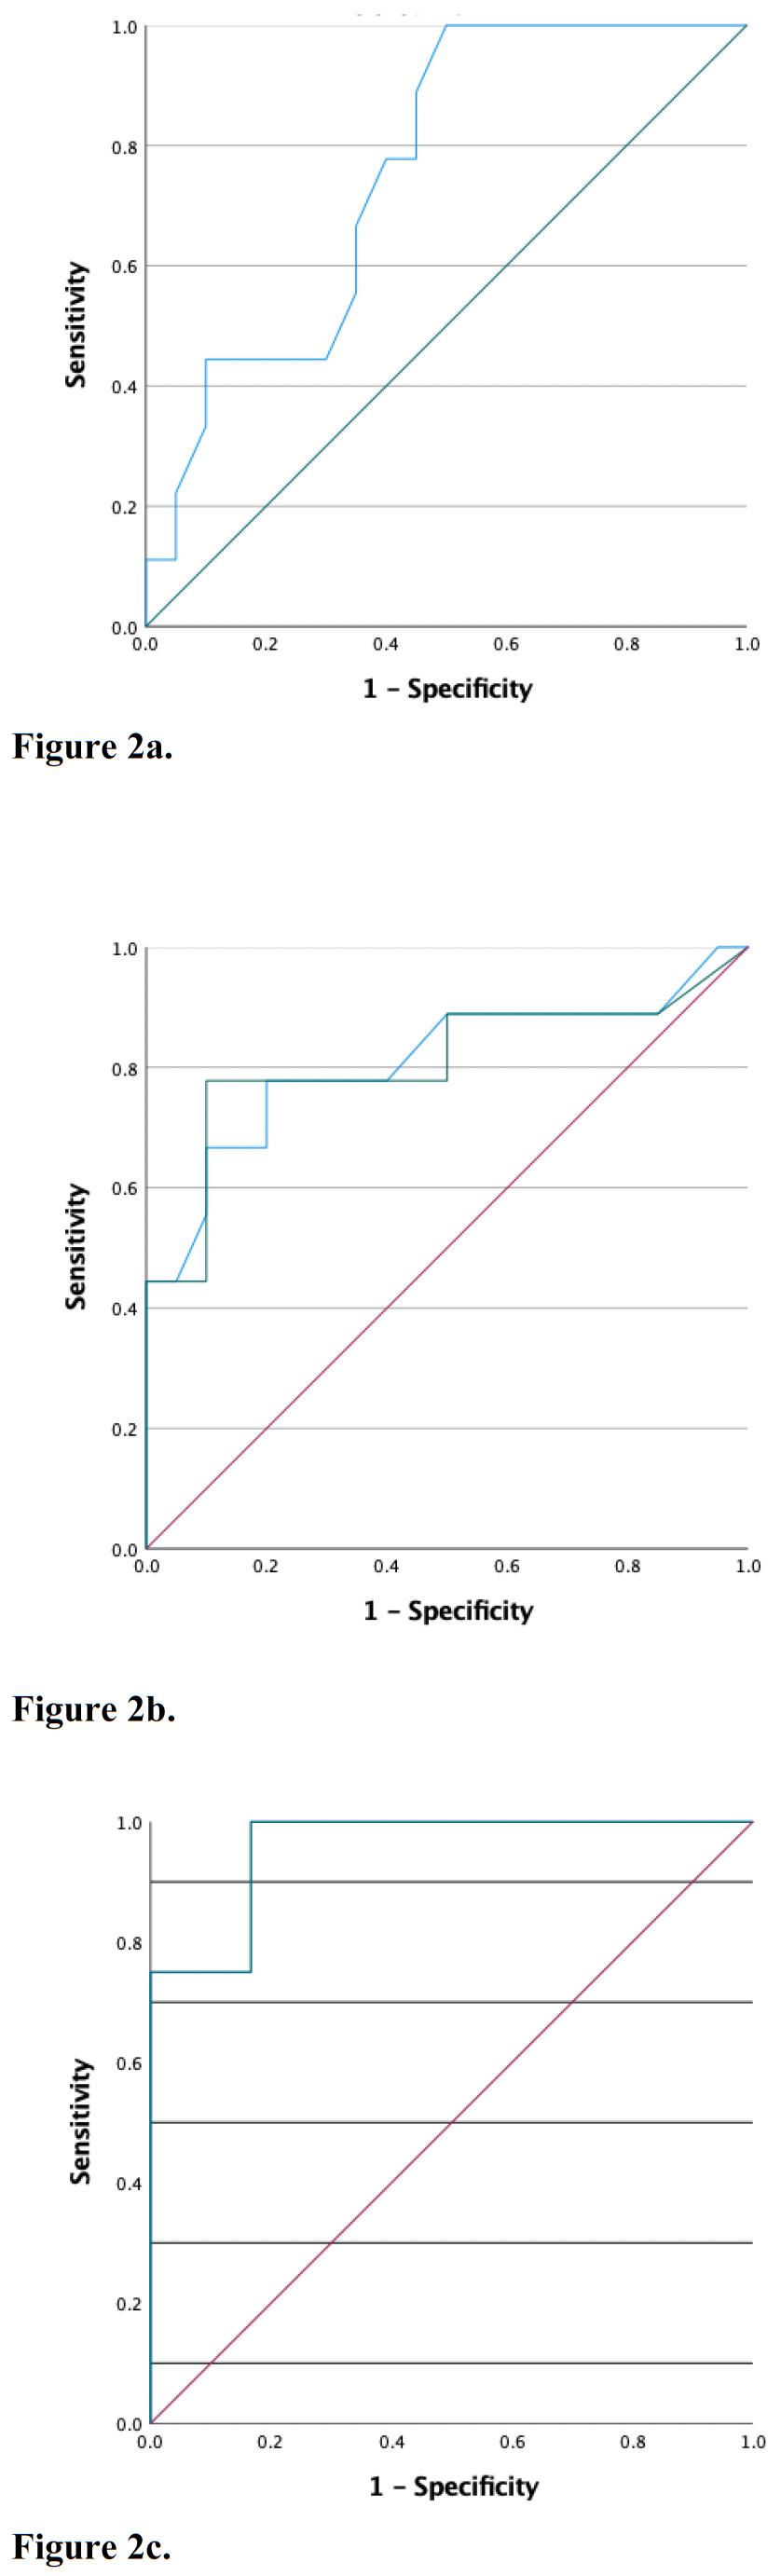
Mean (SD) normalized YBT scores are listed in Table 3. Five tests (Figure 2) demonstrated the ability to predict ROI during one XC season: normalized posterior reach score of the nondominant limb (p = 0.03), raw difference and percent limb asymmetry of anterior reach (p = 0.01), and raw difference and percent limb asymmetry of posteromedial reach (p = 0.02). AUC, optimal cut-off scores, and relative risk (RR) ratios for the three tests are listed in Table 4 and described below. Other tests, including raw scores, composite scores, and raw differences, did not predict injury.
_normalized__nondominant_posterior_reach_score.png)
Normalized Posterior Reach Score of the Nondominant Limb (N-ND-PO)
In all runners, N-ND-PO was an acceptable predictor of injury (AUC = 0.756, p = 0.03). Runners who scored below 0.935 were 1.90 times more likely to sustain an ROI compared to those who scored above 0.935.
Asymmetry of Anterior Reach
In all runners, RD-AN and %LA-AN were excellent predictors of injury (AUC = 0.808, p = 0.01). Runners who had greater than 2.5 cm raw difference or 5.4% limb asymmetry with a normalized anterior reach were 5.73 and 7.78 times more likely to sustain an ROI compared to those who had less than 2.5 cm or 5.4% limb asymmetry, respectively.
Asymmetry of Posteromedial Reach
In male runners, RD-PM and %LA-PM were outstanding predictors of injury (AUC = 0.958, p = 0.02). Male runners who had greater than 5.2 cm raw difference or 5.1% limb asymmetry with posteromedial reach were 5.00 times more likely to sustain an ROI compared to those who had less than 5.2 cm or 5.1% limb asymmetry.
DISCUSSION
The results of this study suggest that specific measures within the mYBT can predict injury risk over one XC season. They include asymmetries for anterior and posteromedial reach and normalized posterior reach score. However, traditional composite scores do not predict injury risk in collegiate runners.
Anterior reach asymmetry (%LA and RD) demonstrated the ability to predict injuries over one collegiate XC season. This finding reinforces conclusions made by other authors.15,16 Smith et al16 also identified AN asymmetry surpassing a 4 cm cutoff as an effective test among a mixed cohort of DI athletes. Yet Ruffe et al15 found that a predetermined 4 cm cutoff between limbs did not predict injury in high school XC runners. In the current study, the optimal cutoff was identified at a slightly lower value of 2.5 cm. This peculiar finding might be explained by leg length relativity. Runners (168-170 cm and 167 cm)15 were shorter than a mix of DI athletes (174-180 cm),16 which presumes that their legs were shorter. It is possible that the runners’ raw reach difference values were diminished by their shorter legs. Thus, the raw difference cutoff value may depend on leg length. Normalizing differences to leg length improved the test’s ability to detect meaningful asymmetries in runners, even though they were shorter. Therefore, AN asymmetry is a better predictor for runners when scores are normalized and compared to relative potential.
Posteromedial reach asymmetry (RD and %LA) also predicted injuries among collegiate male runners. Ruffe et al15 also reported that PM asymmetry ≥ 4 cm increased injury risk in high school male XC runners (AOR = 5.05, 95% CI: 1.3,19.8). It is noteworthy that two independent investigations only found this pattern among male runners. Hertel et al32 found that PM reach asymmetry in the SEBT was detected in people with chronic ankle instability, which suggests it has the ability to discriminate dysfunctional movement. Compared to AN reach, PM reach increases triplanar demands from the hip and core.33 Also, hip adductor muscles may be more stressed. Unfortunately, adductors have not been investigated in EMG studies. Compensatory biomechanics during the YBT, such as knee valgus and trunk lean, have also been suggested to better explain asymmetries (or lack thereof),15 but have not been well documented in research. Regardless of pathomechanical rationale to support these findings, this is the second clinical study to support the value of PM asymmetry in male runners.
Both raw reach difference and percent limb asymmetry were identified as predictors of injury for AN and PM reach. While RD values (2.5 cm and 5.2 cm, respectively) were different, %LA values (5.4% and 5.1%, respectively) were much more similar. The similarity of %LA values may afford clinicians convenience and consistency by applying a relative cutoff standard of 5% for both reach directions.
The original YBT does not include a reach in the posterior direction. The authors are unaware of any scientific studies that validate the distinction of only three reach directions used in the YBT, compared to eight directions originally included in the SEBT. This study is the first to validate the use of normalized PO reach in the mYBT for screening ROIs. Testing PO reach appears to be biomechanically sound, since runners mostly function in the sagittal plane with an emphasis on hip extensors.34 During the SEBT, a PO reach increases the biomechanical demands on the spinal extensors and gluteus maximus more than AN reach.33 Thus, PO reach may mimic running better than AN reach. Furthermore, testing PO reach does not require additional equipment or cost. The runner simply turns around to face away from the AN reach platform. Due to the potential for injury prediction and negligible cost, there is added value in testing normalized PO reach for collegiate runners.
Finally, composite scores have been inferred to predict injuries in some studies20,25 but not others.15,16,26–28 Plisky et al20 and Butler et al25 found that CS was predictive of injuries in basketball and football players, respectively. These sports involve rapid, triplanar movements. However, CS did not have the same predictive value when a variety of collegiate athletes were grouped together.16,26 Furthermore, CS did not predict injuries among high school runners15 and collegiate runners in the current study. Therefore, CS appears to have greater value in predicting risk in sports with triplanar demands. Since running is a sagittal plane sport, composite scores may not be catered toward a runner’s demands.
Limitations
A small sample size limits the generalizability of the results. The test performance and injuries were recorded on a group of collegiate runners who were probably more fit than average runners. They were also subjected to training programs that involved high training loads and rapid progressions. For the preseason testing protocol, runners tested static balance, ankle and hip strength for approximately 30 minutes prior to testing mYBT, so fatigue may have impacted their mYBT scores. Runners were only given two practice trials in order to offset fatigue and time constraints, though six practice trials have been recommended to stabilize performance.23 However, the actual impact of reducing practice trials within a comprehensive injury screen is unknown. Another limitation is that ROIs are subjective in nature, so injury reporting patterns may have been influenced by various uncontrollable factors over the course of the season. These reports may have affected the results, but such inherent risks were no different than a typical collegiate sports medicine setting.
Future studies should include multicenter trials with several collegiate XC programs in order to improve generalizability of mYBT results to any collegiate runner. A larger pool of runners could factor age, sex, injury history, experience level, previous training, and fitness within the injury analysis. Further biomechanical analysis, including hip adductor electromyography, should be performed in runners to help explain pathomechanics of this specific injury screen.
CONCLUSION
Specific components of the mYBT, including anterior reach asymmetry, posteromedial reach asymmetry, and normalized posterior reach score, are valid tests in predicting the risk of collegiate runners developing an ROI over one Division I XC season. Thus, the mYBT is a viable test to include within preseason injury screening for collegiate runners. Clinicians should consider a 5% limb asymmetry cutoff for AN and PM, in addition to a 0.935 normalized, nondominant limb cutoff score for PO, as ROI risk factors.
Disclaimers
The authors have no financial disclosures to report.
Acknowledgements
This study received helpful contributions from several individuals. Drs. Trevor Bollinger, Zackery Olson, and Carl Schumann assisted with data collection. Drs. Matt Dewald and Cassie Endsley assisted with editing. The authors also thank Coaches Lucky Huber, Dan Fitzsimmons, and the USD cross-country team for their moral support and participation.