INTRODUCTION
The etiology of injuries in sports is multifactorial including the dynamic interaction among biomechanical, psychological, behavioral, and training-related factors.1 Competitive swimmers are exposed to large training loads, swimming up to 14,000 m/day.2 Given that 90% of the propulsive force comes from the upper limbs,2 the shoulder is the most commonly injured body part.3 With a prevalence as high as 91%,4 shoulder pain is the main reason for missed training in competitive swimmers.3 Injuries in this population occur mainly from repetitive strain and microtrauma as a result of high training intensity or volume.5 A systematic review supported this, reporting moderate associations between training volume and shoulder pain in adolescent competitive swimmers.6 Considering the dynamic and multifactorial nature of sports injuries and the importance of training loads on the development of shoulder pain in swimmers, it is necessary to understand the interaction between training loads and other risk factors.
Stresses induced by training loads in swimmers have been shown to have a negative effect on shoulder physical qualities. Researchers have reported immediate decreases of shoulder external rotation (ER) range of movement (ROM),7–9 pectoralis minor length,7 and isometric rotation torque9 after a single swim session. Since these physical qualities have been reported as potential risk factors for shoulder pain in swimmers,10 their acute maladaptation can potentially increase the predisposition to shoulder injury. The intensity of the training session has been shown to be an important component of training loads leading to some of these changes.9 To date, there is evidence that a single swim-practice can lead to acute shoulder maladaptations,7–9 however, it is unknown whether these maladaptations are affected by the accumulation of multiple sessions. Also, training intensity is the only component of training loads that has been investigated;9 no studies have examined the effect of swim-training volume on physical qualities of the shoulder.
General wellness in swimmers is also affected by training loads. The peak swim-training volume during a season has been associated with mood11 and sleep disturbances.12 It has been also shown that acute increases in swim-training volume negatively affect muscular soreness, mood, perception of training loads, and psychological well-being.13–15 Importantly, impairments of wellness factors have been found in overtrained swimmers.16 Although wellness factors have not been directly associated with shoulder pain in swimmers, they have been reported as injury predictors in other sports.17–19 There is evidence of a dose-response relationship between training loads and wellness in swimmers;11–14 the peak swim-volume during a season and acute increases in swim-volume negatively affect wellness factors. However, it is unknown how they are affected by different swim-training volumes performed over the course of a week.
There is a lack of information about the interaction between training loads and risk factors for shoulder pain in swimmers. Importantly, no studies have simultaneously monitored shoulder physical qualities and self-reported wellness factors such as fatigue, muscular soreness, sleep quality, and stress in this population. Given the dynamic and multifactorial nature of injuries in sports and the role of training loads, it is important to understand how the accumulation of training loads affect factors associated to shoulder pain in swimmers and how different swim-training volumes influence these changes. This might help coaches and practitioners to discern which factors and when they need to be monitored. Monitoring can help to understand a swimmer’s response to training to adequately prescribe and manage training loads, minimizing the risk of injury and maximizing performance. The primary objective was to analyze the changes in shoulder physical qualities and wellness factors over a week of training in competitive swimmers. A secondary objective was to compare the changes in these variables between different swim-training volumes performed during the week.
MATERIALS AND METHODS
Experimental Approach to the Problem
A cross-sectional study was conducted to assess the impact of a week´s training loads on shoulder physical qualities and wellness factors and to determine the impact of different training volumes on these factors. For the first objective, participants were measured twice over a week: a baseline measurement at the beginning of the week (before Monday´s training session) and a follow-up during the week. For the second objective, participants were divided by convenience sampling into a high-volume group (HVG) and low-volume group (LVG) according to the day the follow-up measurement was performed. The HVG group was measured after Saturday´s training session. This implied that this group was tested after completing all the sessions of the week and thus performed the total weekly swim-volume. Conversely, the LVG was measured during the week (after the Thursday or Friday session). This indicated that, at the time of follow-up, this group had performed less than the total weekly swim-volume.
Participants
Thirty-four national and regional level swimmers from the same club were recruited to participate in the study. According to a priori power analysis (version 3.1.9.2; G*Power, Heinrich-Heine-Universität, Düsseldorf, Germany), using the t-tests for means (two independent groups), a sample size of 32 participants (16 per group) would be required to detect a large effect size (0.90) with a power of 0.80 and an α level of 0.05. Three participants were unable to complete the follow-up testing; one developed shoulder pain during the testing week, whereas two missed the session due to other reasons. Thirty-one participants were included in final analysis (18 females and 13 males; age = 15.5 ± 2.2 years, range 12-21 years). All swimmers trained year-round and completed a similar number of practices regularly, regardless of the age and level of competition. The participants performed an average training volume of 35,600 ± 4,000 meters per week and average swim sessions of 8.5 ± 0.5 per week. The exclusion criteria included a history of shoulder surgery, shoulder pain at the time of the study, and any pain in the two weeks before the study that interfered with the ability to train or compete fully.7 All participants provided written informed consent before data collection. For participants under 18 years of age, parental or guardian signed consent was obtained. This study was approved by our university’s ethics board and conducted in accordance with the Declaration of Helsinki (Ref.no.HSR1718-100).
Procedures
Baseline measurements included general demographic information, such as sex, age, limb dominance, height, mass, forearm length, and history of shoulder pain. Considering the high number of swimmers that do not discontinue training due to shoulder pain,20 history of shoulder pain was recorded as the presence of significant interfering pain that caused the swimmer to miss or modify training or competition within the previous 12 months. Before testing, participants performed a standardized warm-up consisting of shoulder movements (10 repetitions of ER and IR [0° shoulder abduction] with a yellow TheraBand [The Hygenic Corporation, Akron, OH]). After the warm-up, participants were asked about their readiness to train and completed a wellness questionnaire. Readiness to train was measured separately by asking “Do you feel ready to train at 100% this week?” on a seven-point Likert ranging from 1 (strongly agree) to 7 (strongly disagree). Wellness was obtained with the Hooper questionnaire which includes self-report ratings of muscular soreness, fatigue, sleep quality, and stress using a Likert scale ranging from 1 to 7.16 Then, active shoulder external rotation ROM and shoulder rotation isometric peak torque were measured, assessing the dominant side first. Three trials of each test were performed on both limbs, and the results were averaged for further analysis. For the follow-up session, participants were tested on different days according to the swim-volume group (low-volume or high-volume). Immediately after completion of the training, swimmers exited the pool and repeated baseline testing. Additionally, RPE of the whole week was recorded after the follow-up session.
Training Loads Monitoring
According to a consensus statement in training loads,21 a combination of external (amount of work performed by the athlete) and internal (athlete’s physical and psychological response to external loads) training loads should be used to monitor an athlete’s response to training. External training loads were measured by the swim-training volume performed during the testing week. For internal training loads monitoring, it has been recommended to include objective and subjective measures.22 Objective measures included shoulder physical qualities, whereas subjective measures included self-reported wellness factors and weekly RPE.
Swim Training Volume
Swim-training volume was defined as “the average distance or average time swum per week”.6 The swim-volume for each swimmer was reported by the coaches at the end of each week and was based on the distance covered at the time of the follow-up measurement. If a participant missed a training session, the volume of the missed session was deducted from the total weekly volume.
Physical Qualities
Regarding shoulder-rotation ROM, only ER was measured. The reason for this was because previous authors7–9 have found changes in ER ROM, but not in IR after a swim training. Shoulder ER ROM was measured using the ‘Goniometer Pro’ (5fuf5 Co, Bloomfield, NJ) digital inclinometer application for the iPhone (Apple, Inc, Cupertino, CA), which is valid compared to the universal goniometer.23 Participants were positioned in supine with 90° of shoulder abduction and instructed to actively rotate the limb back until reached end available range. A towel roll was placed under the humerus to ensure a correct alignment in the frontal plane.24 This was based on visual inspection, making sure that the humerus was levelled to the acromion process.24 The end range was determined by the available range without any stabilization.
Shoulder rotation isometric peak torque was assessed using a hand-held dynamometer (HHD) (Hoggan MicroFET2; Scientific LLC, Salt Lake City, UT), which has been shown to be reliable and valid compared to the gold standard isokinetic dynamometry.25 Participants were positioned in supine with 90° of shoulder abduction. Before testing, one submaximal trial was performed to ensure correct technique. The HHD was placed on the palmar surface of the forearm for internal rotation and on the dorsal aspect of the forearm for external rotation, proximal to the radioulnar joint crease. Then, participants were instructed to push against the HHD as hard as possible for three seconds, with a resting period of 10 seconds. Force was converted into torque (in newton meters) by multiplying the force (in newtons) by the lever arm length (meters). Torque was normalized to body mass (Nm/kg) and expressed as the percentage of change between the baseline and follow-up measurements. Lever arm length was measured from the olecranon process to the proximal aspect of the styloid process of the ulna.26 To assess muscle balance, the ratio between external and internal rotator torque was calculated (ER: IR ratio). Three trials of shoulder ER ROM and rotation peak torque were performed on both limbs, and the results were averaged for further analysis.
Intrarater test-retest reliability for active shoulder ER ROM and rotation isometric torque was established before in a pilot study. Three trials of each measurement were performed on two sessions separated by seven days. The intraclass correlation coefficient, standard error of measurement (SEM), and minimal detectable change (MDC) with 95% of confidence interval for each test were calculated. These results provided information to enable us to determine whether the changes in the shoulder physical qualities were real or due to measurement error (Table 1).
Self-Reported Wellbeing
Common valid instruments to assess athlete’s wellbeing status include The Stress-Recovery Questionnaire for Athletes, The Profile of Mood States, and The Multicomponent Training Distress Scale.22 Unfortunately, these questionnaires are long and time-consuming, which limits their implementation in the sport setting. Because of this, several authors have incorporated elements of these questionnaires into short, customized, and easy-to-use self-reported measures.16,17,19,27–31 Within these studies, a specific set of questions (Hooper questionnaire) have been used in several sports16,27,30,31 which includes self-report ratings of muscular soreness, fatigue, sleep quality, and stress using a Likert scale ranging from 1 to 7 for rating. Importantly, the Hooper questionnaire has been shown to provide an efficient method of monitoring both overtraining and recovery in swimmers16 and to have moderate to large relationship with acute load in other sports.30 Using this questionnaire, each swimmer recorded their current status of muscular soreness (1= free full movement, 2 = free movement, 3 = fairly free movement, 4 = neutral, 5 = fairly sore, 6 = sore, and 7 = very sore), fatigue (1= very fresh, 2 = fresh, 3 = fairly fresh, 4 = neutral, 5 = fairly tired, 6 = tired, and 7 = very tired), sleep quality (1= very restful, 2 = restful, 3 = fairly restful, 4 = neutral, 5 = fairly restless, 6 = restless, and 7 = very restless), and stress (1= very relaxed, 2 = relaxed, 3 = fairly relaxed, 4 = neutral, 5 = fairly stressed, 6 = stressed, and 7 = very stressed). The individual scores of each item were summed to provide a score of overall perceived wellness.
Weekly RPE
The perception of training loads was quantified by the RPE based on the modified version of the category-ratio scale of Borg.32 Immediately after completing the follow-up session, the swimmers were asked, “On average how hard was your training week?”, on a scale from 0 (rest) to 10 (maximal effort).32 Researchers have recommended that RPE should be monitored daily.32 However, as a result of the various training locations of each athlete, the daily measurement of the RPE was not possible. It has been shown that the RPE reported at the end of the week (weekly RPE) has a strong correlation with the RPE reported daily after 24 hours of training (0.87 [CI, 0.78 – 0.93]).33 Therefore, RPE of the whole week was recorded.
Statistical Analysis
For statistical analysis, SPSS (version 25 for Windows; Inc, Chicago, IL) was used. Demographic data was initially screened for between-group differences using independent sample t-tests for normally distributed data and Mann Whitney test for non-normally distributed data. As all outcome measures showed normal distribution, results are expressed as means and standard deviation (SD). Paired t-test was used to assess within-group differences between pre-and post-measurements and independent sample t tests were used to assess between-group differences. The Cohen d effect size (ES) was calculated to determine the magnitude of any difference among measurements: >0.8 (large), 0.5-0.79 (medium), 0.49-0.20 (small), and <0.2 (trivial).34 Differences were considered as significant when p values were ≤ 0.05. Additionally, a swim-volume threshold was calculated to determine the percentage of swimmers above or below a specific swim-volume in each group. In the LVG, two SD were added to the average value of the swim-volume obtained, whereas, in the HVG, two SD were subtracted from the average of the swim-volume. This is an operational value that will determine a swim-volume threshold where 95% of the participants in each group lie.
RESULTS
Table 2 presents the baseline characteristics of the participants. The HVG reported greater swim-volume (p < 0.001) and training hours (p < 0.001) at follow-up. The LVG averaged a volume of 26.2 ± 2.2 km, whereas the HVG averaged a volume of 37.5 ± 3.7 km. The swim-volume threshold was set at 30 km, identifying that 95% of swimmers in the HVG performed more than 30 km (37.5 - 2 SD [3.7]) and 95% of swimmers in the LVG performed less than 30 km (26.2 + 2 SD [2.2]) at follow-up.
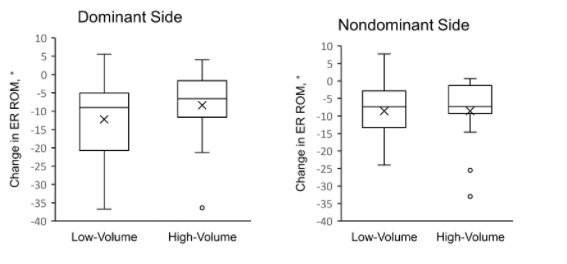
For shoulder ER ROM, the LVG demonstrated decreases with large ES for the dominant (p = 0.002; d = 1.22) and nondominant sides (p = 0.001; d = 0.82). The HVG demonstrated decreases with large ES for the dominant (p = 0.006; d = 0.99) and nondominant sides (p = 0.004; d = 1.25) (Table 3, Figure 1). In both groups, the average change on the dominant side exceeded the MDC, whereas it only exceeded the SEM on the nondominant side. There was no significant difference between groups. For isometric peak torque, there was no significant pre-post and between-group difference in external rotator, internal rotator, or ER: IR ratio (Table 3).
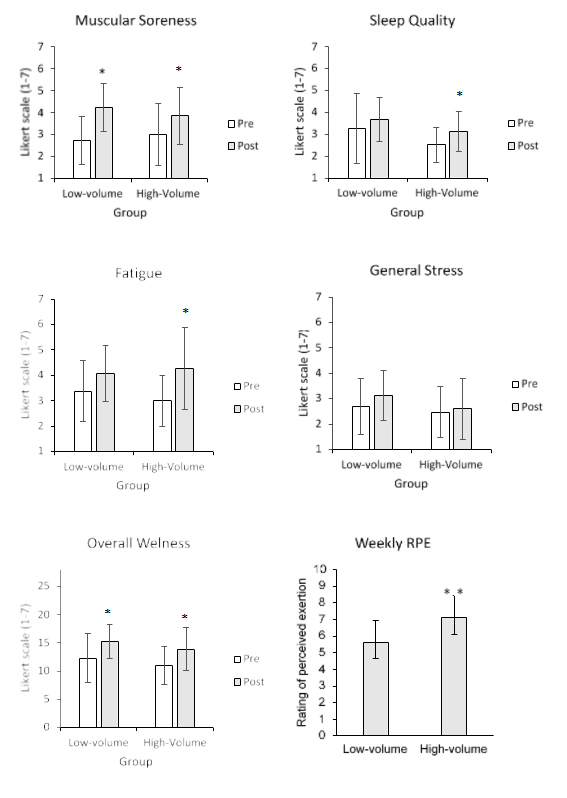
Regarding wellness factors (Table 4, Figure 2), self-reported muscular soreness increased (p = 0.001; d = 0.81) and overall wellness worsened with large ES (p = < 0.001; d = 1.33) in the LVG. There was no difference between testing sessions for sleep quality, fatigue, or stress. In the HVG, both muscular soreness (p = 0.007; d = 0.63) and poor sleep quality increased with moderate ES (p = 0.023; d = 0.69). Fatigue increased (p = 0.008; d = 0.96) and overall wellness worsened (p = 0.010; d = 0.80) with a large ES. No difference was reported in stress. There was no difference for muscular soreness, sleep quality, fatigue, stress, and overall score between groups.
Weekly RPE differed significantly between groups with large effect size (p = 0.004; d = 1.15) (Figure 2). The HVG reported higher weekly RPE scores (mean = 7.13 points, SD =1.3; range = 5-9) than the LVG (mean = 5.63 points, SD =1.3; range = 3-7).


DISCUSSION
The aims of this study were to analyze the changes in shoulder physical qualities and wellness factors over a week of training in competitive swimmers and compare the changes in these variables between different swim-training volumes performed. For the first objective, shoulder ER ROM and self-reported muscular soreness, sleep quality, fatigue, and overall wellness were negatively affected over a week’s training, but isometric peak torque and self-reported stress were not. Within-group analysis showed that both groups reported decreases in shoulder ER ROM and increases in self-reported muscular soreness; however, only the HVG reported impairments in fatigue and sleep quality at follow-up. For the second objective, the HVG reported higher weekly RPE scores compared to the LVG at follow-up. However, there were no significant differences in shoulder physical qualities and wellness factors between groups. Our results show that the accumulation of training loads over a week negatively affect physical and wellness factors in swimmers. Also, higher swim-volumes were mainly associated with an increased perception of training loads.
Weekly RPE
The weekly RPE was significantly higher in the HVG than the LVG with large ES (d = 1.15). The LVG perceived the training week as “hard” (RPE mean = 5.63 points), whereas the HVG perceived the training week as “really hard” (RPE mean = 7.13 points). This indicates that as the swim-training volume increases towards the end of the week, training loads are perceived as harder. O’ Connor et al.14 found increases in RPE values after an increase of training volume over three days in competitive swimmers. Interestingly, these changes were associated with increases in self-reported fatigue, muscular soreness, and mood.14 Although this study showed changes in most of the wellness and physical factors during the week, there were no significant differences between groups. This indicates that higher swim-volumes performed during the week (over 30 km) have no additional impact on these factors. These findings might suggest that these factors are more affected by the changes in swim-volume rather than the total volume performed.
Shoulder Physical Qualities
To the authors knowledge, this is the first study investigating cumulative effects of training loads on shoulder ER ROM and rotation isometric torque over a training week in swimmers. Both groups reported reductions in ER ROM with large ES. The LVG reported a mean decrease of 12.2° on the dominant and 8.6° on the nondominant side, while the HVG reported a mean decrease of 8.6° on the dominant and 8.4° on the nondominant side. However, the difference between groups was not significant. The results showed that ER ROM is negatively affected by the accumulation of training loads but higher swim-training volumes provide no additional impact. The large ES and values exceeding the MDC in the dominant side for both groups support the clinical meaningfulness of the observed ER ROM changes. Therefore, there is a 95% of confidence that the changes in ER ROM in the dominant side during a training week are attributed to the swim training and not due to measurement error. Although the ES for the nondominant side was large, the values of change only exceeded the SEM, which weakens its clinical significance.
Prior studies in swimmers have only investigated the impact of a single training session on shoulder ER ROM.7,8 Matthews et al.8 found decreases of 5.29° on the dominant side and 3.18° on the nondominant side after a fatigue protocol consisting of eight sets of 100m swim in national level swimmers. Higson et al.7 reported decreases in ER ROM of 3.4° after a two-hour training session in elite swimmers. More recently, Yoma et al.9 found decreases in ER ROM of 7.8° on the dominant side and 6.5° on the nondominant side after a high-intensity session of 3.0 km in regional and national level swimmers. The greater changes found in this study may be explained by the cumulative effects of swim-volume over multiple training sessions. In our study, all participants performed between seven and nine sessions and completed a total swim-volume over 25 km, which is a significantly higher volume than in the studies of Mathews et al.8 (800 m) and Yoma et al.9 (3.0 km). Probably, the acute reductions of ER ROM after a single session are not completely recovered before the following training, which might explain the greater changes found in this study. Deficits in shoulder ER ROM is a risk factor for shoulder pain in competitive swimmers,35 therefore, the regular monitoring of shoulder ER ROM might be important to reduce the susceptibility of shoulder injuries due to the accumulation of training loads. Limitations of ER ROM might be important, as this movement is necessary during the mid-recovery phase when the arm is abducted at 90°.2 Hypothetically, limited ER ROM may increase the probability of mechanical shoulder impingement during the recovery phase.35
Contrary to what was expected, the accumulation of training loads over the week did not affect shoulder IR or ER peak torque in any group. In a recent study, investigators9 found that shoulder rotation isometric peak torque was immediately reduced after a high-intensity session but not after a low-intensity session in competitive swimmers. As part of the regular week, swimmers usually perform a combination of high and low-intensity sessions. The absence of changes in this study might be explained by the possible recovery of force between sessions. Another explanation is that only the maximal peak force was assessed, which may not reflect the demands of swimming. Swimming is an endurance sport that does not reach peak levels of force; thus, it is possible that testing as a proxy measure of muscle endurance rather than maximal force could have given different results.36–38 Considering this and the previous studies´ results,9 it can be suggested that changes in rotation force are possibly more affected by the intensity of a single session than the accumulation of swim-volume. Despite this, regular monitoring of shoulder rotation strength in swimmers might be important in clinical practice.
Wellness Factors
All wellness factors were affected by training performed during the week, except for general stress. Self-reported muscular soreness was increased in both groups with moderate to large ES. Various authors have reported increases in self-reported muscular soreness after acute increases of swim-volume during three14 and ten days13 of training. Furthermore, Hooper et al.16 found increases in muscular soreness during the peak volume period of a season in competitive swimmers. Although this study did not assess the impact of acute increases of swim-volume or the effects of a specific period of the season, it was found that the accumulation of training loads over a regular training week also increases the perception of muscular soreness. However, the different swim-volumes performed did not influence the perception of muscular soreness. Laux et al.18 found an association between the feeling of stiff muscles and feeling vulnerable to injuries in professional football players. The stress-injury model39 proposes that generalized muscle tension is an important mediating factor between psychological stress and injury; an elevated stress response increases muscle tension narrowing the visual field and increasing distractibility and consequently the risk of injury.
Perceived fatigue and sleep quality were significantly affected in the HVG (moderate to large ES), but not in the LVG. These results might be explained because the HVG was tested at the end of the week, which implies a greater swim-volume and training sessions than the LVG. However, the non-significant difference between groups for fatigue (p = 0.27) and sleep quality (p = 0.70) weaken this relationship. Fatigue and sleep disorders have been found in overtrained swimmers; during the peak swim-volume period of the season, self-reported impairments in sleep and fatigue predicted overtraining before the deterioration in performance became evident several weeks later.16 Furthermore, both have been reported as injury predictors in team sports.18 The results showed that the changes in both variables might be sensitive to higher swim-training volumes performed over the week. The increases in stress (fatigue) and simultaneous decreases in recovery (sleep) might increase the susceptibility to injury and overtraining. However, as a result of the non-significant differences between groups, swim-volume might weaken its contribution to these changes.
Overall wellness score (sum of the individual item scores of the Hooper questionnaire) was affected in both groups with large ES. Hooper et al.16 found that the overall score of this questionnaire accounted for 49%, 78%, and 76% of the variance to predict overtraining in swimmers in early, late and midseason respectively. Training loads can impose stress on the athlete, shifting their physical and psychological wellness along a continuum that progresses from acute fatigue to functional overreaching, non-functional overreaching, and ultimately overtraining syndrome.40 Therefore, these results support the importance of regularly monitoring these factors of potential overtraining in competitive swimmers. Finally, general stress was not affected over the week in any group. Likewise, a study in rowers41 found that a six-day heavy training camp negatively affected perceived fatigue and sleep quality but not the levels of general stress. This might be explained as increases in stress values related to training volume need longer periods to be affected.41
Finally, it is important to consider the variability of the responses among swimmers. Although most swimmers decreased their shoulder physical qualities and wellness factors at follow-up, the responses were varied (Figures 1 and 2). Therefore, these finding further support the individual monitoring and management of training loads in competitive swimmers.
Limitations
This study presents several limitations. First, athletes usually experienced stress from sources other than training loads, such as academic, social, lifestyle, and athlete coach-relationship. Some of these factors could have also influenced the changes found in physical and wellness factors. Second, the monitoring period was short (one week) and does not reflect the long-term adaptations of the swimmers to training loads. Third, participants were assigned to each group by convenience and availability. Although this could have affected the baseline symmetry between groups due to confounding factors, the baseline characteristics were similar between groups. Fourth, the intensity and volume of the follow-up session could have influenced how swimmers recalled the single weekly report of RPE (e.g., a hard follow-up session could have led to a greater weekly RPE value). Despite this, the participants consistently reported higher weekly RPE values at the end of the week than during the week, weaken this assumption. Fifth, the age range of the participants (12-21 years) may have affected the results as maturational age can influence the response to training.42 Although the age frequency and average were similar between groups, it is not possible to determine biological maturation based on chronological age.42 Thus, how many swimmers in each group had reached or not reached biological maturation is unknown. Despite this, the age range of the participants can be also a strength as it represents the most common age in swimming squads (adolescents and young adults). Lastly, only the average of the results was calculated, which does not represent the individual responses to training encountered by each swimmer. Future research performing repeated measurements should investigate prospectively the individual changes in physical and wellness factors and examine how they are related to the development of shoulder pain in swimmers. Furthermore, it would be important to understand how long these factors take to recover after the stress induced by training loads.
CONCLUSIONS
The accumulation of training loads over a week negatively affected shoulder ER ROM and wellness factors (self-reported muscular soreness, fatigue, and sleep quality) in swimmers. Considering that shoulder ER ROM is a potential risk factor for shoulder pain and wellness factors have been associated with overtraining in swimmers, their regular monitoring might be necessary. This can potentially help to identify swimmers at greater risk of shoulder injury and overtraining. Regarding swim-volume, only the perception of training loads was different between groups. This shows that, although performing higher swim-volumes was perceived as harder, this did not reflect significant differences in general wellness and shoulder physical qualities between groups. The regular monitoring of subjective wellness along with objective physical qualities to assess swimmers’ response to the accumulation of training loads might be necessary.
Conflicts of interest
None