


INTRODUCTION
Excessive frontal plane motion of the trunk and/or pelvis has been implicated in numerous clinical conditions.1–4 With respect to anterior cruciate ligament (ACL) injury, increased lateral trunk motion (with increased medial knee collapse) during landing2 and increased pelvis hike (i.e., frontal plane pelvis rise of the non-stance limb) during a standing knee lift have been shown to predict ACL injury (or non-contact knee injury of any type).3 Regarding low back pain, increased contralateral pelvis drop (i.e., frontal plane pelvis drop of the non-stance limb) and/or hip adduction during single-leg landing has been shown to predict the occurrence of symptoms in youth floorball and basketball players.1 Based on cross-sectional studies, greater degrees of contralateral pelvis drop and/or ipsilateral trunk lean during weight-bearing activities have been reported in persons with patellofemoral pain (PFP)5,6 and groin pain4 compared to healthy persons. Furthermore, diminished pelvis and trunk control can contribute to increased knee valgus moments during landing,7 a known risk factor for the development of PFP8 and ACL injury.9
Due to the importance of frontal plane trunk and pelvis kinematics in contributing to various musculoskeletal conditions, two-dimensional (2D) video analysis has been proposed as a clinical method to identify abnormal trunk and/or pelvis motion during dynamic tasks. To date, four studies have attempted to validate angular measures of frontal plane pelvis and/or trunk motion obtained with 2D video compared with three-dimensional (3D) motion with varied results.10–13 Although 2D measures of pelvic drop have been shown to correlate with 3D measures during running,13 this finding has not been consistent across studies.12 Similarly, studies that have examined the validity of 2D measures of frontal plane trunk motion have reported inconsistent findings.10,11 While measures of 2D trunk motion have been shown to be correlated with 3D measures during a single limb hop,11 this finding has not been replicated across tasks such as the single limb squat10,11 and drop jump.11
Apart from the diversity in the tasks analyzed, comparison of results across studies is difficult owing to the various methods employed for defining the trunk and pelvis segments and differences in the kinematic variables analyzed (i.e., displacement vs. position at specific time points). In addition, previous studies in this area have not evaluated the validity of 2D measures of pelvis and trunk motion during tasks that involve a change in direction. This is important as high demand change of direction tasks, such as cutting and deceleration, have been implicated in ACL injury14,15 and have been reported to be influenced by insufficient control at the pelvis and trunk.2,3,16
To date, it is unclear whether 2D video is an appropriate surrogate for assessing frontal plane trunk and pelvis motion as a comprehensive validity study across a wide range of movements using a consistent methodology has not been performed. As such, the purpose of the current study was to assess the concurrent validity and agreement of 2D pelvis and trunk motion in the frontal plane against the respective 3D angles during stepping, landing, and change in direction tasks. Information gained from this study will aid in the development and/or improvement of clinical movement analysis to identify movement impairments associated with lower-extremity injury.
METHODS
Participants
Thirty-nine healthy athletes between the ages of 13 and 40 years partook in this study (15 males and 24 females; Table 1). Potential participants were recruited using email invitations to local sport teams and schools. All were currently partaking in a sport with high levels of jumping, cutting, or lateral movements (such as soccer, basketball, volleyball, lacrosse, football, netball, or tennis). Individuals were excluded if they had current lower-extremity pain, any history of ACL reconstruction, lower-extremity injuries/surgeries in the prior six months, or indicated any medical condition that would impair their ability to perform the athletic tasks.
Instrumentation
Three‐dimensional and 2D kinematic data were collected at 120 Hz using a video-based 8-camera motion analysis system (Simi Reality Motion Systems GmbH, Unterschleissheim, Germany). One of the eight cameras was positioned 80 cm off the ground (perpendicular to the force plate) and was used to collect the required frontal plane images for the 2D analysis.
Procedures
Prior to data collection, participants were informed about the nature of the study and written consent was obtained as approved by the Institutional Review Board of the Health Sciences Campus at the University of Southern California. Parental consent was obtained from participants younger than 18 years. Once informed consent was obtained, participants warmed up on a stationary bike for 5-10 minutes.
Participants were instrumented with 21 reflective markers (10 mm diameter) on the right lower extremity. Semi-rigid plastic plates with mounted markers were used for the thigh, tibia, and heel clusters. In addition, markers were placed on the following bony landmarks: distal aspect of the 2nd toe, 1st and 5th metatarsal heads, medial and lateral malleoli, medial and lateral femoral epicondyles, bilateral greater trochanters (most prominent point), bilateral iliac crests (most superior aspect), and bilateral anterior superior iliac spines. For the torso, markers were placed on the L5-S1 junction, C7, sternal notch, and acromioclavicular joints (bilateral). A standing static calibration trial was obtained to determine the local segment coordinate system and joint axes. Ankle and knee joint centers were defined as the points 50% between the malleoi and femoral epicondyle markers, respectively. The hip joint centers were defined as the points located 25% of the distance between the greater trochanter markers.17 The ankle markers (medial and lateral malleolus), knee markers (medial and lateral epicondyles), toe markers (distal aspect of the 2nd toe, 1st and 5th metatarsal heads), greater trochanters, and anterior superior iliac spines (ASIS) were removed prior to the dynamic trials.
Two-dimensional video and 3D motion analysis were collected during the following tasks in the following order: 1) Step Down, 2) Lateral Shuffle, 3) Deceleration, 4) Triple Hop, and 5) Side-Step-Cut. Details regarding the instructions provided to participants for each of the tasks can found in Table 2. These tasks were selected based on current knowledge of movements thought to be associated with various sport injuries. Participants were permitted to practice until comfortable with the performance of each task and could rest between trials as needed. One to two trials were obtained for each of the tasks above. As only a single repetition within a trial was needed for statistical analysis, two trials were obtained from some tasks to ensure that sufficient data were available in the case of technical errors (i.e., marker occlusion, etc.).
Data Analysis
The first successful trial was selected for each task and used for data analysis. A trial was successful if the participant performed the task as instructed with no marker occlusion. Marker position data were labeled in Simi Motion and then exported to Visual3D software (C-Motion, Inc, Germantown, MD, USA). Marker trajectory data were low-pass filtered at 12 Hz, using a fourth-order Butterworth filter. Joint angles were calculated using a X-Y-Z (sagittal-frontal-transverse) Cardan sequence. The trunk was modeled as a single rigid segment, defined proximally by two iliac crest markers and distally by two acromion markers. The 3D kinematic variables of interest were the frontal plane trunk and pelvis angles at peak knee flexion, which were calculated relative to the global reference frame.
For the 2D video analysis, the frame at peak knee flexion was visually identified. For the step down, the frame at which the contralateral heel touched the ground was used for analysis. Images were uploaded into ImageJ software (Version 1.50i, National Institute of Health, USA) for 2D angle assessments. Pelvis tilt was measured as the angle between the line connecting the ASIS’s and a horizontal line starting at the ASIS of the stance limb. A positive value represented contralateral pelvis drop and a negative represented contralateral pelvis rise (Figure 1). Trunk lean was measured was measured as the angle between a vertical line starting at the umbilicus and a line through the umbilicus and sternum. A positive value represented an ipsilateral lean (towards stance limb) and a negative value represented a contralateral lean (away from stance limb) (Figure 1). All 2D measurements were obtained by a single investigator who demonstrated acceptable intra-rater reliability for all pelvis (ICCs ranging from 0.74 to 0.99) and trunk angles (ICCs ranging from 0.77 to 0.98).

Statistical Analysis
Data were assessed for normality using the Shapiro-Wilk’s test. Out of the 20 variables, 15 satisfied normality. Given that the majority of the data met normality and that Pearson’s correlations are robust to extreme violations of normality,18 all correlations were conducted using parametric testing. Pearson’s correlation analysis was used to assess the association between the 2D and 3D frontal plane angles at the trunk and pelvis. Correlation coefficients were interpreted as very strong (>= 0.9), strong (0.7-0.9), moderate (0.5-0.7), weak (0.3-0.5), and negligible (0.0-0.3).19 Correlation analysis was performed separately for each task and segment. Prior to analysis, all variables were checked for outliers using Z scores. Variables with absolute Z scores > 3.0 were deemed outliers and removed.
Bland Altman plots were used to assess the level of agreement between the 2D and 3D frontal plane angles at the trunk and pelvis.20,21 Agreement was assessed separately for each task and segment. Limits of agreement (LOA) were used to represent the range in which an individual’s difference score fell 95% of the time, while the bias (mean difference, MD) was used to represent the average difference between the 3D and 2D angles (positive values indicated 3D overestimated). Prior to analysis, the MD between 2D and 3D angles was screened for outliers using Z scores. Variables with absolute Z scores > 3.0 were deemed outliers and removed. All statistical analyses were performed using SPSS (Chicago, Illinois, USA) and a custom MATLAB script (The MathWorks, Inc., Natick, MA) with alpha set at 0.05.
RESULTS
Descriptive Data
Descriptive statistics for the 2D and 3D frontal plane trunk and pelvis angles are presented in Table 3.
Correlation and Agreement between 2D and 3D Frontal Plane Pelvis Angles
The initial correlation analysis contained 1 outlier (deceleration), which was removed. Pearson’s correlation analysis indicated that all 2D and 3D frontal plane pelvis angles were significantly correlated in a positive direction (r = 0.54 to 0.73, all p < 0.001) (Figure 2).

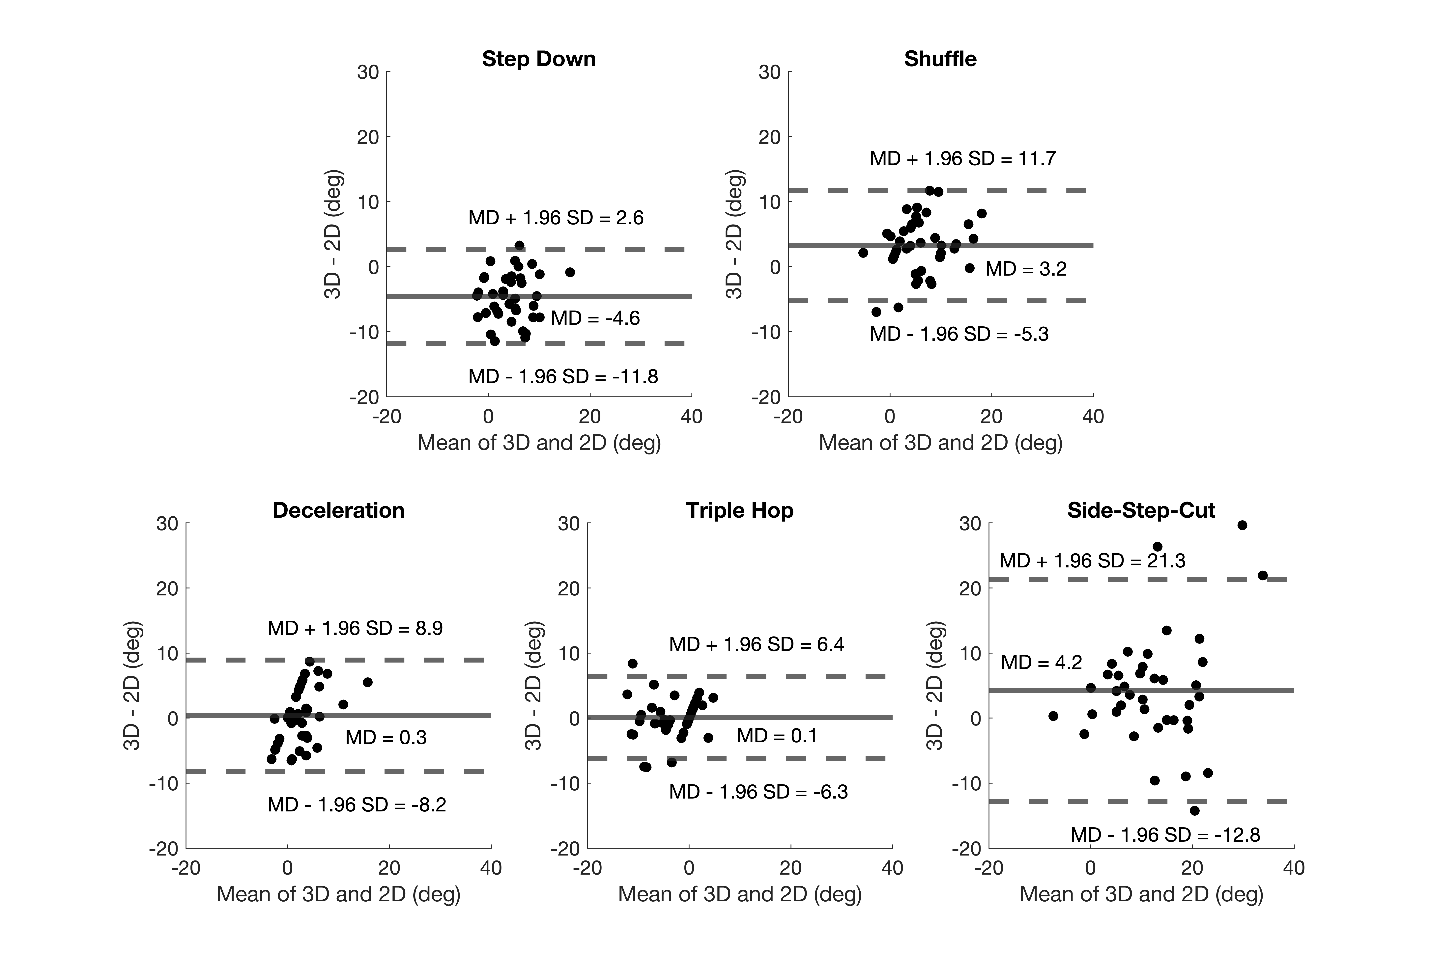
The initial Bland Altman plot analysis contained two outliers (deceleration and triple hop), which were removed. The mean difference (MD) between the 3D and 2D pelvis angles ranged from -4.6° (step down) to 4.2° (side-step-cut). The 95% LOA ranged from MD ± 7.2° (step down) to MD ± 17.1° (side-step-cut). The 95% LOA ranged from -12.8° to 21.3° across tasks (Figure 3). In all tasks, the 95% LOA included 0.

Correlation and Agreement between 2D and 3D Frontal Plane Trunk Angles
The initial correlation analysis contained one outlier (triple hop), which was removed. Pearson’s correlation analysis indicated that all 2D and 3D frontal plane trunk angles were significantly correlated in a positive direction (r = 0.81 to 0.92, all p < 0.001) (Figure 4).

The initial Bland Altman plot analysis contained two outliers (shuffle and triple hop), which were removed. The mean difference (MD) between the 3D and 2D pelvis angles ranged from -4° (side-step-cut) to 2.6° (shuffle). The 95% LOA ranged from MD ± 5.5° (step down) to MD ± 7.8° (side-step-cut). The 95% LOA ranged from -11.8° to 9.4° across tasks (Figure 5). In all tasks, the 95% LOA included 0.

DISCUSSION
The purpose of the current study was to assess the concurrent validity and agreement of 2D frontal plane angles for the pelvis and trunk with the respective 3D angles across a wide range of tasks. The current findings revealed that 2D frontal plane angles were correlated with the corresponding 3D angles for both the trunk (strong to very strong) and pelvis (moderate to strong). In addition, the Bland Altman plots indicated no systematic bias, high agreement, but wide 95% LOA. These results suggest that the use of 2D video to assess trunk and pelvis angles is appropriate, however caution is advised when high levels of agreement or accuracy is required.
In terms of the Pearson correlation coefficients related to the validation of 2D trunk motion, all were strong to very strong. In addition, absolute agreement for all tasks was below 5° and there was no systematic bias (as 0 was within the 95% LOA) (Figure 5). However, inspection of the LOA indicated that the 95% confidence interval around the bias was generally large. The tightest 95% LOA occurred during the step down (-5.3°, 5.6°), while the widest 95% LOA occurred during cutting (-11.8° to 3.9°). The spread in data during cutting may have been the result of the body rotation that naturally occurs during this task. Out of plane motion during tasks that involve a change in direction would be expected to affect the accuracy of the 2D measures of trunk motion.
The validity results for 2D trunk motion are consistent, in part, with previous literature in this area.10,11 The current findings for the triple hop (r = 0.92) (Figure 4) are in general agreement with Kingston et al. who reported a moderate absolute correlation coefficient (r = 0.65) during a similar task.11 However, our results for the step down (r = 0.90) (Figure 4) conflict with the results of Kingston et al.11 and Schurr et al.10 who reported no significant correlations between 2D and 3D measures of trunk motion during single limb squatting. It should be noted however that Kingston et al.11 reported a weak absolute correlation coefficient (r = 0.42) with borderline significance (p = 0.087). In addition, Schurr et al.10 examined trunk motion displacement while the current study examined trunk position at a singular time point (i.e., peak knee flexion). As such, caution should be taken in making direct comparison among studies.
The Pearson correlation coefficients related to the validation of 2D pelvis motion ranged from moderate to strong, with the smallest values being observed during deceleration and largest for the triple hop (Figure 2). In addition, absolute agreement for all tasks was below 5° and there was no systematic bias (as 0 was within the 95% LOA) (Figure 3). As found with the trunk however, the 95% confidence interval around the bias was generally large. The tightest 95% LOA occurred during the triple hop (-6.3°, 6.4°), while the widest 95% LOA occurred during cutting (-12.8° to 21.3°). As noted above for the trunk, the lower correlation coefficients and/or wider 95% LOA may be explained by trunk rotation that naturally occurs during change of direction tasks such as cutting and deceleration.
To date, previous validation studies for kinematic measures related to pelvis motion have only evaluated running,12,13 so direct comparisons of the current study findings to existing literature is limited. The current positive associations between 2D and 3D frontal pelvis motion for all tasks evaluated coincide with the findings of Dingenen et al. who reported that 2D and 3D pelvis drop were correlated during the stance phase during running.13 However, these findings conflict with Maykut et al., who reported that 2D and 3D pelvis motion during running were not correlated.12 Maykut et al. suggest that the differing frame rates for the 2D and 3D motion capture (60 Hz and 240 Hz, respectively) may have been responsible for their finding of a lack of agreement.
The findings of the current study have clinical implications. First, 2D measures of trunk and pelvis motion provide reasonable estimates of 3D motion across a wide range of functional tasks. Importantly, the current results indicate that 2D video methods may be appropriate for tasks that involve a change in direction. However, when high agreement or accuracy is required with 3D angles, 2D measures of the pelvis and trunk should be used with caution, particularly when there is body rotation. Nonetheless, 2D video may be useful for screening of persons who may be at risk for lower extremity injury. Future research is needed to determine if 2D measures of pelvis and trunk motion during high demand tasks has predictive value with respect to lower extremity injury.
There are several limitations of the current study that should be acknowledged. First, only healthy participants were evaluated. As such, the current findings cannot be generalized to various patient populations. Second, only 2D associations with 3D kinematic variables were assessed, using univariate analysis. It is possible that a multivariate regression approach with the addition of other 2D measurements (such as trunk or pelvis rotation) may have resulted in higher predictability. Third, this was a cross-sectional study, so the results do not make any assumptions of what 2D angles constitute increased injury risk. Fourth, although all reported correlations were statistically significant with moderate to very strong effect sizes, the clinical relevance of the current findings remain unknown and should be the focus of future investigations in this area. Fifth, despite the fact that measurement reliability was established for our 2D pelvis and trunk measures, the reliability of the corresponding 3D measures was not evaluated in the current study. This could have led to diminished agreement between the 2D and 3D measures for some tasks. Lastly, pelvis or trunk displacement was not evaluated. As such, the current findings are only applicable to singular measurements at peak knee flexion.
CONCLUSION
The results of the current study revealed that 2D frontal plane measures at the trunk and pelvis were moderately to strongly correlated with their respective 3D angle across a wide range of tasks. These findings suggest that 2D video analysis can be used as an alternative to 3D motion analysis to assess frontal plane motion of the trunk and pelvis. However, the ability of 2D trunk and pelvis angles to measure the corresponding 3D angles with high degrees of accuracy is limited, suggesting that 2D measurements should be used cautiously when high levels of agreement or accuracy are required.
Conflict of interest
The authors have no conflicts of interest to disclose